|
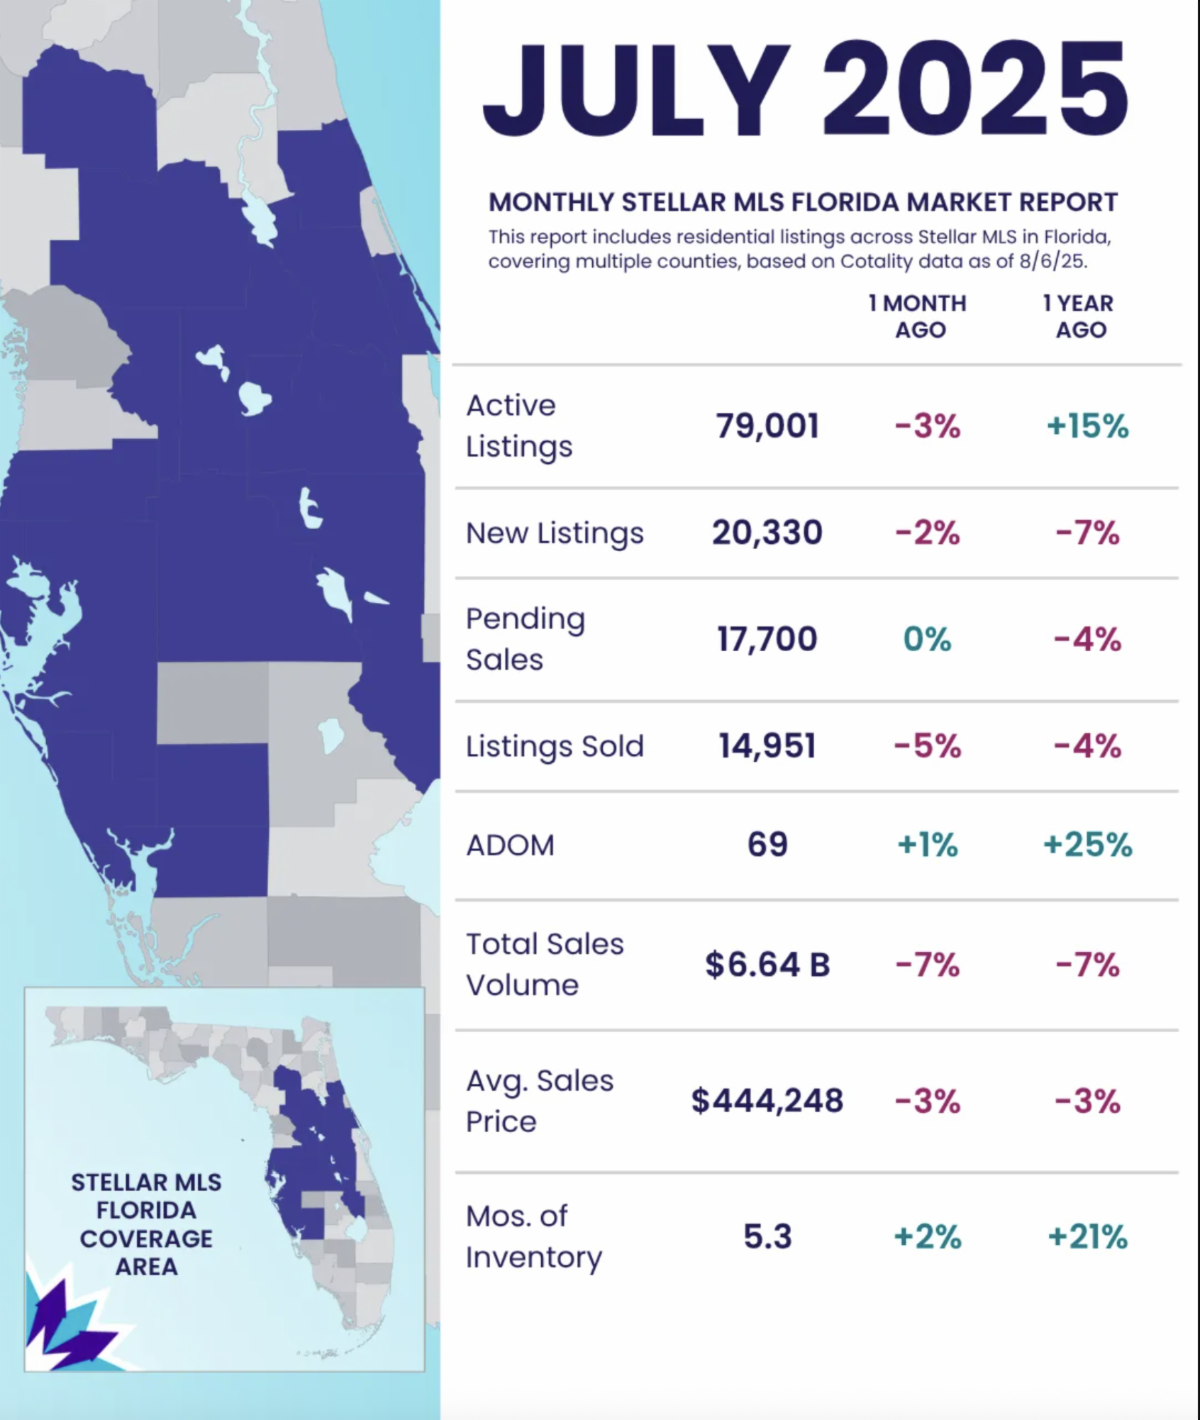
ℹ️ Report scope: Data covers all residential listings in the Stellar MLS Florida coverage area (multiple counties) with information as of Aug 6, 2025.
Each bullet compares July 2025 data to the previous month and year, based on the Stellar MLS Florida Market Report (residential listings, data as of Aug 6, 2025).
🏡 Active Listings: 79,001 (🔽3% from last month, 🔼15% from last year) — The number of homes on the market is slightly down from June but still significantly higher than July 2024.
🆕 New Listings: 20,330 (🔽2% from last month, 🔽7% from last year) — New listings dipped both month-over-month and year-over-year.
⏳ Pending Sales: 17,700 (↔️0% from last month, 🔽4% from last year) — Pending (under-contract) sales were flat compared to June and modestly lower than last July.
✅ Listings Sold: 14,951 (🔽5% from last month, 🔽4% from last year) — The number of closed sales fell relative to both last month and July 2024.
⏱️ Average Days on Market (ADOM): 69 days (🔼1% from last month, 🔼25% from last year) — Homes took a bit longer to sell than in June 2025 and much longer than in July 2024.
💵 Total Sales Volume: $6.64 billion (🔽7% from last month, 🔽7% from last year) — Total dollar volume of home sales declined from both June 2025 and July 2024 levels.
💰 Average Sales Price: $444,248 (🔽3% from last month, 🔽3% from last year) — The average sale price eased down slightly on both a monthly and yearly basis.
📦 Months of Inventory: 5.3 months (🔼2% from last month, 🔼21% from last year) — Housing supply (months of inventory) ticked up a bit from June and is notably higher than a year ago.
|