FOCUS 2022
Focus is LPL’s annual national conference, which attracts over 10,000 advisors and staff from around the country. After two years of virtual conferences, Don and Leslie were glad to be back in person for this informative and energizing event!
During their time at Focus, they heard directly from thought leaders, earned continuing education credits, received updates on laws and regulations, and learned how we can most effectively utilize LPL’s tools and technology.
They look forward to bringing this education and experience back to the rest of the team at Cornerstone and to all our clients as we gear up for the second half of 2022.
|
|
In case you missed it, make s to take a look at the
delivers market insights on what we can expect in the economy, policy, stocks, and bonds for the rest of 2022.
|
|
|
|
Did you see our latest post? |
Never miss a Cornerstone announcement - make sure you are following us on Facebook!
When you follow us you'll get access to up to date market information, helpful financial planning tools like calculators, and all Cornerstone office happenings!
Click the button below, make sure you're logged into your account and follow our Facebook page.
|
|
Click the icons below and don't forget to like, comment, and share our posts! |
|
Cornerstone
Fait Accompli
Harvard University
The first college in America was Harvard University, founded in 1636 in Massachusetts.
Today, it is known as one of the most prestigious and elite schools in the world.
|
|
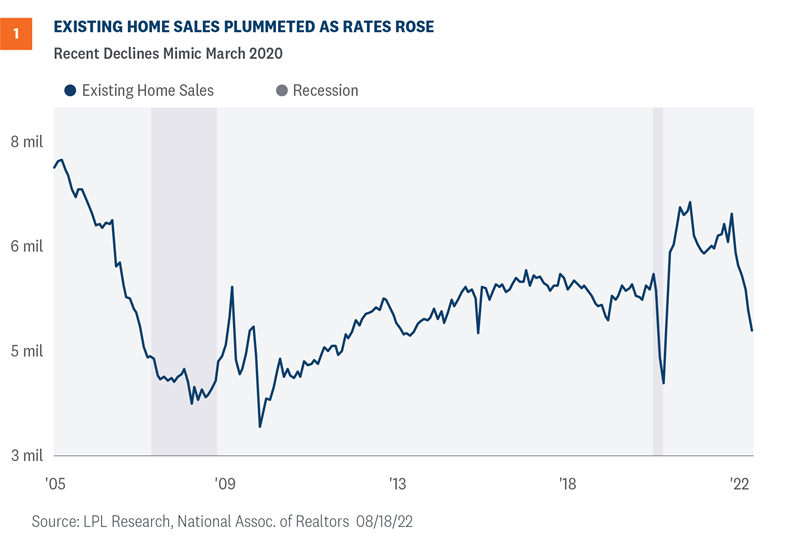
Existing home sales fell 5.9% in July, the sixth consecutive month of declines as higher interest rates weigh on housing affordability and prospective buyers. As the housing market slowed, so did prices. The median price for a single family home was $410,600, a decline of roughly $10,000 from June. However, homes do not stay on the market long. Over the last two months, homes were on the market for an average of only 14 days, three days shorter than a year ago.
Existing home sales plummet but inventory stays low
Existing home sales fell 5.9% in July, the largest one month decline since February and the sixth straight contraction. Contract closings fell to an annualized 4.81 million, the lowest level since May 2020 [Figure 1]. Outside of the onset of the pandemic, July levels were the lowest since late 2015 when the real estate market was
|
|
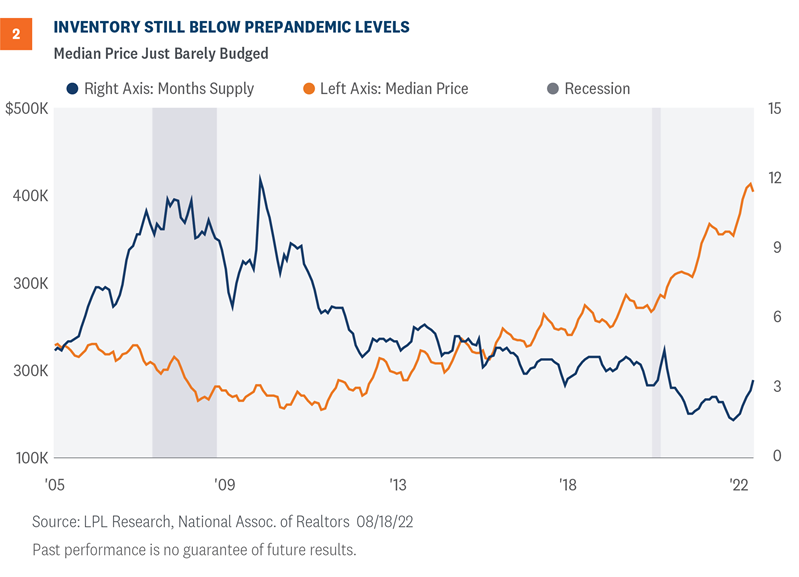
Although the rate of sales is slowing dramatically, the market is still short on supply of homes. At the current sales rate, it would take roughly three months to clear inventory [Figure 2]. As supply remains tight, homes are selling quickly and still at elevated prices. In July, the average existing home for sale was on the market for only 14 days, three days shorter than a year ago.
Traffic of prospective buyers fell
Forward-looking indicators suggest that the housing slowdown has more to go. The National Association of Home Builders (NAHB) index, another important housing metric, fell in August to below 50 for the first time since May 2020. Traffic of prospective buyers, a leading indicator of future sales, also fell to its lowest since May 2020. At this rate, home sales will likely continue to slow and residential investment could turn out to be a drag on Q3 economic growth. Given the lag between Federal Reserve (Fed) policy and the real economy, we have not likely seen the bottom in the housing market.
|
|
Regional differences are profound
Regional variations abound in both the soft survey data of the NAHB index and in the hard data of existing home sales. For NAHB, the regional divergence widened in August. The South is the only region above the breakeven level of 50 as households pursue areas with lower costs of living. Sustained inflation makes consumers increasingly sensitive to high prices and more likely to move to regions with lower costs of living if they can conserve disposable income.
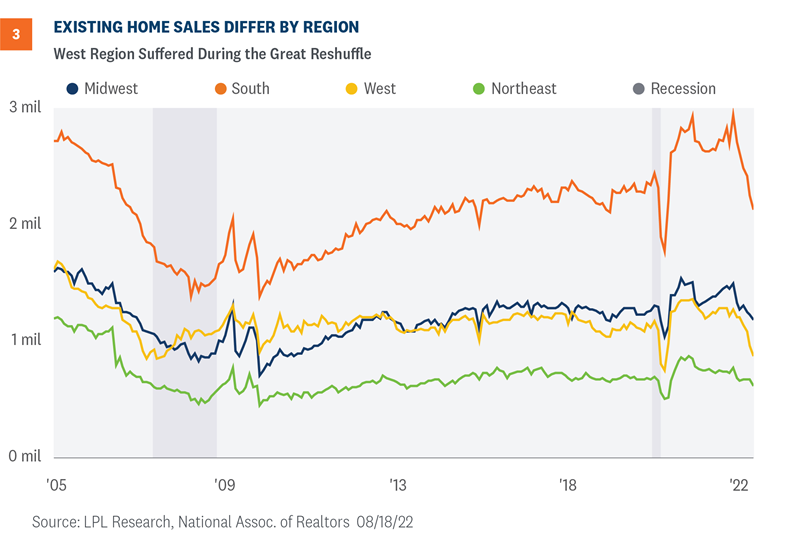
Sales of existing home in the West were hit hard in July. Outside of the pandemic, the rate of sales were close to sales rates in 2007 and 2008, when the economy was in the depths of a housing crisis [Figure 3]. In this current case, the problem is not in credit markets but in the great reshuffling of households as the hybrid work environment takes hold and workers are looking for more square footage for home offices.
|
|
Conclusion
The domestic economy will likely experience more declines in housing, yet this environment is very different from the Great Financial Crisis. The banking sector is better capitalized, we do not see a “Lehman moment” lurking, and homeowners are generally not under water with loan-to-value metrics. The potential risks are the Fed overtightens, consumer incomes fall as the job market weakens, and inflation does not cool as much as the market expects. A slowing housing market could also impact consumer spending through secondary wealth effects.
Jeffrey Roach, PhD, Chief Economist, LPL Financial
Marc Zabicki, CFA, Chief Investment Officer and Director of Research, LPL Financial
|
|
Have you taken advantage of CAPS yet?
Don't miss out!
Many of our clients ask how they benefit from taking action and initiating a Financial Plan for themselves.
When you sign up for our CAPS program, you will get access to:
A personalized financial plan, a place to keep all of
your accounts in one location and a secure place to store your
important documents.
|
|
Cornerstone Commentaire
"Education is a right,
not a privilege; it is an
opportunity,
not an entitlement."
Arne Duncan
|
|
Stay Safe, Stay Kind, Stay Strong, Stay Well
|
|
P.S. Please feel free to forward this commentary to
family, friends, or colleagues.
+++++++++++++++++++++++++++
The highest compliment
you can give us would be the
referral
of your friends or family!
|
|
IMPORTANT DISCLOSURES
This material is for general information only and is not intended to provide specific advice or recommendations for any individual. There is no assurance that the views or strategies discussed are suitable for all investors or will yield positive outcomes. Investing involves risks including possible loss of principal. Any economic forecasts set forth may not develop as predicted and are subject to change.
References to markets, asset classes, and sectors are generally regarding the corresponding market index. Indexes are unmanaged statistical composites and cannot be invested into directly. Index performance is not indicative of the performance of any investment and do not reflect fees, expenses, or sales charges. All performance referenced is historical and is no guarantee of future results.
Any company names noted herein are for educational purposes only and not an indication of trading intent or a solicitation of their products or services. LPL Financial doesn’t provide research on individual equities.
All information is believed to be from reliable sources; however, LPL Financial makes no representation as to its completeness or accuracy.
US Treasuries may be considered “safe haven” investments but do carry some degree of risk including interest rate, credit, and market risk. Bonds are subject to market and interest rate risk if sold prior to maturity. Bond values will decline as interest rates rise and bonds are subject to availability and change in price.
The Standard & Poor’s 500 Index (S&P500) is a capitalization-weighted index of 500 stocks designed to measure performance of the broad domestic economy through changes in the aggregate market value of 500 stocks representing all major industries.
The PE ratio (price-to-earnings ratio) is a measure of the price paid for a share relative to the annual net income or profit earned by the firm per share. It is a financial ratio used for valuation: a higher PE ratio means that investors are paying more for each unit of net income, so the stock is more expensive compared to one with lower PE ratio.
Earnings per share (EPS) is the portion of a company’s profit allocated to each outstanding share of common stock. EPS serves as an indicator of a company’s profitability. Earnings per share is generally considered to be the single most important variable in determining a share’s price. It is also a major component used to calculate the price-to-earnings valuation ratio.
All index data from FactSet.
This research material has been prepared by LPL Financial LLC.
This material is for general information only and is not intended to provide specific advice or recommendations for any individual. The economic forecasts may not develop as predicted. Please read the full Midyear Outlook 2021: Picking Up Speed publication for additional description and disclosure. This research material has been prepared by LPL Financial LLC.
Securities and advisory services offered through LPL Financial (LPL), a registered investment advisor and broker-dealer (member FINRA/SIPC). Insurance products are offered through LPL or its licensed affiliates. To the extent you are receiving investment advice from a separately registered independent investment advisor that is not an LPL affiliate, please note LPL makes no representation with respect to such entity.
Not Insured by FDIC/NCUA or Any Other Government Agency | Not Bank/Credit Union Guaranteed | Not Bank/Credit Union Deposits or Obligations | May Lose Value
RES-1244950-0822 | For Public Use | Tracking # 1-05317808 (Exp. 08/23)
Securities and Advisory Services offered through LPL Financial, a Registered Investment Advisor. Member FINRA / SIPC .
|
|
|
|
|
|
|