|
Gordon T Long Research exclusively distributed at MATASII.com
Subscribe to Gordon T Long Research - $35 / Month - LINK
Complete MATASII.com Offerings - $55/Month - LINK
SEND YOUR INSIGHTFUL COMMENTS - WE READ THEM ALL - [email protected]
| |
|
UnderTheLens - MARCH 2023
Macro Analytics
| |
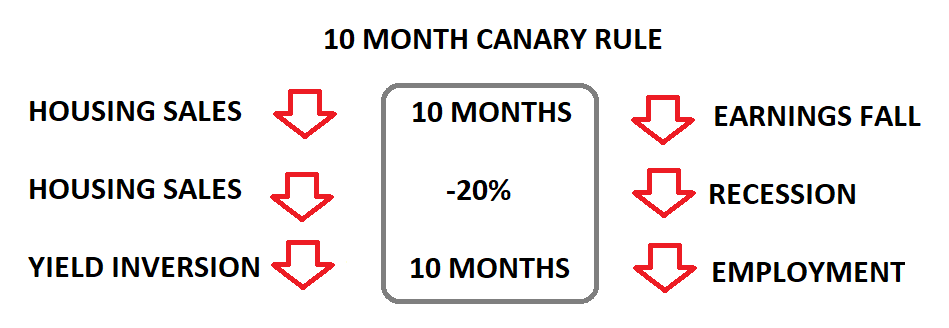
HOUSING'S "10 MONTH CANARY" RULE
The US Housing sector is one of the pillars of the US Economy. When the US Housing sector experiences serious disruption it can be expected to result in earning contraction in ~10 months. Housing is a proven US leading indicator. With existing homes prices falling over the last 7 consecutive months, for a decline of 13.2% since its peak, we can be fairly certain that a recession is near at hand. We are seeing further proof across the array of leading, coincident and lagging economic indicators we monitor.
- A Leading Indicator:
- Leading Economic Ind (LEI) = -6.08
- A Coincident Indicator:
- Non-Farm Payrolls - Review 'Labor Layoffs Coming' for the adjustments made to real labor numbers
- A Lagging Indicator:
- Layoffs - Review 'Labor Layoffs Coming' for the tracking of the growing magnitude of layoffs
In this newsletter we present further evidence by tying our Leading to Lagging indicators to give specific timing insights for contracting earnings & employment for a recession.
| |
|
VIDEO PREVIEW (click image)
Pay-Per-View Page Link
| |
THIS WEEK WE SAW
PCE: 5.4% Y-o-Y on Expectations of 5.0%
PCE: Major upward revisions to prior months,
Inflation Expectations Surged: 4.1% M-o-M
| |
|
=========
WHAT YOU NEED TO KNOW
Since the release of the unexpected rise in the January Labor numbers on February 3rd, expectations for a higher Fed Funds Terminal Rate has increased along with tightening Financial Conditions and the possibility of larger Fed Rate moves. This is currently placing downward pressure on equities and strengthening the US dollar.
- HOUSING'S "10 MONTH CANARY RULE"
-
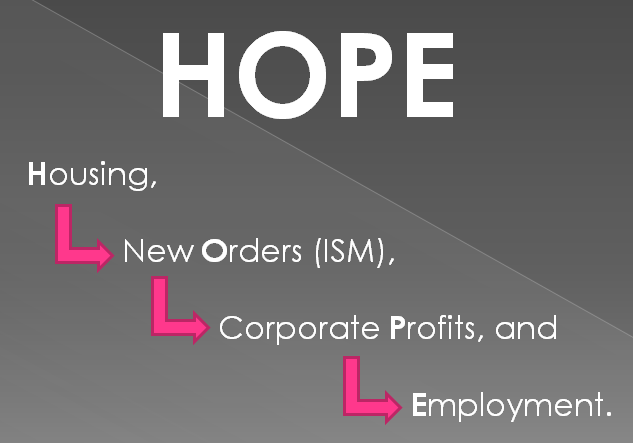
"HOPE" - is an effective roadmap of how Housing activity flows into S&P Earnings.
-
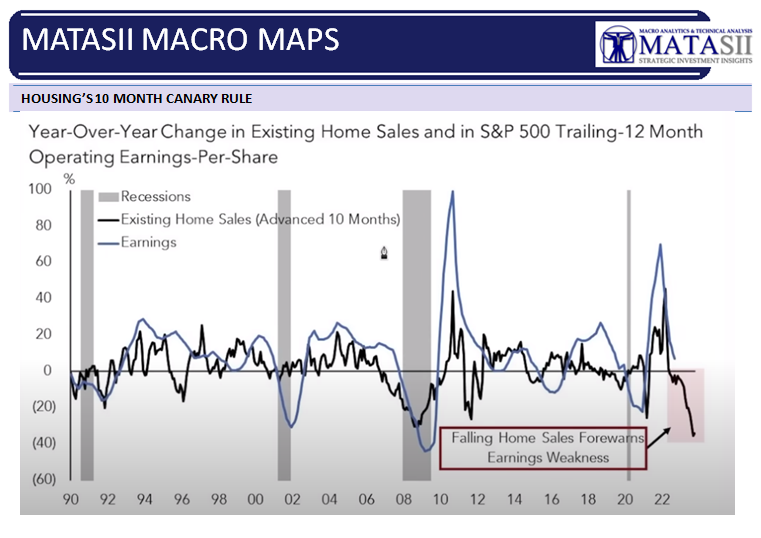
Our research shows that by comparing the Year-Over-Year changes in Existing Homes Sales with a lagging S&P 500's Trailing 12 month operating earnings per share we get a very predictive result of how Housing should be expected to impact earnings.
- With existing sales having most recently peaked in January 2022 we should expect earnings to see Q1 2023 earnings to contract noticeably from their positive reporting.
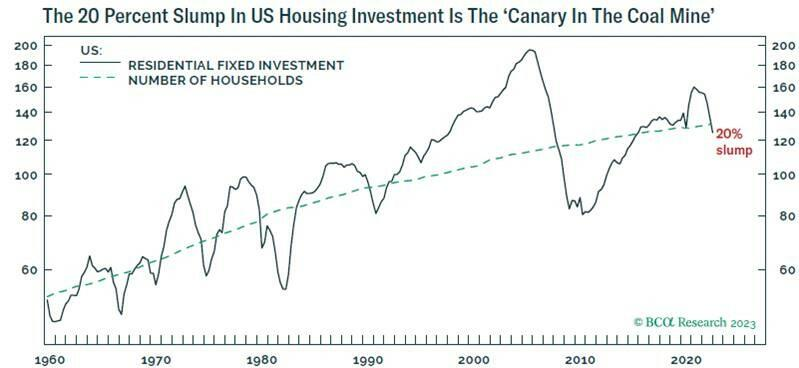
- It has been shown that a 20 precent slump in US Housing Investment is the preverbal "Canary in the Coal Mine". It is signaling a near certainty of a US Recession.
- BRIDGING LEADING AND LAGGING INDICTOR TIMING
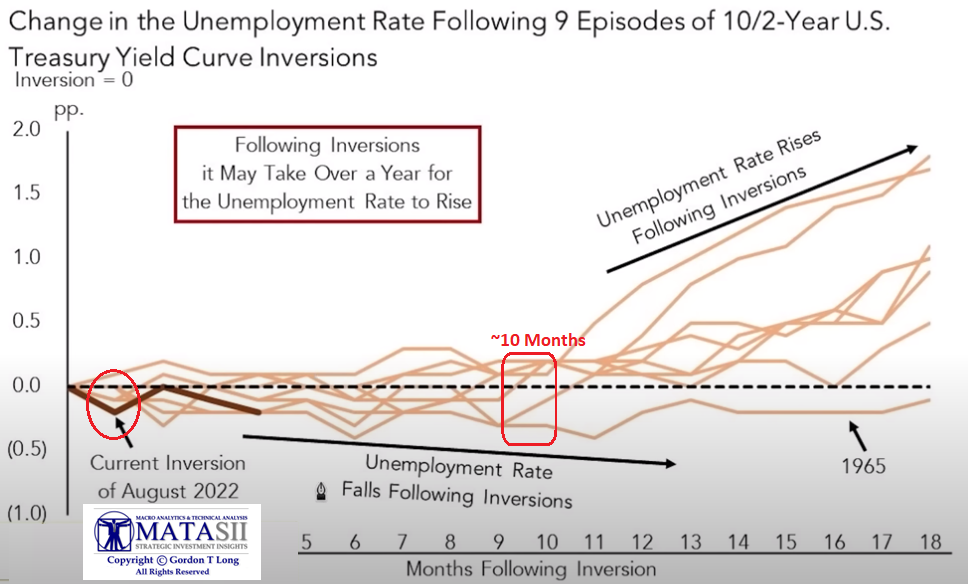
- When we compare historical unemployment rates following 9 prior episodes of the 2s10y US Treasury Yield Curve Inversion we can expect by JUNE 2023 a surge in unemployment layoffs.
- A SHOCK TO EXPECTATIONS
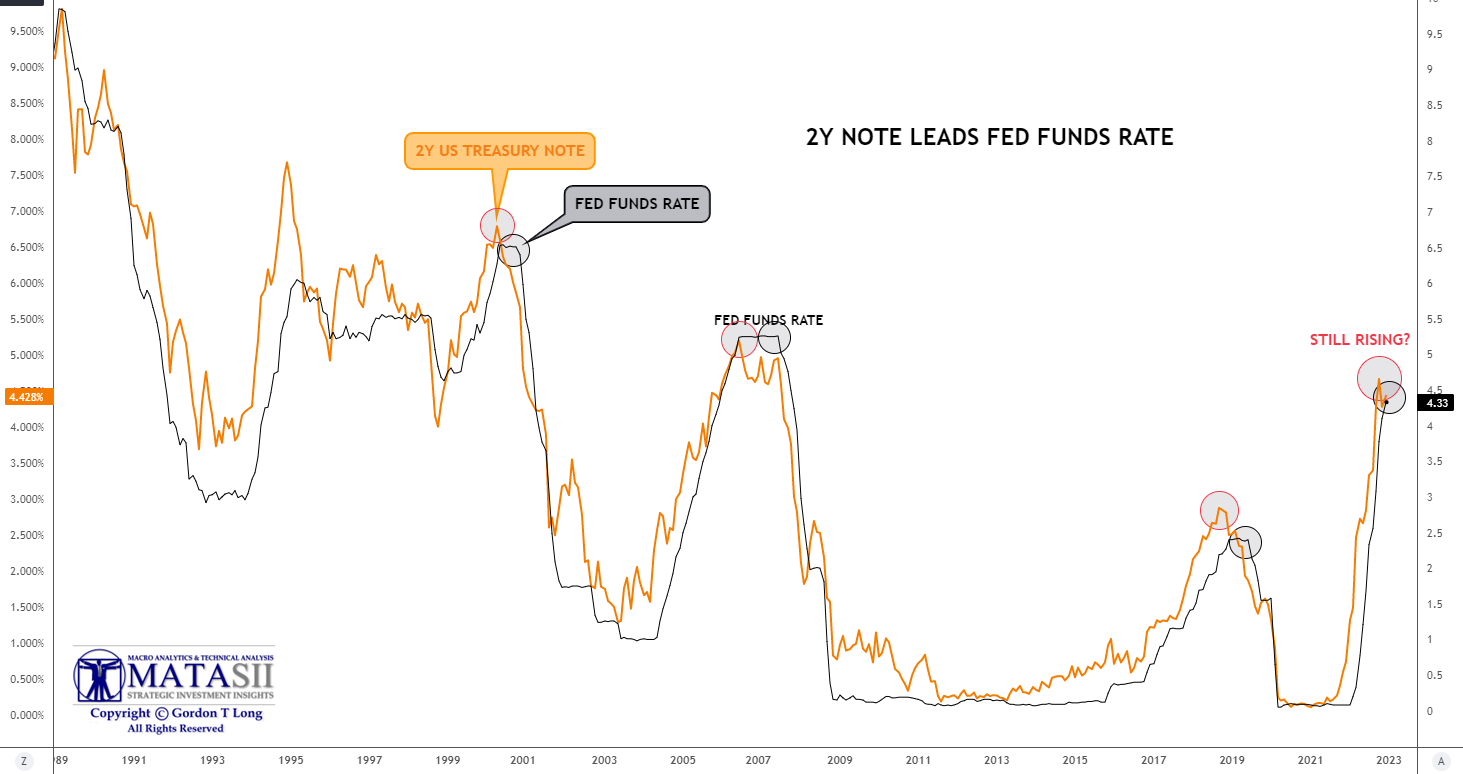
- Continue to watch the yield on the 2Y Treasury Note signal as it has historically always led the Fed Funds Rate.
- INFLATION IS ANYTHING BUT "TRANSITORY'!
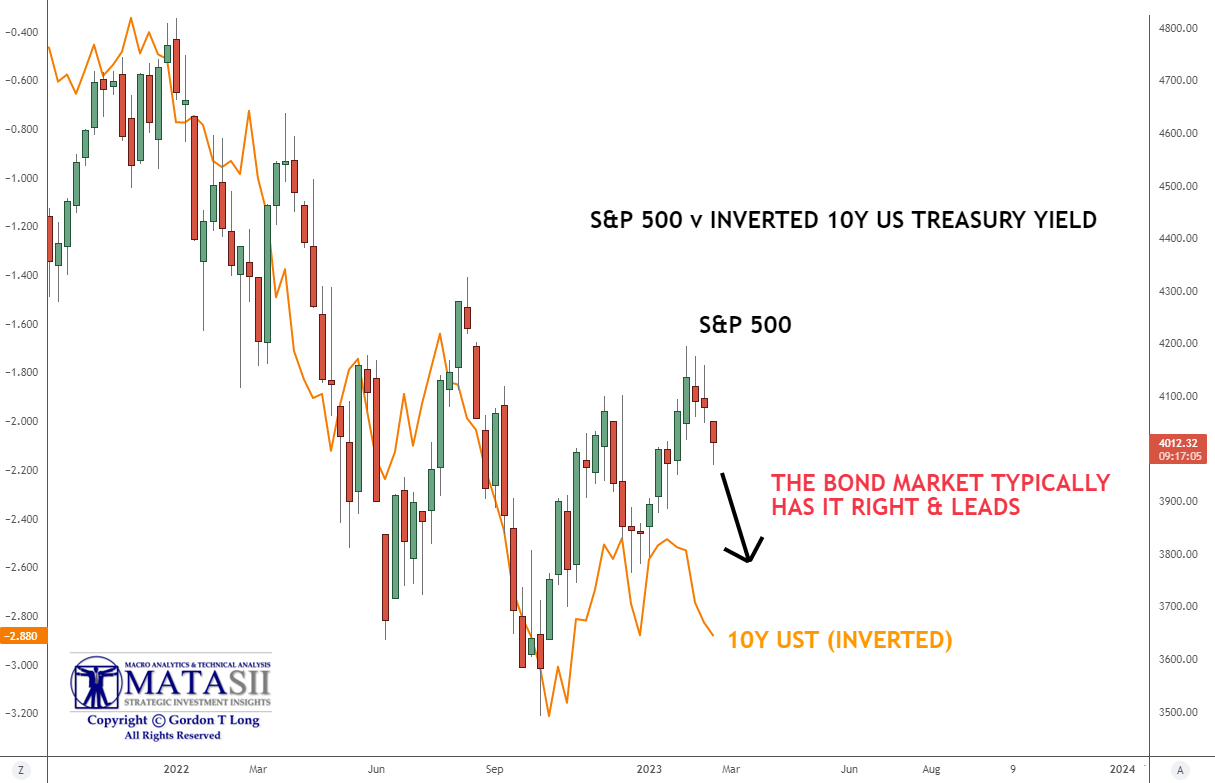
- The Bond Market supports the view that the Federal Reserve is way behind the curve and inflation is neither anywhere near being under control nor is it "Transitory"!
- We presently see inflation settling in the intermediate term in the 4% to 5% range.
- WHAT THE YIELD CURVE IS TELLING US
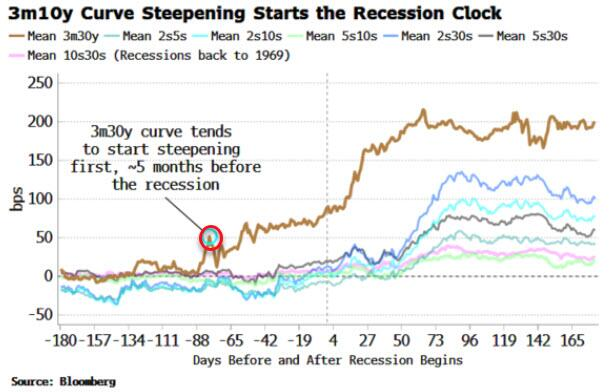
- The 3m30y Curve tends to start steepening first at ~5 months before the recession,
- The 3m10y Curve steepening starts the recession clock.
| |
|
- Most of the present “no-landing” optimism comes from robust employment data.
- Payrolls have added significantly more jobs than the household survey since last March, as more jobs have been created than employees. Payrolls are thus likely overstating underlying economic resilience if a rising number of people need more than one job,
- Employment data is among the most lagging and heavily revised. It is one of the reasons recessions appear to happen so fast, as it becomes clear the economy was already faring worse than thought.
- The Fed will focus on the data as it is. When you combine this with the current disinflationary trend in the US likely on the cusp of ending, due to a China-driven global cyclical upturn, the central bank is poised to keep policy tighter for longer.
- The downturn is thus liable to be worse, leaving the Fed needing to cut rates more.
- The maximum inversion in the yield curve this cycle would be historically consistent with over 500 bps of rate cuts. This is not a prediction, but it suggests that the Fed will cut more than is currently priced. As long as it is in higher-for-longer mode, more cuts should be priced.
The fully expected and overdue recessionary deflationary scare to arrive in H2 2023.
=========
| |
|
HOUSING'S "10 MONTH CANARY" RULE
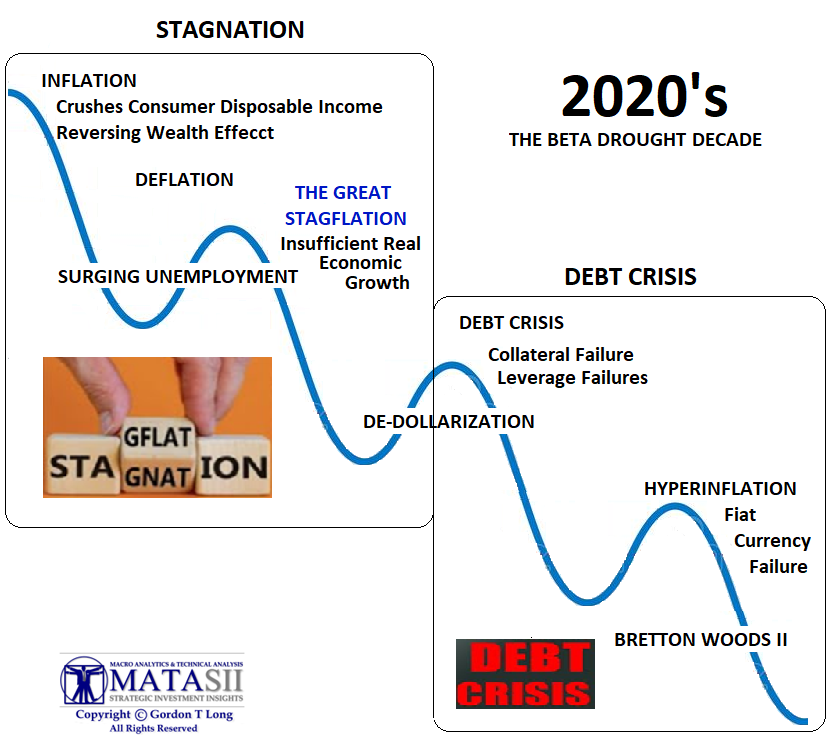
Higher interest rates suffocate the most indebted parts of the economy – homeowners, homebuilders, and housing investment – before it suffocates the broader economy. We mentioned this sequence in this month's UnderTheLens video (see illustration right) recently revisited by Michael Lebowitz at RIA.
The "HOPE" roadmap compliments our research where we compare the Year-Over-Year changes in Existing Homes Sales with the S&P 500's Trailing 12 month operating earnings per share or EPS (shown below). In our analysis we advance Existing Homes Sales by 10 months. When we do this we get a very strong predictor of the impact of how a change in Housing flows through to impacting overall S&P 500 EPS.
S&P 500 EARNINGS ARE LIKELY WEAKEN NOTICEABLY IN Q1, THEN TO DROP PRECIPITOUSLY WITH Q2 2023 REPORTING!
| |
US residential fixed investment (home building) has slumped by 20 percent in the past year – a rate of decline that places it on a par with the major housing recessions of 1990, 1980, 1973, 1965, and 1951. Housing recessions matter because they are the ‘canary in the coal mine’ for economy-wide recessions. Most housing recessions presage economic recessions. The very well respected BCA Research supports our findings by specifically citing a 20 percent slump in US Housing Investment as its' preverbal "Canary in the Coal Mine". | |
|
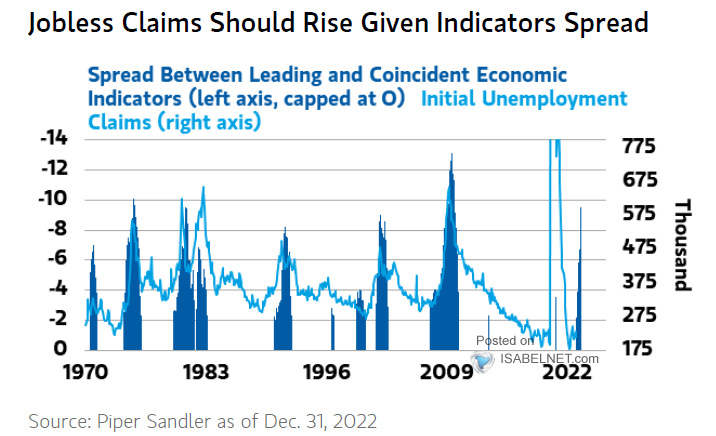
BRIDGING LEADING AND LAGGING INDICATOR TIMING
To the right we highlight the spread between leading and coincident economic indicators with the Initial Unemployment Claims. It shows a very high probability of a pending surge in unemployment.
When we then compare historical unemployment rates following 9 prior episodes of the 2s10y US Treasury Yield Curve Inversion we get a clearer expectations of timing. There has normally been a 10 month lag between the Inversion and the surge in the unemployment rate.
INVERSION = August 2022 with UNEMPLOYMENT Rate Surging ~10 months later ==> JUNE 2023
|  | |
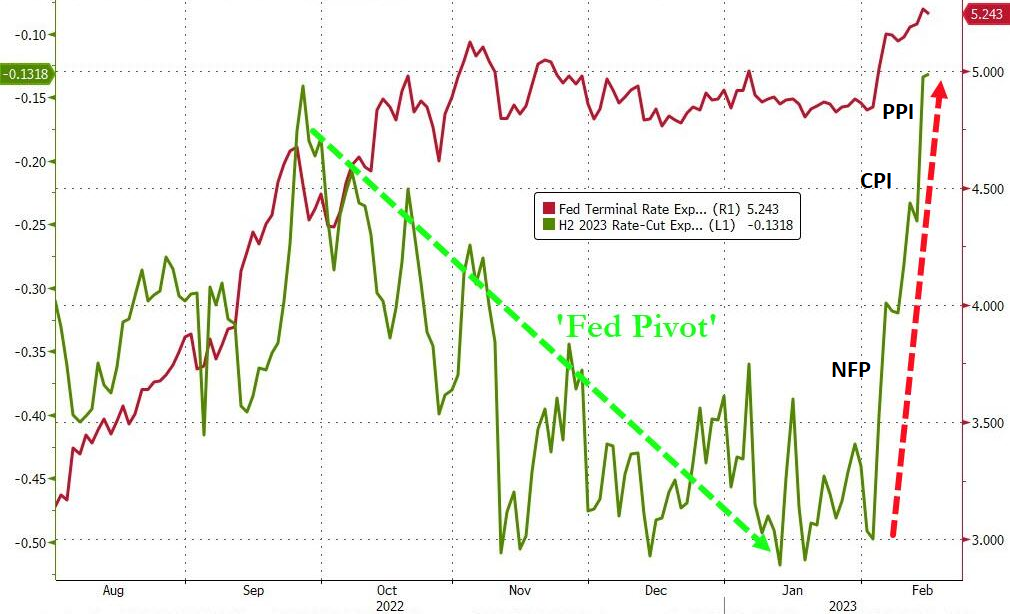
A SHOCK TO EXPECTATIONS
This week's CPI and PPI releases forced significant reassessment of the timing of the much anticipated Fed Pivot. The chart to the right shows the degree of shift in the expectations for the Fed Pivot since the prior week's Non-Farm Payroll (NFP) surge.
The Fed's expected Terminal Rate (shown in red) has also risen to ~5.35%, with a lot of chatter now looking for a possibility of 6% before any Pivot occurs. Additionally, there are trial balloons being pushed into the media of the Fed increasing its inflation target to 2.8 - 3% from its current long held 2% target.
Continue to watch the yield on the 2Y Treasury Note, as it has historically always led the Fed Funds Rate. It is the view of many, (myself included), that the Fed actually follows the 2 Year Treasury Bill, as it represents what the Primary Dealers (the actual shareholders of the Federal Reserve System) expect. We are likely to see both the 2Y and Fed Funds Rate rise further and then pause as it did in the prior periods labeled below.
| |
|
YOUR DESK TOP / TABLET / PHONE ANNOTATED CHART
Macro Analytics Chart: SUBSCRIBER LINK
| |
|
INFLATION IS ANYTHING BUT "TRANSITORY'!
We need to appreciate that interest rates below the inflation level are a stimulus, because they amount to economic subsidization of debt, and the spending or investment which results.
According to David Stockman, former OMB head under President Ronal Reagan:
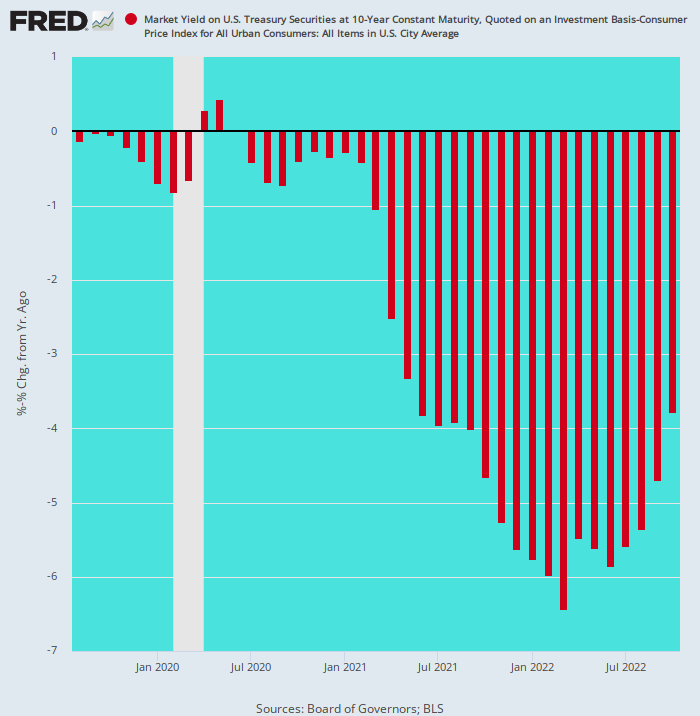
"Even the primitive Phillips Curve theory of the growth/inflation trade-offs screams out that the Fed is way behind the curve, even based on its own defective economic models. After all, why in the world has it permitted its ultimate control valve and benchmark—the 10-year UST—to carry a negative real yield for 36 of the last 38 months.
That’s right. There is nothing like the pattern shown (to the right) in modern history, yet somehow the Keynesian dunderheads domiciled in the Eccles Building have been surprised at the virulence and persistence of the current inflationary tide."
Inflation-Adjusted Yield on 10-Year UST, August 2019 to October 2022
CHART BELOW: Bond Market supports Stockman's view that the Federal Reserve is way behind the curve and inflation is neither anywhere near being under control nor is it "Transitory"! We are with him there, though we see it settling in the 4% to 5% range.
| |
|
YOUR DESK TOP / TABLET / PHONE ANNOTATED CHART
Macro Analytics Chart: SUBSCRIBER LINK
| |
|
WHAT THE YIELD CURVE IS TELLING US
To help with some timing on the above discussion we need to examine the current Inverted yield curve.
- The 3m30y Curve tends to start steepening first at ~5 months before the recession.
- The 3m10y Curve steepening starts the recession clock.
The clock is now ticking, and the yield curve is signaling: the next recession could begin as early as the middle of this year -- ~JUNE 2023
- While the yield curve’s inversion tells you a recession is on the way, it’s the subsequent re-steepening that indicates the slump’s imminence.
- Not all yield curves are alike, and some parts of it begin to steepen much sooner than others.
- One of the first to move is the 3m30y curve. In previous recessions it started to steepen well before most other parts of the curve.
The 3m30y curve (within the chart to the right above) has been steepening since mid January, the longest it has risen without making a new low since it peaked last May. This is significant as the curve has not re-flattened despite the Fed recently galvanizing its hawkishness.
| |
|
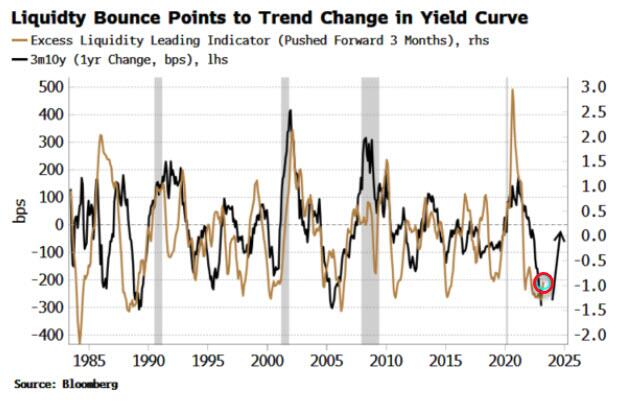
Notes and charts from Simon White, Bloomberg
What is important to understand is that the the steepening comes at the same time as a rise in excess liquidity (the difference between real money growth and economic growth).
Excess liquidity is one of the few indicators that gives a lead on the yield curve, itself a leading indicator. Today’s yield-curve steepening becomes very noteworthy when combined with the turn in excess liquidity, and gives credence to the notion that the 3m30y curve has indeed bottomed.
| |
|
CONCLUSION
Normally inflation only starts falling once the recession has begun, and real wages do not get a boost until almost a year after the recession’s onset.
Recessions are caused when a number of different cycles:
- The income cycle,
- The inventory cycle,
- The credit cycle,
- The employment cycle
begin to worsen at the same time, and reinforce one other.
Currently real incomes and housing are enjoying reprieves from slowing inflation and an easing in the pace of rate hikes, although these will be fleeting as prices soon begin to rise again, and high absolute rates continue to plague housing.
Those reprieves are just painkillers, masking the discomfort but not treating the underlying causes.
- Credit continues to tighten,
- manufacturing remains depressed, and
- consumer and business expectations on the economic outlook continue to be fairly dire.
The change of sequencing only delays - and does not avert - the recession.
| |
Most of the “no-landing” optimism comes from robust employment data. But there are enough doubts here to permit some healthy skepticism.
Payrolls have added significantly more jobs than the household survey since last March, as more jobs have been created than employees. Payrolls are thus likely overstating underlying economic resilience if a rising number of people need more than one job.
I LAID OUT IN THIS MONTH'S UnderTheLens VIDEO THE DETAILS OF THE MANIPULATION
ADDITIONALLY:
- The birth-death adjustment has added 1.3 million jobs to non-seasonally-adjusted payrolls, mainly driven by the Quarterly Consensus on Employment and Wages (QCEW). But this has started to revise payrolls down, recently taking them 287k lower in 2Q22.
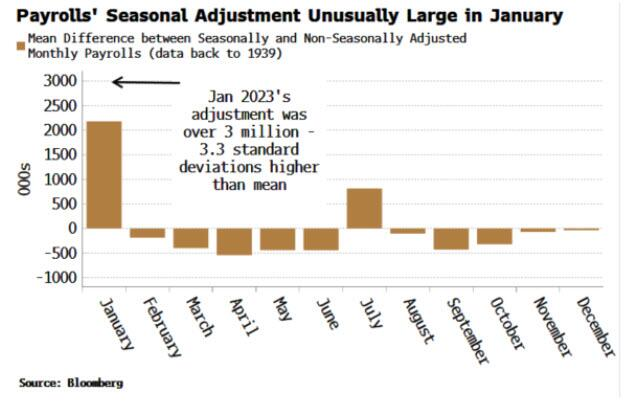
- The +517k monster payrolls print that fueled most of the recent optimism was affected by a much larger than normal seasonal adjustment, even for a January. Without the adjustment, over 2.5 million jobs were lost last month.
Employment data is among the most lagging and heavily revised. It is one of the reasons recessions appear to happen so fast as it becomes clear the economy was already faring worse than thought. But the Fed will focus on the data as it is. When you combine this with the current disinflationary trend in the US likely on the cusp of ending due to a China-driven global cyclical upturn, the central bank is poised to keep policy tighter for longer.
The downturn is thus liable to be worse, requiring the Fed to cut rates further. The maximum inversion in the yield curve this cycle would be historically consistent with over 500 bps of rate cuts. This is not a prediction, but it suggests that the Fed will cut more than is currently priced. As long as it is in higher-for-longer mode, more cuts should be priced.
| |
CURRENT MARKET PERSPECTIVE | |
A CRITICAL TIPPING POINT APPROACHING
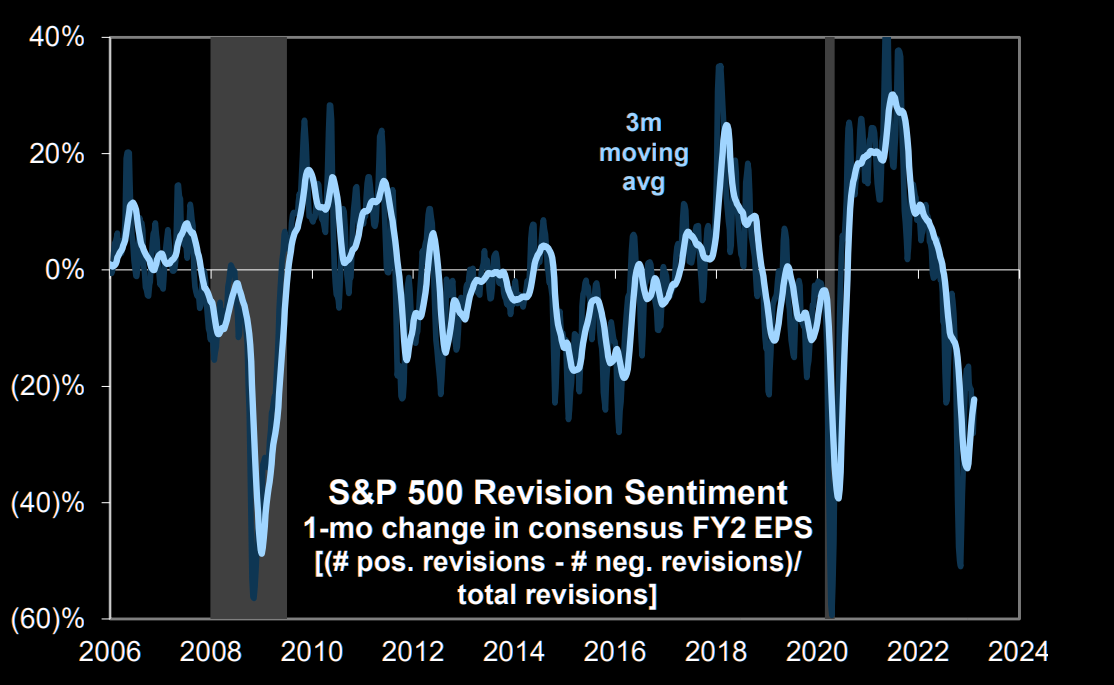
CHART RIGHT:
Negative EPS revisions suggests risk of hard landing.
The current breadth of negative EPS revisions is consistent with prior recessions.
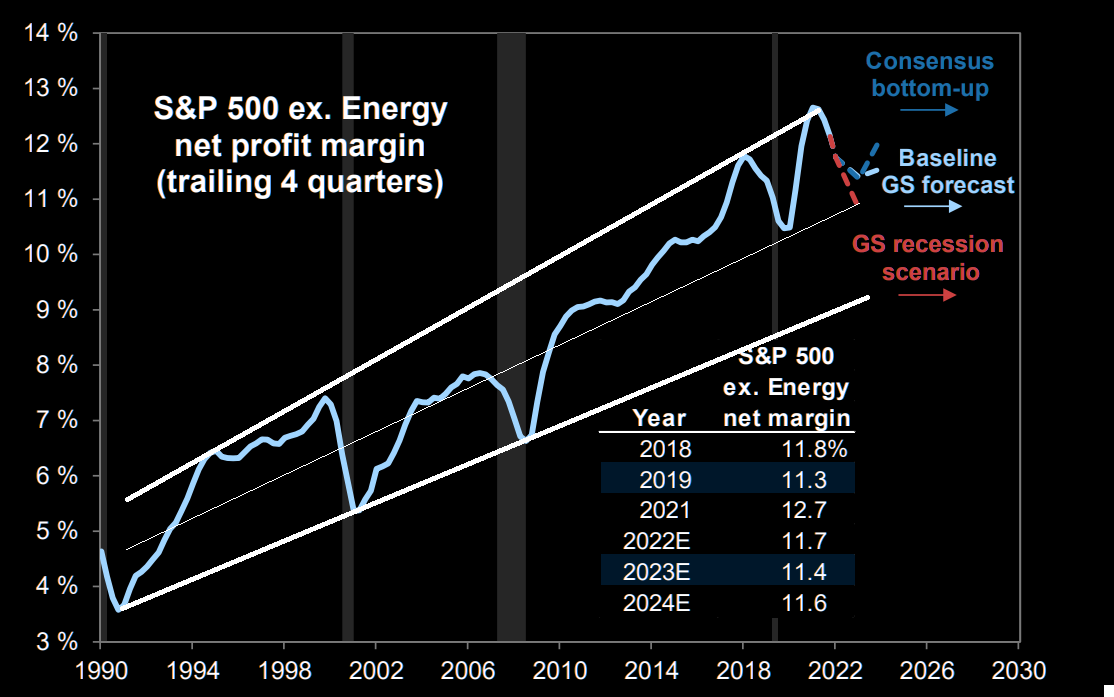
CHART RIGHT:
Margins (ex-Energy) will highly likely revert to pre-pandemic level in the Intermediate term.
S&P 500 (ex. Energy) margin will looks to fall from 12.7% peak (2021) to 11.4% (2023).
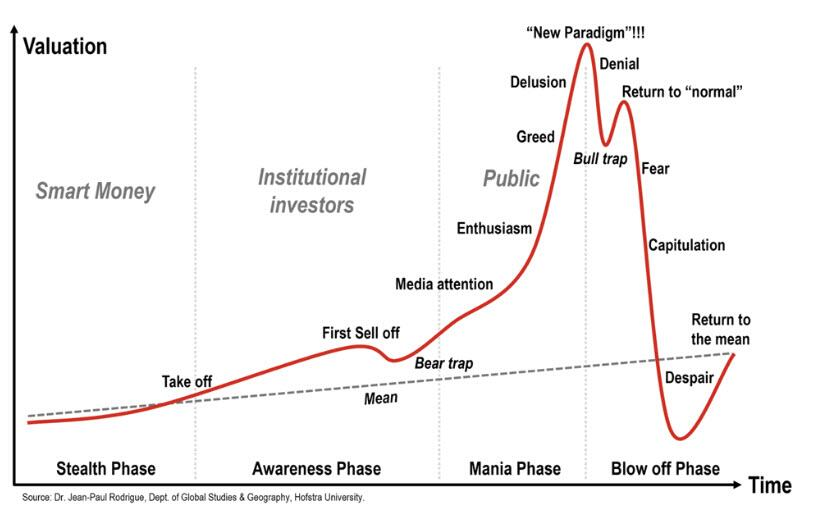
BELOW:
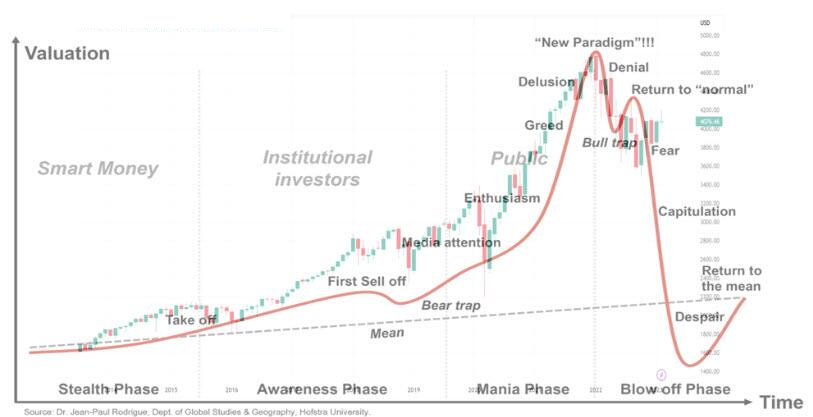
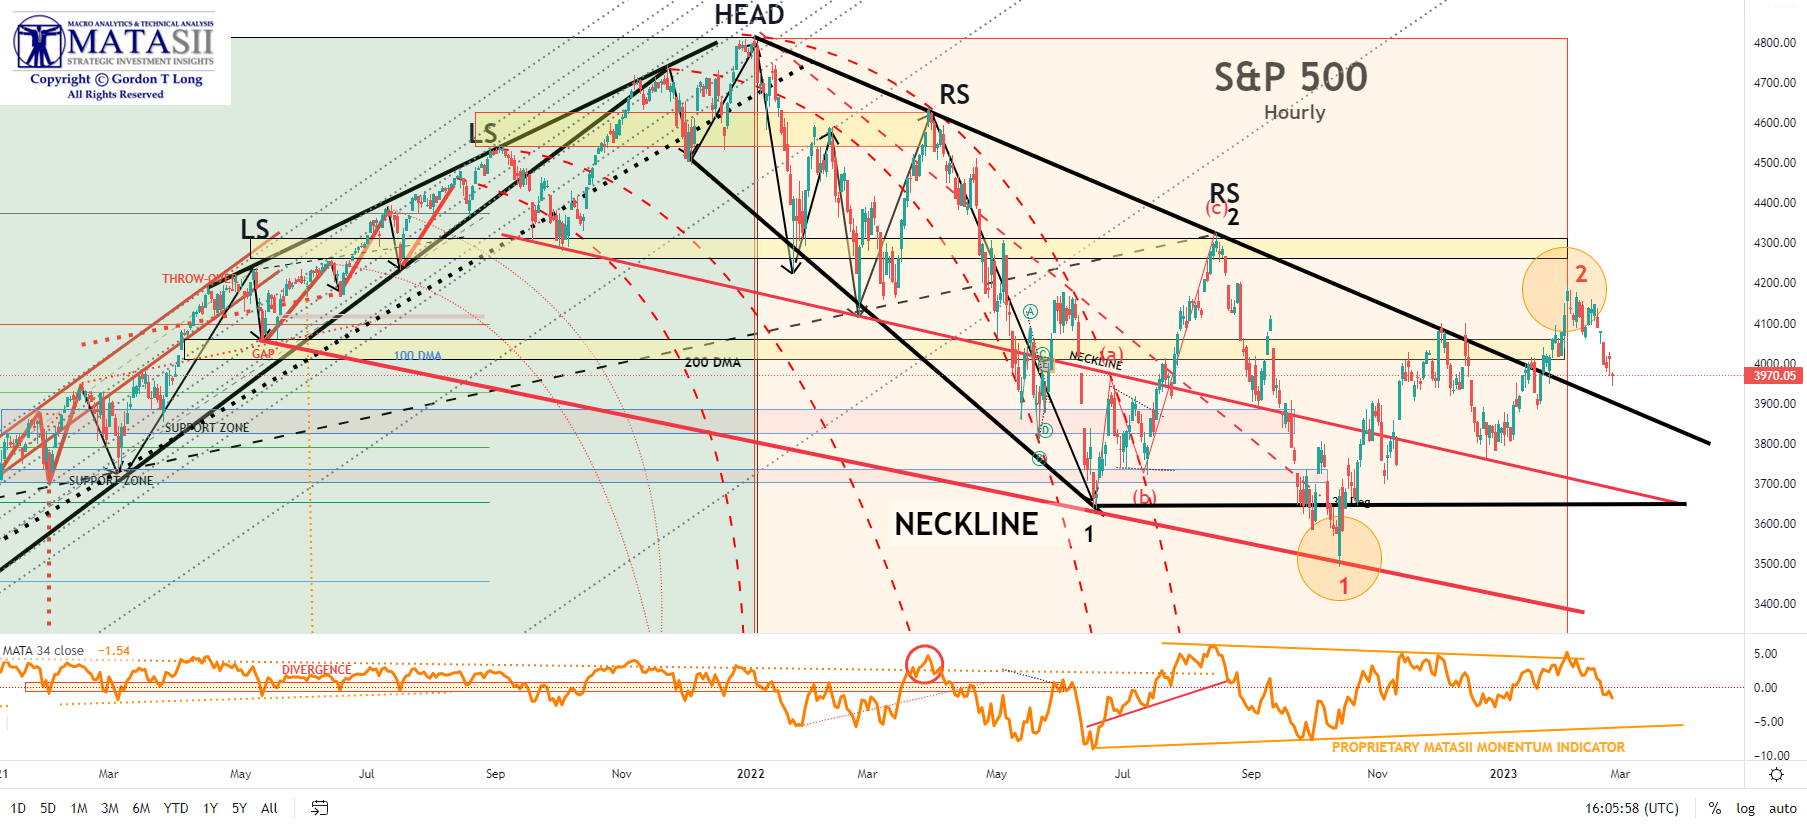
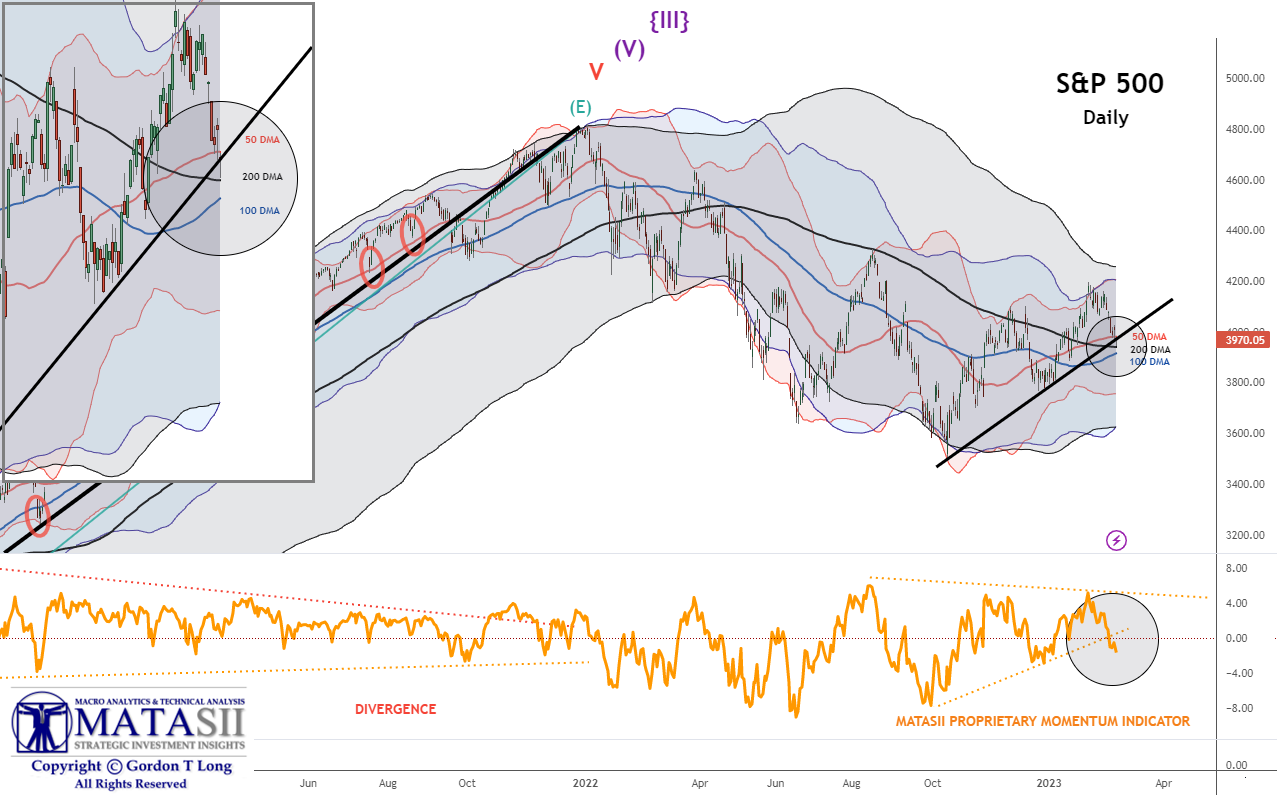
The current S&P 500 is overlaid onto classic bear market (lower chart 2).
| |
|
If the chart below is accurate ........ | |
...... then watch carefully for the confirmation of a breakage of each of the long term trend lines shown below - especially the lower red neckline! Minimally. we should soon retest the lower horizontal support level (in black). | |
|
YOUR DESK TOP / TABLET / PHONE ANNOTATED CHART
Macro Analytics Chart Above: SUBSCRIBER LINK
| |
NOTICE Information on these pages contains forward-looking statements that involve risks and uncertainties. Markets and instruments profiled on this page are for informational purposes only and should not in any way come across as a recommendation to buy or sell in these assets. You should do your own thorough research before making any investment decisions. MATASII.com does not in any way guarantee that this information is free from mistakes, errors, or material misstatements. It also does not guarantee that this information is of a timely nature. Investing in Open Markets involves a great deal of risk, including the loss of all or a portion of your investment, as well as emotional distress. All risks, losses and costs associated with investing, including total loss of principal, are your responsibility.
| |
MATASII'S STRATEGIC INVESTMENT INSIGHTS | |
2020 VIDEOS OUTLINING THE COMING RISE IN INFLATION & COMMODITY PRICES | |
|
UnderTheLens - MARCH 2023
Pay-Per-View Options
| |
|
RELEASED - 02-22-23
VIDEO: 24 Minutes with 52 supporting slides.
NEW RELEASES IMMEDIATELY AVAILABLE TO NON-SUBSCRIBERSON A PAY-PER-VIEW BASIS
$4.99
Pay-Per-View Page Link
| |
|
LINK: SUBSCRIBER LINK
TRANSCRIPTION: SUBSCRIBER LINK
| |
IDENTIFICATION OF HIGH PROBABILITY TARGET ZONES | |
Learn the HPTZ Methodology!
Identify areas of High Probability for market movements
Set up your charts with accurate Market Road Maps
Available at Amazon.com
| |
The Most Insightful Macro Analytics On The Web | |
PO Box 1224,
Norton, MA 02766
(508) 285 2213
| | | | | |