November 4, 2026


Greetings!


As the last few votes are tallied in the midterm elections and a strong performance by the Democrats brings divided government, the same crosscurrents that have shaped markets this year remain in place:


·        The artificial intelligence (AI) spending boom has drained excess cash flows from some of the biggest U.S. technology stocks and added to their debt loads. However, the investment has also contributed to solid economic and profit growth. Free cash flow, which deducts capital expenditures from operating cash flow, is still expected to increase 11% over the next year (source: FactSet).


·        Interest rates are higher than in recent decades, and the Federal Reserve (Fed) may hike rates in December, but the 10-year Treasury yield has fallen 0.4% over the past month to below 5% and well within historical norms.


·        Oil prices are too high, and inflation remains elevated, but we believe the chances of a diplomatic solution in the Middle East may have increased now that the election is behind us. Market-based measures of inflation expectations remain well anchored, and the Kevin Warsh-led Fed has credibility as an inflation fighter.


·        Midterm elections have historically brought uncertainty and increased market volatility, but that uncertainty has tended to fade quickly once votes are counted. The S&P 500 has been positive in the 12 months after midterms 19 times in a row, dating back to 1950, averaging a gain of over 15%.


Against that backdrop, the average S&P 500 stock gained 5% in October even as the more common market capitalization-weighted index fell 0.9%. As the technology and AI-heavy communication services sectors fell, the other nine sectors rose. As the Russell 1000 Growth Index slipped 6.1%, its value counterpart gained 4.4%. As U.S. large cap benchmarks dipped, small caps eked out a gain. The benefits of diversification were also evident in bonds, as the Bloomberg Aggregate Bond Index gained 2.4% for the month.


The earnings picture is also diversifying, bolstered by a strong U.S. economy that grew at a 3.4% annualized pace in the third quarter, adjusted for inflation. While S&P 500 companies are on track to grow earnings 30% overall in the third quarter, including the big AI spenders, excluding technology, earnings are still growing at a solid mid-teens pace. That’s a key benefit of diversification.


Our message for investors is this: Stay diversified. Own companies using and benefiting from AI, not just those building computing capacity. Keep your focus on strong stock market fundamentals — a resilient U.S. economy and healthy corporate sector. Finally, don’t make portfolio decisions based on political outcomes. Any election-related volatility will likely present an opportunity for long-term investors.

_______________________________________________________________________________

How much do midterms matter to markets?

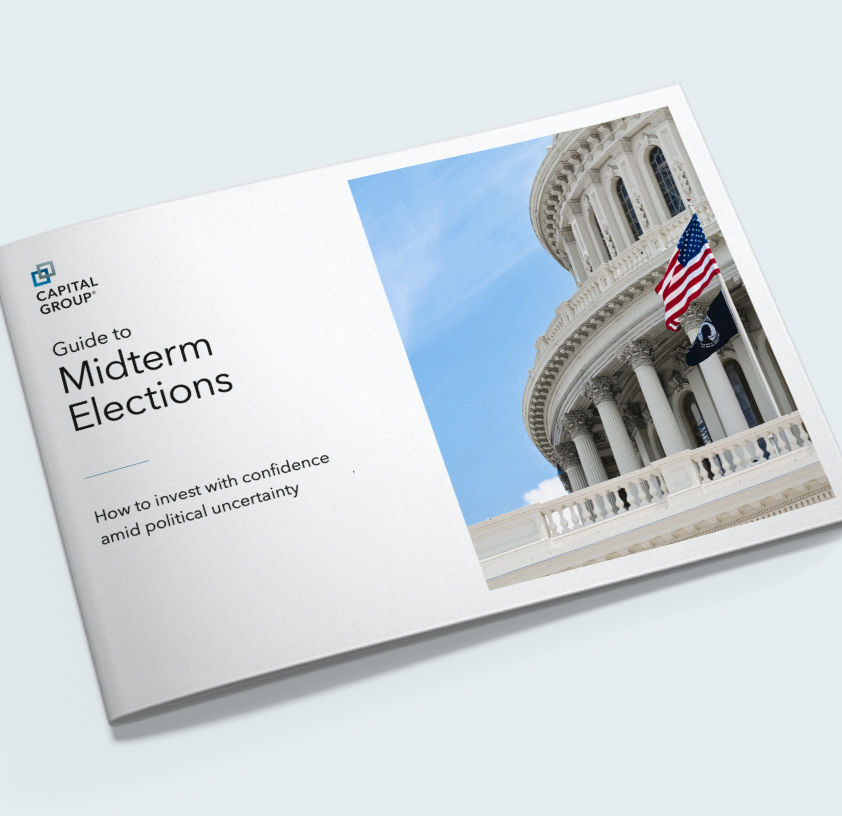
Every election cycle generates uncertainty, but how do midterms specifically affect stocks? After crunching more than 90 years of data from the S&P 500 Index, we found that U.S. stocks have exhibited some unique characteristics in midterm election years. Although a variety of factors may influence the investment environment in any given year, the five charts contained in the Guide to Midterm Elections can help answer key questions as campaign season draws to a close.


• Do markets rebound after midterm elections?

• Does control of Congress impact investment returns?

• How have markets typically behaved in midterm years?

• Does which party is in office impact stock performance?

Download the guide.

As always, please reach out to me with questions.


Thank you for your continued trust.


I am accepting new clients. As always, If you're not happy with your financial path, from your Spending plan and Investments to Insurance and Planning for your family or business, have questions, or just want help fighting the pirates and weathering the storms in your financial life, please reach out to me. Schedule your review today.


Warmest Regards,


Scott Stillman, CFP®, CLU® 

Financial Coach


1500 Marina Bay Dr #1441

Dock 2, Bldg. 104

Clear Lake Shores, TX 77565


Office: (281) 409-3645

Secure Text: (281) 643-7079

Scott.Stillman@LPL.com

ScottsPlan.com

Facebook  LinkedIn  Twitter
 

budget pressures, and corporate debt to fund the AI buildout are creating upward pressure on rates that may not abate soon. But before you get the urge to sell stocks, keep in mind 5% Treasury yields were normal before the Global Financial Crisis, before quantitative easing became a household term. The 10-year Treasury yield spent much of the late 1990s near 6%.

Other risks to consider include the need for companies making significant AI capital commitments to demonstrate tangible productivity and profit gains, while energy disruptions in the Middle East could keep inflation elevated and weigh on confidence. And while markets tend to handle political gridlock well, election-related uncertainty could spark bouts of volatility.

From a portfolio management perspective, we continue to recommend investors emphasize diversification, balancing AI beneficiaries, attractive income opportunities, and commodity-linked exposures to hedge against macro risks. There are genuine uncertainties, but also a solid foundation in corporate profitability and steady economic growth that points to staying the course.

As always, please reach out to me with questions. Thank you for your continued trust.

Warmest Regards,


Important Information

This material is for general information only and is not intended to provide specific advice or recommendations for any individual. There is no assurance that the views or strategies discussed are suitable for all investors or will yield positive outcomes. Investing involves risks including possible loss of principal. Any economic forecasts set forth may not develop as predicted and are subject to change.

References to markets, asset classes, and sectors are generally regarding the corresponding market index. Indexes are unmanaged statistical composites and cannot be invested into directly. Index performance is not indicative of the performance of any investment and do not reflect fees, expenses, or sales charges. All performance referenced is historical and is no guarantee of future results.

LPL Financial does not offer access to or purchase of initial public offerings (IPOs).

This material is intended for informational and educational purposes only and does not constitute investment research, a research report, or a recommendation regarding any specific security or issuer.

Any company names noted herein are for educational purposes only and not an indication of trading intent or a solicitation of their products or services. Any securities or company names discussed in this material for illustrative purposes should not be construed as investment advice or recommendations.

All data is provided as of October 7, 2026.

All index data from FactSet.

The Standard & Poor’s 500 Index (S&P500) is a capitalization-weighted index of 500 stocks designed to measure performance of the broad domestic economy through changes in the aggregate market value of 500 stocks representing all major industries.

The NASDAQ Composite Index measures all NASDAQ domestic and non-U.S. based common stocks listed on The NASDAQ Stock Market. The market value, the last sale price multiplied by total shares outstanding, is calculated throughout the trading day, and is related to the total value of the Index.

The fast price swings in commodities will result in significant volatility in an investor’s holdings. Commodities include increased risks, such as political, economic, and currency instability, and may not be suitable for all investors.​

Bonds are subject to market and interest rate risk if sold prior to maturity. Bond values will decline as interest rates rise and bonds are subject to availability and change in price.

There is no guarantee that a diversified portfolio will enhance overall returns or outperform a non-diversified portfolio. Diversification does not protect against market risk.

Past performance does not guarantee future results.

Asset allocation does not ensure a profit or protect against a loss.

This research material was prepared by LPL Financial, LLC.


Not Insured by FDIC/NCUA or Any Other Government Agency

Not Bank/Credit Union Guaranteed

Not Bank/Credit Union Deposits or Obligations

May Lose Value


RES-0007124-0526 | For Public Use | Tracking #1185284 | #1185291 (Exp. 10/2027)