X Share This Email
LinkedIn Share This Email
 

The S&P 500 index again edged down last week (2.5 percent), in part because financial and tech sector earnings did not align with forecasts. Capital One Financial’s 9.1 percent slide was among the most notable decreases, along with Intel’s 4 percent dip.


Energy and materials, including metals and oil industry services, exceeded expectations (3.1 percent and 2.6 percent, respectively), helping offset the declines.


Snapshot of Q4 2025 economic data:

image-34 image

Source: YCharts As of the dates noted above


Trading Partners


As a chaser to last week’s notes on tariff wars with the EU, please note that the European block is America’s number one trade partner (18.8 percent of the total):

image-12 image

Based on January to October 2025 data from the U.S. Census Bureau


As noted in the Visual Capitalist write-up on the data, trade dynamics vary depending on the nation. The U.S. runs trade surpluses with countries including the Netherlands and Belgium but has trade deficits with Ireland and Germany.


Table:

image-24 image

Source: Visual Capitalist


Based on January to October 2025 data from the U.S. Census Bureau


U.S-China trade saw a tectonic shift in the January to October period: U.S imports from China decreased 26.7 percent, the largest by far among U.S. trading partners.


Where did we turn for offsets? Imports from Vietnam surged 40.4 percent, followed by a 37.4 percent increase of inbound shipments from Vietnam.


Natural Gas + Electricity Demand


U.S. natural gas futures rose more than 80 percent in recent days, surpassing $7 per million British thermal units (MMBtu), as an arctic storm caused increased heating demand and disrupted supply in producer regions, including Texas.


Supply flow could yet come to a standstill if gas infrastructure in the Gulf Coast succumbs to strain, according to energy analysts. The last major failure of U.S. natural gas infrastructure occurred during a winter storm in 2021 that killed 246 people in Texas.


The winter storm that stretched across half the country and strained natural gas supply also knocked out electricity to more than a million customers on Sunday with outages primarily concentrated in Tennessee, Mississippi, Louisiana, Georgia, and Texas.


The threat to the 200 million people depending on the electric grid this week will come from sub-freezing temperatures, ice, and freezing rain that can accumulate and topple trees and power lines.


Nevada Jobs


Nevada’s seasonally adjusted unemployment rate remained at 5.2 percent in December, according to the Nevada Department of Employment, Training and Rehabilitation (DETR). The state’s labor force grew by 9,353 from its November level, and the seasonally adjusted number of nonfarm jobs in Nevada was 1,571,400 — a decrease of 0.6 percent from the previous December.


  • Las Vegas employment increased by 2,000 jobs (0.2 percent) over November — but decreased by 9,800 jobs (-0.8 percent) since December 2024.


  • Reno employment had a decrease of 700 jobs (also 0.2 percent) — and a decrease of 800 jobs (-0.3 percent) since December 2024.


Nevada vs. the nation:

image-33 image

Source: DETR

image-25 image

Source: DETR


Self-Employed


Western and New England states tend to have higher rates of self-employment, with Montana and Vermont (15.7 percent) topping the rankings, according to 2024 Census Bureau data. Their large agricultural sectors — 23,800 farms covering 57.4 million acres of farmland in Montana and a slew of dairy and maple syrup farms in Vermont — are supported by temporary 1099 workers vs. full-time, year-round employees.


Leading the self-employment metric in the Mountain West in 2024 were Idaho and California (13.7 percent) and Utah (13.1 percent). The states with the lowest ratios were New Mexico (10.2 percent), Arizona (10.8 percent), Washington (11.0 percent), and Nevada (11.1 percent), which — as it so often does — matched the national average.

image-13 image

Based on 2024 Census Bureau data


West Virginia has the smallest share of self-employed workers across states (6.5 percent), followed by Alabama (8.9 percent).


State Facts for Students


The Census Bureau’s new state-based data tool is fun for kids of all ages, if not exactly bursting with the latest numbers (as of 2023). Nevada snapshot:

image-32 image
image-27 image
image-31 image

Note that between 2010 and 2022:


  • Fruit and vegetable markets increased from one to 41


  • Fast-food restaurants increased from 2,111 to 2,907


  • Video and disc rental stores disappeared.


Random Stuff


The internet supplied a variety of notable non-economic content over the past few days, including two we wanted to share, with acknowledgement that we are fuzzy on the size of the Venn Diagram overlap representing Fact Pack science nerds and NBA fans:


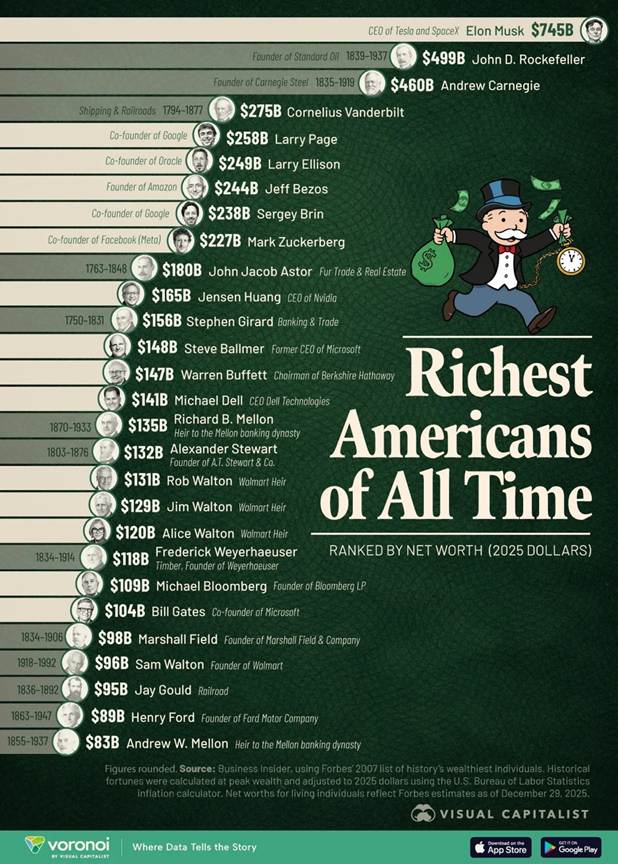
American Wealth


When all-time net worth is tallied in 2025 dollars, Mr. Rockefeller is second only to Elon Musk (green shading indicates that the possessor of wealth is no longer living):

Data source: Business Insider + Forbes’ list of history’s wealthiest individuals  As of December 2025


Note that three members of the Walton family—Rob, Jim, and Alice Walton—appear individually on the ranking graphic.


Global Cooperation Grid


Collaboration structures around the globe are shifting, according to the Global Cooperation Barometer co-developed by McKinsey and the World Economic Forum.


Drawing on 41 metrics across five pillars, the report shows the strongest gains where cooperation aligns with national interests, particularly for climate and nature concerns and innovation and technology.


Other pillars saw declining multilateralism: trade and capital, and health and wellness. Peace and security saw the sharpest decline in cooperation of the five pillars, driven by escalating conflicts, rising military spending, and displacement.

image-28 image

As of 1/8/26


Global Tourism


Most travel dollars enjoyed per nation and region via Visual Capitalist:

image-15 image

As of 2025


Note that Spain followed the U.S. with 106.5 billion, and even war-torn Ukraine registered $1 billion in receipts.


Rent


Rounding out this week’s Visual Capitalist infographics is a U.S.-dollar adjusted look at average rents for 3-bedroom housing in major metros around the world. The cultural and architectural meccas that are Mexico City, Tokyo, and Barcelona struck us as particularly attractive locales:

image-14 image

Data source: Deutsche Bank As of June 2025


Event Reminder

image-29 image

More info and registration here.

On the Horizon


Hightower wealth management advisor and Fact Pack co-founder Mike PeQueen:


Next week’s earnings reports will bring much-needed perspective as we learn how the nation’s largest firms fared in the fourth quarter of 2025. All eyes and ears will be tuned in to numbers from companies including Apple, Microsoft, IBM, META, AT&T, Verizon, Visa, Mastercard, American Express, Exxon Mobil, Chevron, and UnitedHealth Group. Economic reports will include delayed data on the December producer price index, and on Wednesday we will have the Fed’s Open Market Committee rate decision.


Next week’s MarketWatch calendar:

image-30 image

Data & Dialogue About the Economy


The Fact Pack is a monthly business e-report co-authored by Mike PeQueen of Hightower Las Vegas and John Restrepo of RCG Economics, which combines important metrics relevant to business decision makers and financial commentary on the current issues facing the economy.


See what's happening on our social media sites!

Facebook  X  LinkedIn
Mike PeQueen
Hightower Las Vegas
John Restrepo
RCG Economics