|
Happy Belated Groundhog Day to those who celebrate.
We don’t wish to upset any devoted Punxsutawney Phil fans, but we feel it is incumbent upon us to note that Phil’s forecasts in recent years have been about as accurate as a coin toss. Predictions gained by way of observing America’s most famous ground-dwelling woodchuck were correct 50 percent of the time between 2011 and 2020, according to analysts at the National Oceanic and Atmospheric Administration.
Other groundhog stats:
| |
|
Source: Interesting Facts as of 2025
(Editor’s note: For those unaware, the American tradition of watching groundhogs search for their shadow as a means of winter forecasting came by way of a religious holiday celebrated on February 2 by German immigrants.)
Urban Rat Boom
When we ran across this rodent-centric ScienceAdvances.com story with an economic and climate angle, we couldn’t resist inserting it right after this week’s opening topic. (Sorry, Phil.)
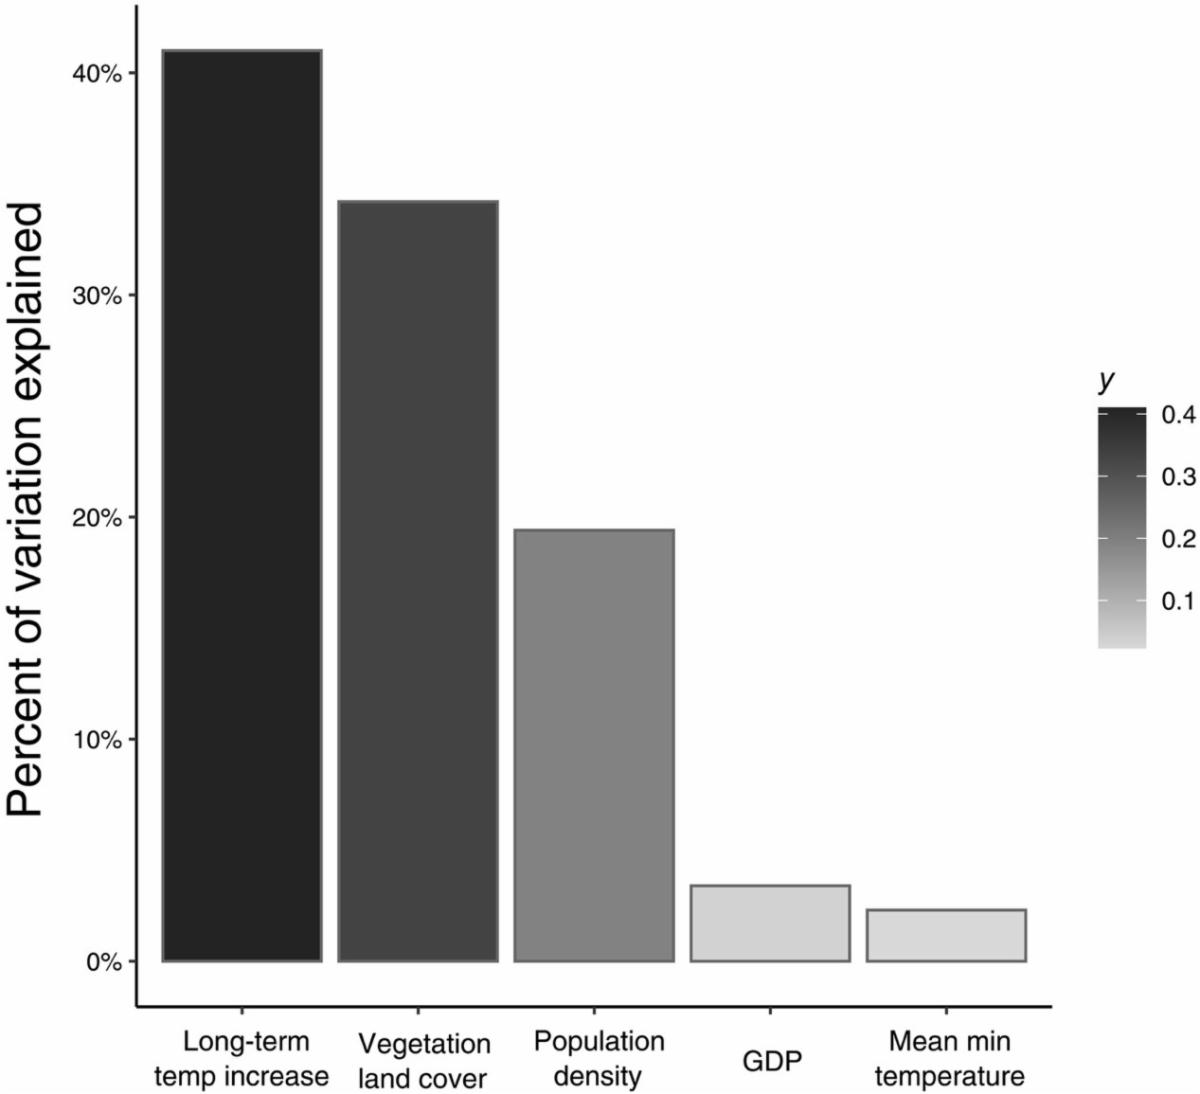
Researchers have found that warming temperatures in 16 major cities was a factor in an above average increase in the number of rats. The study’s relative weights analysis showed that temperature increase had the greatest causality among factors for rat population increases — 40.7 of the variation in trend strength was linked to the mean increase in temperature a city experienced relative to averages.
| |
|
As of 2020
Source: Science.org
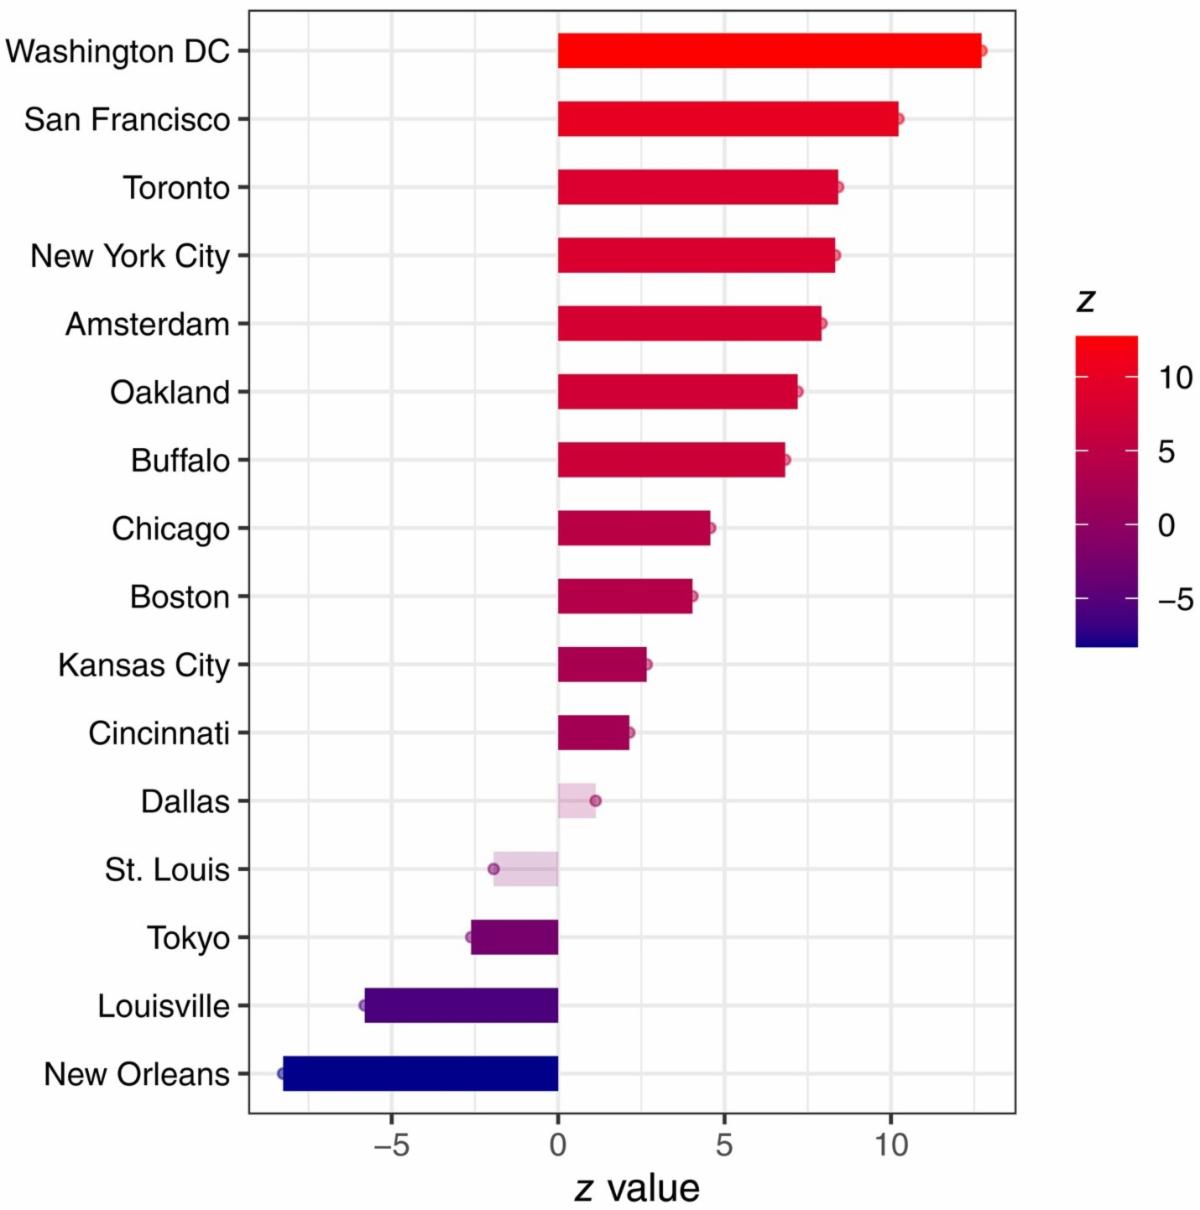
The study found that Washington, D.C., San Francisco, Toronto, New York City, and Amsterdam saw the most growth in rat population. The magnitude of trends among cities varied widely. For example, the trend in rat numbers in Washington, D.C. was three times greater than in Boston, and 1.5 times greater than New York City.
Graphic:
| |
|
As of 2020
Source: Science.org
Notable excerpts from the study’s abstract:
- Rats damage infrastructure, consume agricultural yields, and contaminate food supplies, causing an estimated $27 billion in damage and loss each year in the U.S.
- Rats harbor and transmit more than 50 zoonotic pathogens and parasites to people, affecting public health and related costs.
- In recent decades, [global] efforts at suppressing or eradicating rats… have cost an estimated $500 million each year.
Those devoted Fact Pack readers who are offended on Phil’s behalf and are about to compose a strongly worded email to point out that rats are of the rodent family Muridae and groundhogs are of House Sciuridae — and that it is an insult to Phil to pair the two families in any way, shape, or form — please accept our Game of Thrones reference in lieu of an apology for the association with one of the most disliked creatures on the planet.
Final fact: About 40 percent of the mammals on the planet are rodents — of one kind or another.
(Methodology notes: The study used between 7 and 17 years of public rat sighting and inspection data to quantify changes in rat numbers. Researchers acknowledged the difficulty of accurately measuring rat populations. Details on that can be found here.)
Pause and Effect
The Dow Jones Industrial Average recovered significantly Monday after initially falling owing to concerns about the effect of new tariffs on Mexico and Canada announced by President Trump over the weekend. Fact Pack co-publisher and economist John Restrepo:
The quick reverse to a positive position indicated that investors were pleased with news of a one-month pause of 25 percent levy on imported goods from Mexico. By and large, investors saw the short-term relief from tariffs as a boost for economic stability and stronger trade ties with the nation’s neighbor to the south — supporting the view that the U.S. should avoid future trade battles that could impede economic growth.
Less than an hour after markets closed Monday, a similar pause was announced for the implementation of tariffs on goods imported from Canada.
Snapshot of a CNBC graphic showing the fall and quick rise of the Down Jones Industrial Average on Monday:
| |
|
As of 3:59 pm EST on 2/3/25
Source: CNBC
This Daily Shot graphic shows U.S. importers were preparing for tariffs:
| |
|
As of December 2024
As were consumers:
| |
|
As of December 2024
Income, Outlays, Saving
The PCE price index for December increased 2.6 percent year-over-year, and 0.2 percent over November, in line with expectations. Excluding food and energy, the index increased 2.8 percent from one year ago.
The $133.6 billion increase in (current-dollar) PCE reflected an increase of $78.2 billion in spending for services and $55.4 billion in spending for goods.
| |
|
As of December 2024
Personal income increased $92.0 billion (0.4 percent at a monthly rate) in December, according to estimates released by the U.S. Bureau of Economic Analysis. Disposable personal income (DPI)—defined as personal income less personal taxes—increased $79.7 billion (0.4 percent).
Personal outlays—the sum of PCE, personal interest payments, and personal current transfer payments—increased $129.5 billion in December.
Personal saving was $843.2 billion in December and the personal saving rate—defined a personal saving as a percentage of disposable personal income—was 3.8 percent.
| |
|
As of December 2024
Consumer spending:
| |
|
As of December 2024
How Americans Spend
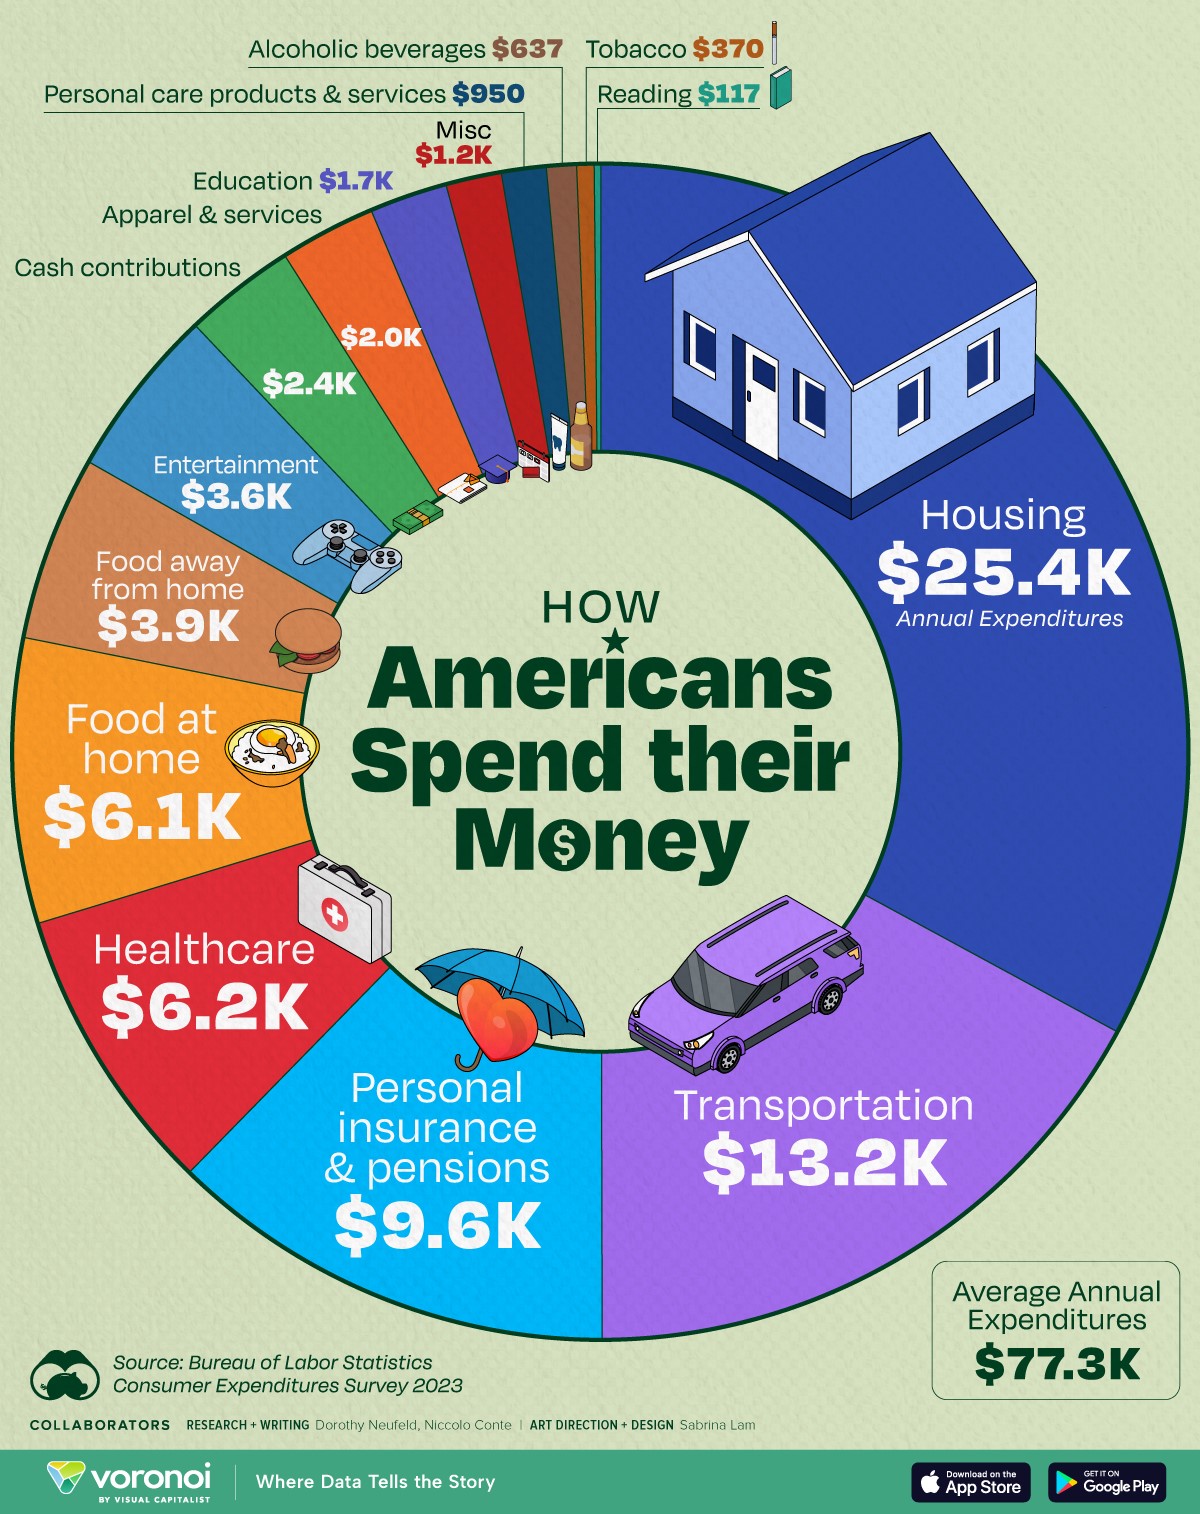
Consumer spending represented 68 percent of U.S. GDP in 2023, with the most spent on housing, transportation, and healthcare costs. Nearly half of American consumer spending goes toward housing and transportation, with housing costs increasing 12.4 percent since 2021, slightly outpacing inflation, according to the Bureau of Labor Statistics.
Notably, Americans in 2023 spent approximately $10,000 annually on groceries and dining out, an increase of 20.5 percent since 2021.
This Visual Capitalist graphic shows the average annual expenditures of Americans, based on data from the Consumer Expenditures Survey 2023 from the Bureau of Labor Statistics:
| |
|
Data as of 2023
Americans are, as always, using debt and credit cards to fund some of their purchases. In the second half of 2024, household debt rose to a record $17.9 trillion — and credit card debt surpassed a historic $1 trillion, climbing by 8.3. percent over the period, according to Census Bureau data.
Healthcare spending rose 5.3 percent over the year, reaching $6,159 on average. Healthcare spending in 2023 reached $4.8 trillion, with Americans spending more on healthcare than any other G20 nation.
Uninsured Homes
Semafor is out with a graph showing the share of homeowners without home insurance at the end of 2021, according to the latest available data from the Census Bureau:
| |
|
The percentages have increased since, because insurance companies continue to drop homeowners from policies in high-risk areas.
A Consumer Federation of America report (2021) estimated that one in 13 (7.4 percent) or 6.1 million American homeowners valued at $1.6 trillion were without coverage.
Bonds
Last month’s bond performance was dominated by APAC and European countries:
| |
|
As of December 2024
Source J.D. Power
J.D. Power analysts noted that in years past, the lowest-scoring attribute in the study was reasonableness of food and beverage pricing—but that it did not much affect overall satisfaction.
However, on average in 2024, passengers spent $3.53 per person less than they did in 2023 on food, beverage and other items in the terminal, and the decline ($6.31) was greatest at large airports. The logical conclusion? F&B pricing matters more to travelers than it once did.
J.D. Power surveys travelers for their airport experience for the following categories:
- Accessibility (getting to the airport/leaving the airport)
- Check-in/baggage check (as applicable)
- Food, beverage and retail
- Terminal facilities (concourses, lounges, signage, restrooms, gate areas)
- Baggage claim (as applicable)
A separate J.D. Power study focused on traveler experiences noted that overall guest satisfaction declined significantly in limited-service hotel segments, but satisfaction in Upscale and full-service hotel segments was on par or higher than in 2023:
| |
|
As of December 2024
Source J.D. Power
(According to Costar/STR, industry-wide average daily room rates (ADR) for branded hotels increased 2.2 percent during the 2024 study period.)
The J.D. power analysis also found that overall guest satisfaction with hotels run by third-party management companies was up 8 points from a year ago. The year-over-year improvement was driven primarily by improvements in satisfaction with cleanliness of guest rooms; maintenance and upkeep of the hotel; and hotel staff responsiveness to guest questions and requests.
Data Center Boom
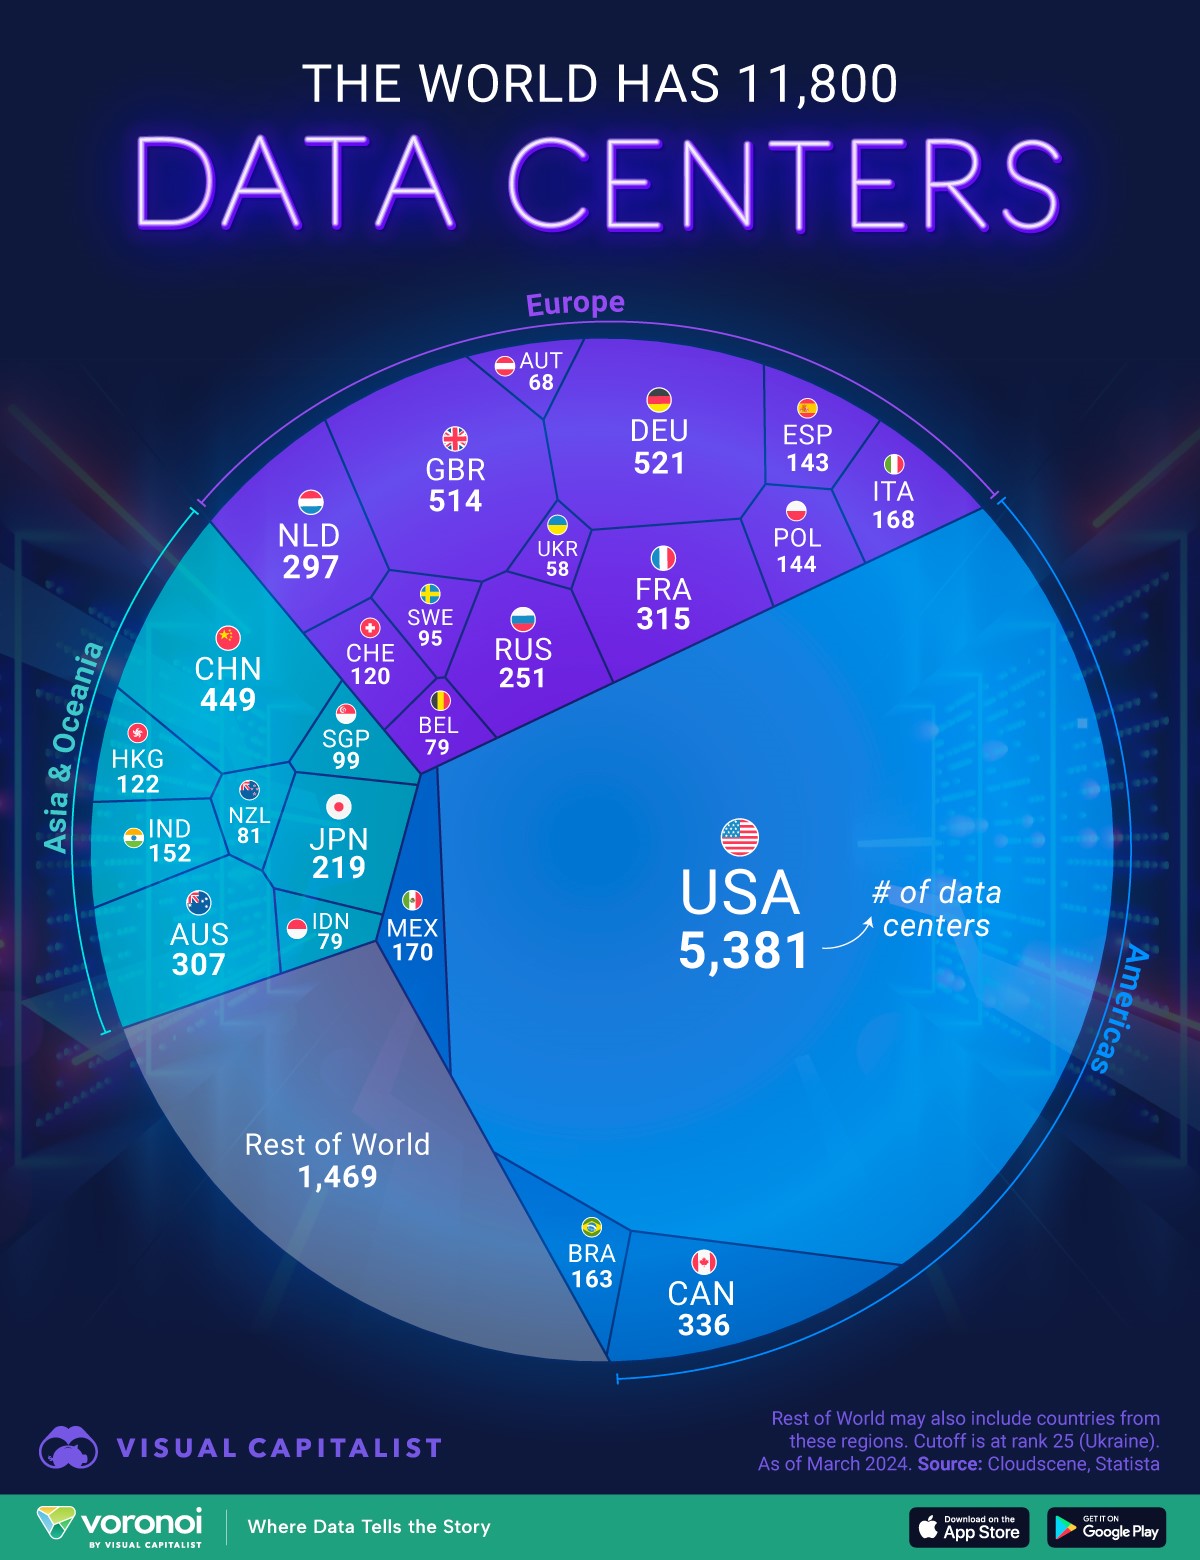
Which country has the most data centers? It’s not even close:
| |
|
As of March 2024
Full Circle
We end today’s edition of Fact Pack with a fun note about the 1993 film Groundhog Day, which centers on a cynical news reporter played by actor Bill Murray. On yet another field assignment to cover the nation’s most beloved “varmint,” he finds himself in a time loop that forces him to wake up in Punxsutawney on the morning of February 2 over and over (and over).
It eventually results in an attitude change, the acquisition of an impressive amount of subject matter expertise in several areas including French poetry, and the acquisition of assorted skills including mastery of the piano.
The movie does not specify how many times Murray’s character loops, but entertainment writers have divined (calculated and surmised) that the total equates to many, many years — numbering as few as eight and as high as 40 or so.
| |
|
On the Horizon
Mike PeQueen: While Friday’s employment report would normally dominate the week’s economic news, the reaction to any tariff announcements could run right over that story.
| |
Data & Dialogue About the Economy
The Fact Pack is a monthly business e-report co-authored by Mike PeQueen of Hightower Las Vegas and John Restrepo of RCG Economics, which combines important metrics relevant to business decision makers and financial commentary on the current issues facing the economy.
See what's happening on our social media sites!
| |
Mike PeQueen
Hightower Las Vegas
| |  |
John Restrepo
RCG Economics
| | | | | |