X Share This Email
LinkedIn Share This Email
 

It’s not news at this point that bombing in the Middle East is putting the entire planet on edge and causing the biggest disruption to oil and natural gas markets since Russia’s invasion of Ukraine in 2022.


Benchmark fuel prices in the EU were up as much as 45 percent as of Monday afternoon. Also as of Monday:


  • Qatar had shut down the world’s largest liquefied natural gas export facility.


  • Saudi Arabia had suspended operations at its biggest oil refinery.


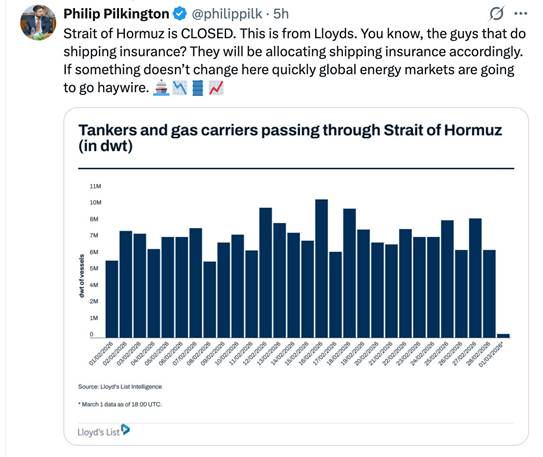
  • Tanker traffic through the crucial Strait of Hormuz has all but halted. About 20 percent of global oil supply moves through the straight when it is fully operational. (Bonus content: This visual timeline from a user on Twitter/X shows what happens across the Middle East and EU when cargo traffic in the strait is curtailed.)


Graph and analysis for context re: the Strait of Hormuz based on conditions on Sunday:

As of 3/1/26 at 6 pm UTC


Supply and demand reminder from 2022 as we wait to see outcome and output numbers related to the above:

image image

What the EU did next:

image-1 image

Domestic Prices at the Pump


Spring weather is weeks away in much of the U.S. but the seasonal rise in gas prices has been underway for weeks, according to AAA. The national average for a gallon of regular gasoline went up by more than 5 cents this past week to $2.98.


(Note: Refineries are beginning the process of producing summer-blend gasoline, which contains pricier additives to help reduce evaporation during warmer months.)


Monday’s National Average: $2.983


Last Monday: $2.929


One Month Ago: $2.881


One Year Ago: $3.134


All that said, the average price this week is lower in the U.S. than in past years at the same time:

image image

As of 3/2/2026


Nevada had the 5th most expensive average price ($3.71) among states as of Monday, March 2:

image-3 image

Major U.S. Economic Indicators


Three things:


  • The Conference Board’s Consumer Confidence Index for February rose by 2.2 points to 91.2, indicating a slight improvement in consumer sentiment.


  • Jobs data released on Feb. 26 showed initial unemployment claims for the week ending February 21 ticked up to 212,000, with continuing claims holding at 1.83 million. The data points to a continued “low-hiring, low-firing” labor market.


  • The Producer Price Index (PPI) for January came in hotter than expected, showing a 0.5 percent monthly increase—its biggest gain since September. Core PPI rose by 0.8 percent.


LVCVA Update


The Las Vegas Convention and Visitors Authority has posted January data:

image-5 image

Fact Pack co-publisher Mike PeQueen:


Though total visitor volume was down in January, Las Vegas saw a 6.9 percent Year-over-Year increase in convention attendance — not only because of CES (148,000 attendees), World of Concrete (58,000), and the SHOT show (53,000), but also because of a number of smaller expos that come to the Strip every few years including the International Roofing Expo (15,000 attendees).


Fact Pack co-publisher John Restrepo:


January data revealed an 11 percent drop in Nevada gaming revenue — no surprise, in light of the 8 percent decline in Las Vegas airport passenger traffic. As Mike pointed out, strong attendance at trade shows mitigated the overall drop in visitors, which fell by only 2.2 percent, and boosted the Strip’s Revenue Per Available Room by 3.5 percent over January of last year.


Census Survey Says…


The U.S. Census Bureau has updated its Explore Your State profiles with new graphics and the data from assorted surveys, including demographic and economic information for Nevada.


Nevada population pyramid (click the link for a larger, scroll over view):

image-2 image

Data as of 2023 American Community Survey (5-Year Estimates)


Languages spoken at home and foreign-born population ratios:

image-6 image

Data as of 2023 American Community Survey (5-Year Estimates)

image-7 image

Data as of 2023 American Community Survey (5-Year Estimates)


Much more data here.


Same Sex Households


Ten years after the U.S. Supreme Court’s ruling in Obergefell v. Hodges legalized same-sex marriage nationwide, a Pew Research Center survey reveals a host of interesting data.

image-8 image

As of 2023


Same-sex married couples represent a small share of all married couples – 1.3 percent as of 2023 — and same-sex cohabiting couples account for 5.6 percent of all cohabiting couples.


The demographic characteristics of same-sex married couples vary somewhat from those of opposite-sex married couples, and unsurprisingly those patterns are largely similar when compared to same-sex and opposite-sex cohabiting couples. (See: Detailed Pew Research tables on cohabiting couples)


Education:

image-3 image

As of 2023


Takeaway: Same-sex married couples have higher levels of education than different-sex married couples — especially where both spouses are men (40 percent).


Employment:

image-1 image

As of 2023


Takeaway: Work arrangements vary depending on whether couples have minor children in their home. But even among married couples without children, those with two men are the most likely to have both partners working (75 percent).


Income:

image-2 image

As of 2023


Takeaway: Same-sex married couples with two men have the highest household incomes – $172,689 at the median.


Cohabitation comparisons:

image-9 image

As of 2023


(Note: These findings come from a Pew Research Center survey and analysis of government data. The survey data is based on the responses of 1,154 adults who are married to or living with a same-sex spouse or partner as part of a larger, nationally representative survey of LGBTQ U.S. adults conducted Jan. 8-19, 2025. The analysis of government data about same-sex and different-sex couples is based on data from the U.S. Census Bureau and American Community Survey.)


Debt Burdens


The U.S. ranks 7th in the world for total debt ratio (264 percent of GDP, led by government debt of 123 percent):

image-4 image

Data source: Institute of International Finance’s Global Debt Monitor


Graphic source: Visual Capitalist


As of Q4 2025


Table:

image-4 image

Data source: Institute of International Finance’s Global Debt Monitor


Graphic source: Visual Capitalist


As of Q4 2025

DST


If you are among those who fervently wish for an end to Daylight Savings Time, this special section of Fact Pack has been lovingly assembled for your edification. (Officially speaking, we are neutral on the issue, in keeping with our policy of providing facts and letting our astute readers debate their value.)


We bring this up because Americans who lost an hour of daylight four months and one week ago (November 1, 2025) must “spring forward” an hour at bedtime this Saturday, March 8, so they can wake up to an accurate clock on Sunday morning.


Facts:

  • First proposed in 1895 by George Hudson, an entomologist from New Zealand seeking extra daylight for his studies after work, the idea of DST was slow to catch on both in NZ and globally — until 1907, when Englishman William Willett published The Waste of Daylight, a missive inspired by an early-morning epiphany that “the sun shines upon the land for several hours each day while we are asleep” and yet there “remains only a brief spell of declining daylight in which to spend the short period of leisure at our disposal.”


  • Willett lobbied Parliament for legislation until his death in 1915—not living long enough to see the measure passed in England after it became law in Germany. (According to a TIME article, Frankfurt’s daily newspaper Zeitung published this amusing dig: “It is characteristic of England that she could not rouse herself to a decision.”)


  • In the U.S., the concept of DST was first introduced during World War I, in 1918, as a measure to conserve fuel needed for war efforts by reducing the amount of energy used for lighting and heating. It was unpopular, and Congress repealed it in 1919. 


  • Year-round DST was enacted in World War II (1942-1945) for the same purported reason: more coal could be diverted to producing energy for wartime production needs. The U.S. Chamber of Commerce was a major backer for the policy not only in support of war-related manufacturing but also because — as author Michael Downing wrote, Americans getting off work while it was still light out meant they would be more likely, among other things, to:


  • go shopping in the evening (benefitting retail stores)


  • go to the movies (lining the pockets of movie moguls)


  • get on a train (funding the accounts of railroad execs).


  • The U.S. government adopted DST again during the 1973 OPEC Oil Embargo. It did not go well. The minuscule amount of energy conserved (roughly 1 percent) did not comfort the millions of parents upset that their children were standing at bus stops at 8 a.m. in pitch blackness, leading to a spike in traffic accidents involving kids.


If you ask to whom DST is most beneficial today, the answer is several rather specific corporate-owned groups, including:


  • The Candy Lobby: When DST was adjusted in the Energy Policy Act of 2005 to extend the period by four weeks, it pushed the end date past Halloween. Decades of persistent lobbying to get DST extended past October 31st to create an extra hour of evening daylight on Halloween paid off: Children could and would trick-or-treat later, resulting in millions of dollars in candy sales to meet demand.


  • The Golf Lobby: Golf industry data shows that the extra month of evening daylight is worth hundreds of millions of dollars in greens fees and equipment sales.


For most citizens, the utility of DST ended with the invention of efficient LED lightbulbs and more efficient central air conditioning.


Here in Nevada, it is undeniable that messing with time stamps thwarts basic comfort for those who do not like it hot — and costs money. The desert sun leads to increased warmth earlier in the day and sweltering heat for an hour longer all summer, and non-solar households and businesses with one or more a/c units see it reflected in their monthly electric bill.

On the Horizon


MarketWatch calendar:

image-10 image

Data & Dialogue About the Economy


The Fact Pack is a monthly business e-report co-authored by Mike PeQueen of Hightower Las Vegas and John Restrepo of RCG Economics, which combines important metrics relevant to business decision makers and financial commentary on the current issues facing the economy.


See what's happening on our social media sites!

Facebook  X  LinkedIn
Mike PeQueen
Hightower Las Vegas
John Restrepo
RCG Economics