Data center hubs and top growth areas including Northern Virginia, Atlanta, and Phoenix have been in U.S. headlines — along with Dallas/Fort Worth, Silicon Valley, and Chicago — and an analysis by Upwind shows the fastest-growing regions ranked by projected future power capacity is topped by Las Vegas/Reno.

Picture6 image

Data as of July 2024


The energy capacity metric, along with other factors, landed Las Vegas / Reno at the top of the Upstart ranking for projected data center growth:

Picture5-1 image

Data as of July 2024


The analysis projected that Las Vegas and Reno’s data centers will require 3,812 MW of energy to operate – enough to power 3.1 million homes. 


Investments such as Google’s $400 million data center in Nevada are driving growth, with the caveat that a not-small factor behind data center growth in Nevada is NV Energy’s electricity rate, which is 35 percent lower than the national average.


The average data center construction project adds $243.5 million to the local economy, creating 1,688 construction jobs, and sustaining 157 permanent jobs.


A joint venture among OpenAI, Softbank, and Oracle will invest $100 billion initially, potentially scaling up to $500 billion, for AI infrastructure, including the construction of 10 data centers, according to a Construction Dive report in early 2025. 


Coal


China greenlighted nearly 100 gigawatts (GW) of new coal-fired plants in 2024, and India approved 15 GW, pushing global approvals to the highest level since 2015.

Picture4-2 image

Source: IEA (2025)

Small Nuclear


On the flip side of the coal coin, Interest in nuclear energy is at its highest level since the oil crises in the 1970s. Support for expanding the use of nuclear power is now a thing in more than 40 countries.


Demand for reliable, dispatchable, clean power from the private sector is a major driver of interest in nuclear power’s emerging technologies, and there are plans afoot globally for as much as 25 GW of small modular reactor (SMR) capacity — in large part to meet growing electricity demand for data centers.


Total SMR capacity is estimated at 40 GW by 2050, but studies show the potential is greater if developing nations pursue policy support for nuclear energy and streamline regulations for SMRs that align with regional industry demand.


The IEA has noted that delivery on SMR capacity could be as much as three times higher by mid-century, reaching 120 GW, assuming an increase in investment in SMRs from less than $5 billion annually today to $25 billion by the end of the decade — with cumulative investment of $670 billion by 2050.

image image

Data source: IEA as of 2025


France tops the nuclear energy production list, but numerous countries are catching up, according to IEA data.

Picture3-1 image

Source: IEA as of January 2024


Ratios of nuclear energy share as of 2023:


  • France — 65 percent


  • Ukraine — 50 percent


  • Bulgaria — 40 percent


  • Switzerland — 35 percent


  • South Korea — 30 percent


  • UAE — 20 percent


  • U.S. and Russia — 18 percent


  • Canada — 14 percent


  • China — 5 percent


  • India — 3 percent


  • Iran — 2 percent


Notably, according to the IEA, momentum toward nuclear power is reliant on Chinese and Russian technologies. Of the 52 reactors that have started construction worldwide since 2017, 25 of them are of Chinese design and 23 of them of Russian design.


Snapshot of the global energy state of play:

Picture2-2 image

Data source: IEA as of 2024


U.S. Industry Snapshots


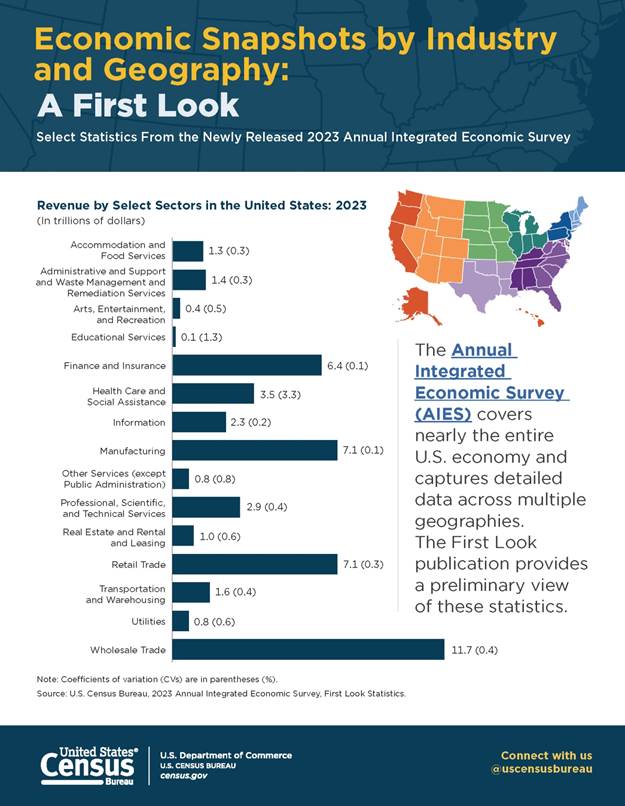
The Census Bureau has launched a new web page entitled “Economic Snapshots by Industry and Geography: A First Look” featuring stats, facts, and graphs based on data from its Annual Integrated Economic Survey (2023).

Data as of 2023


Here’s the Bureau’s sum-up of Nevada’s region of the country in one big, beautiful graphic:

image-20 image

Data as of 2023


Close up view of the number of people working in the biggest job sectors (red is the Pacific region and orange is the Mountain region, which includes Nevada):

Picture1-2 image

Data as of 2023

Tariff Curves


Reuters reported Friday that soon-to-be finalized semiconductor tariffs will “be lower at the start to allow [U.S.] companies to build up domestic manufacturing in the U.S., rising sharply later” — and that the same will be true for tariffs on pharmaceuticals.”


President Trump had said the prior week that he would impose a tariff of 100 percent on imports of semiconductors, but overseas companies that committed to building up manufacturing in the U.S. would be exempt.


Apple announced last week that it will be investing an additional $100 billion in the U.S.


AI Sourcing


The team at Semrush did a deep dive on where AI grabs its facts:

image-1 image

Data source and notes on methodology: Semrush.com


Big Brother


A new analysis by NeoMam Studios found that our nation’s capital is the Big Dog of Big Brother Surveillance on the planet.


  • Washington, D.C. has 44 government-accessible surveillance cameras per 1,000 people — the most of any major global city.


  • The metro with the most state-accessible CCTV cameras per square kilometer is Dubai (United Arab Emirates) — 800 cameras per km2.


  • Stockholm (Sweden) is the most surveilled European city with 22.4 CCTV cameras per 1,000 residents, or 117 cameras per km2.


  • Moscow made the top five with 19.2 cameras per 1,000 people,
image-19 image

Data source: neomam.com As of March 2025

image-2 image

Methodology Note: For this report, analysts identified the cities worldwide with the largest number of government-linked CCTV cameras per 1,000 people and conducted manual research to find local reports of CCTV camera counts in the capitals and major cities of every country as of 2025.

On the Horizon


Marketwatch calendar: 

Picture7 image

Data & Dialogue About the Economy


The Fact Pack is a monthly business e-report co-authored by Mike PeQueen of Hightower Las Vegas and John Restrepo of RCG Economics, which combines important metrics relevant to business decision makers and financial commentary on the current issues facing the economy.


See what's happening on our social media sites!

Facebook  X  LinkedIn
Mike PeQueen
Hightower Las Vegas
John Restrepo
RCG Economics