X Share This Email
LinkedIn Share This Email
 

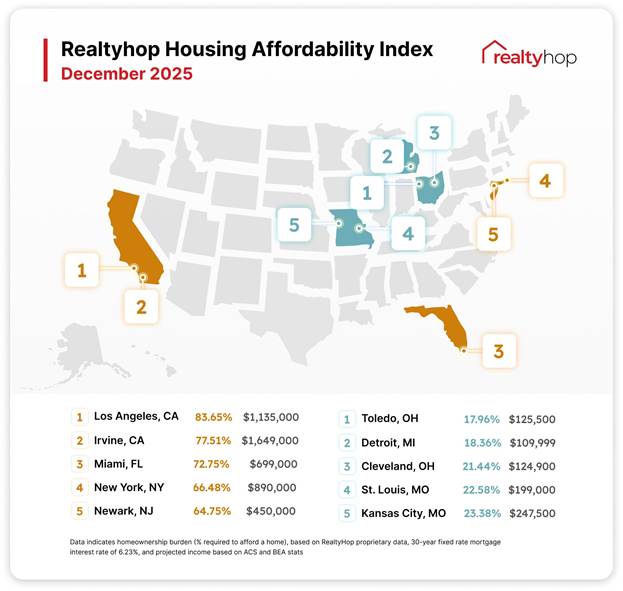
December’s year-ending RealtyHop Housing Affordability Index — which measures and compares home prices, mortgage payments, and wage data across the country’s 100 largest cities — concludes that in 2025, residents in 67 metros had to spend more than 30 percent of their annual household income to own a median-priced home in the area.


Residents in 12 cities — 8 in California and one each in FL, NY, NJ, and MA — spent over 50 percent of their income on homeownership costs:

image-39 image

As of December 2025


Top 5 on the high and low end:

As of December 2025


Reno was ranked 20th (up 4 spots from 2024) and Las Vegas ranked 28th (down 2 spots) for least affordable metros, on average:

image-42 image

As of December 2025


Global Energy Demand by Fuel Type

image-46 image

Source: Visual Capitalist


Projections through December 2025 based on OPEC data


Takeaway: Fossil fuels powered 80 percent of global energy demand in 2024, with the share forecast to shrink to around 67 percent by 2050, per OPEC:

image-41 image

Source: Visual Capitalist


Projections through December 2025 based on OPEC data


Chaser graphic showing where energy investments were made in 2024:

image-2 image

Source: Visual Capitalist As of 2024


Got a $20 on You?

image-3 image

Source: Visual Capitalist as of July 2025


Mountain West close-ups:

image-40 image
image-43 image
image-44 image

Source: Visual Capitalist as of July 2025


Zipcar Zips Out of UK


We were interested to note that Zipcar — a U.S.-based car-share business model that enables customers to rent vehicles by the hour or day — will be exiting the UK market in January, after nearly 20 years. The withdrawal is notable, as Zipcar’s fleet of 2,500 cars, vans, and trucks make up 90 percent of London’s rental inventory.


The affected 600,000 members will presumably be assessing alternatives — or making a move to private car ownership.


What led to the end of a two-decade London trend? Rising insurance and operating costs and “flatlining usage,” according to CityLab. Zipcar’s 1,000-unit electric vehicle fleet had already become more expensive to run — Zipcar reported a loss of more than £11 million British pounds in 2024 on revenue around to £50 million — when the city of London decided that in 2026, EVs would not be exempt from its congestion control program featuring a £13.50 daily surcharge.


Fact Pack readers frustrated by Nevada’s fees and bureaucratic layers can find comfort in this astounded fact: Zipcar and companies like it must deal with the policies of 33 different London councils and government bodies.


U.S. Car Sharing Market


The U.S. fleet-based car-sharing market size was valued at close to $1.6 billion as of November, and grew at a CAGR (compound annual growth rate) of 10.8 percent between 2020 and 2025, according to IBIS data.


As for traffic congestion reduction fee programs in the U.S., at least one is working as planned, with a significant drop in pollution, traffic decline of 11 percent in the tolled zone, and added revenue: NYC’s Metropolitan Transportation Authority is expected to beat its 2025 target of $500 million of revenue (after expenses).


Surprisingly, the business impact in the district from the $9 daily fee has so far been positive: The zone has seen a 3.4 percent increase in visitors and a 6.3 percent boost in sales-tax revenue since the program was enacted in 2024.


Car Count


A Hedges & Company analysis in January 2025 estimated there were 298.7 million registered vehicles in the US, including classic cars, pre-1982 vehicles, and all light, medium and heavy duty vehicles.

image-45 image

As of January 2025


There were about 132.8 million U.S. households at the start of 2025, of which 121.6 million owned a car — a whopping 92 percent.


Notably, many American consumers hold on to their cars for more than a decade: The average age of light vehicles in the U.S. was 12.8 years in January 2025, and by 2029 the average age is projected at 13.9 years.


New coming-of-age consumers have kept the market running:

image-47 image

As of January 2025

On the Horizon


In lieu of the MarketWatch calendar, we end this final 2025 edition of Fact Pack with Visual Capitalist’s 2026 Prediction Consensus “Bingo Card,” a synthesis of 2,000 individual predictions from select market analysts, thought leaders, and industry experts from Morgan Stanley, Goldman Sachs, the IMF, The Economist, Deloitte, and dozens more.


Here are the 25 “high-conviction themes” (the number of dabs reflects the volume of supporting predictions, and blue indicates an economic metric):

Fact Pack co-publisher John Restrepo:


Economic growth in the U.S. was close to 2 percent this quarter over Q4 of 2024, and the Fed is presently expecting growth of 2.1 percent to 2.5 percent from now to Q4 2026. Through November, the economy added 610,000 jobs in 2025, and headline unemployment in November was 4.6 percent, up from 4.2 percent a year earlier.


The big forward-looking questions for me center on wage growth, which was up 3.5 percent Year-over-Year in November, the full impact of tariffs on cost of living of Americans, the AI impact on jobs and the US economy, and residential investment and new and used home inventory numbers, which have been slowly shifting over the past few months.


Fact Pack co-publisher Mike PeQueen:


Core PCE was up 2.8 percent Year-over-Year through September, and the Fed is forecasting the YoY change in core PCE will be in the 2.4 percent to 2.6 percent range when Q4 2025 data is finalized. Two rate cuts in 2026 are reasonable to expect under present conditions — but as we have seen, a lot can change in a year, so all my usual disclaimers apply.


If the cautiously optimistic Visual Capitalist Bingo card holds up, 2026 will be a year of focusing on fundamentals, including risk management and efficiency-seeking measures and consolidations. All eyes are eager to see how AI factors into productivity and shifts in the workforce for better or worse. The caveats (and big carry overs from 2025) are uncertainty about geopolitical pressures and cyberattacks, which can cause considerable chaos.


For now, everyone here at Fact Pack HQ wishes each of you a fun, non-chaotic holiday full of good cheer — and an in-advance Happy New Year.

image-48 image

Data & Dialogue About the Economy


The Fact Pack is a monthly business e-report co-authored by Mike PeQueen of Hightower Las Vegas and John Restrepo of RCG Economics, which combines important metrics relevant to business decision makers and financial commentary on the current issues facing the economy.


See what's happening on our social media sites!

Facebook  X  LinkedIn
Mike PeQueen
Hightower Las Vegas
John Restrepo
RCG Economics