Greetings!


Supply in July is up 19.8% year over year in Metro Vancouver which is 40.2% above the 10 year seasonal average while sales were down 13.9% below the 10 year seasonal average. The increase in supply and the decrease in demand are not as drastic as we saw in May & June so hopefully this is a turnaround in the trend. Spring 2025 has been unusually weak in the real estate market and if this momentum shift continues, we may be looking at a more normal market again soon. These Metro Vancouver stats get a lot of press and are distinct from the west side market stats but we are facing similar trends here on the west side.


Westside detached home sales, when compared to the 10-year averages, are down by 15% for detached homes, down 15% for apartments and up by 17% for townhomes.


Compared to the 10-year average, supply is up 13% for Westside detached homes, while apartment supply is up 41%, and townhomes are up 65%.


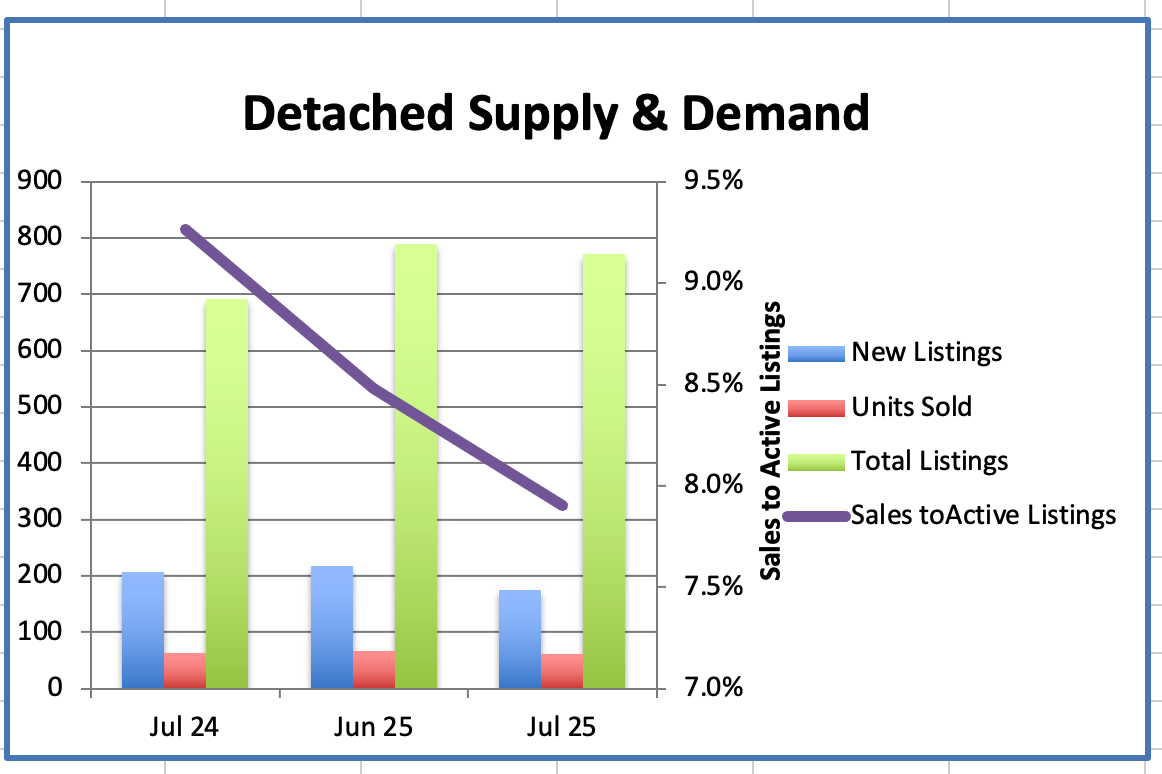
We had 61 Westside Detached home sales in July, compared to 67 sales last month.

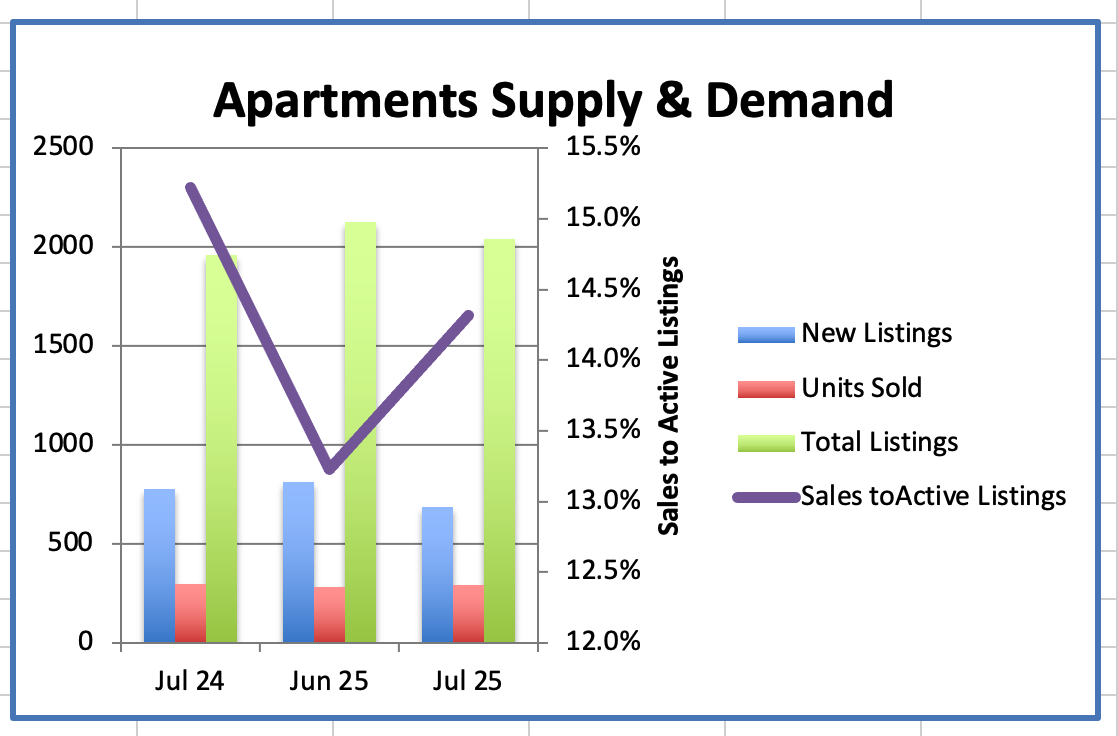
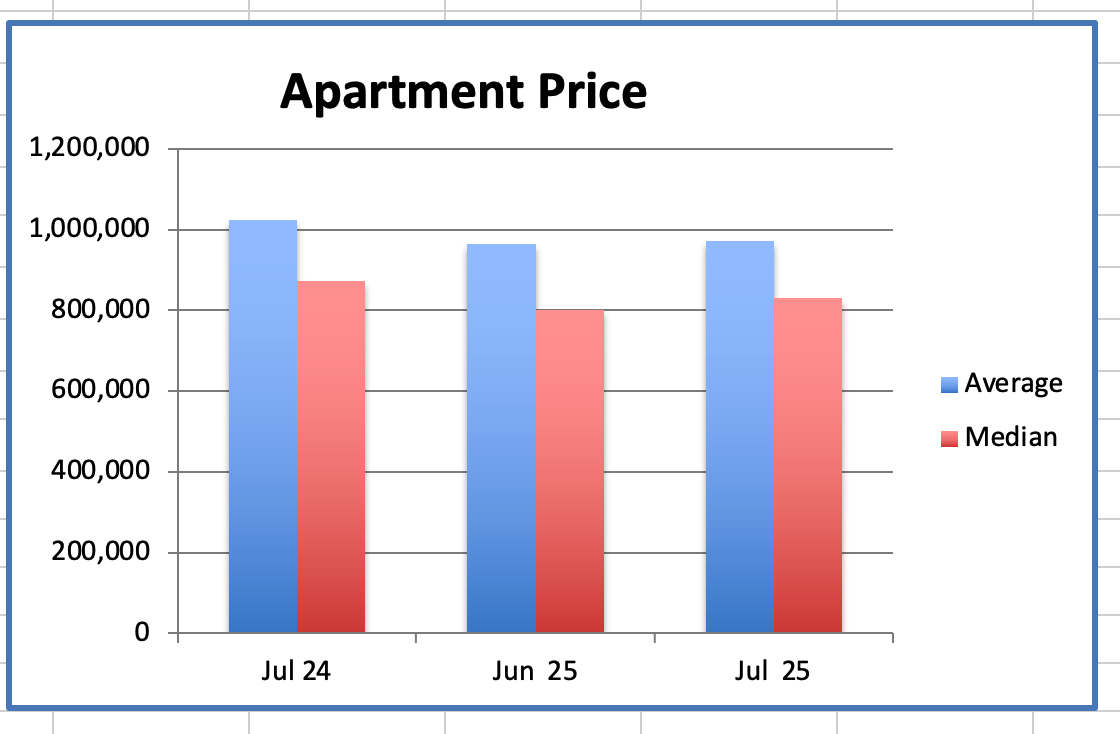
We had 292 Westside Apartment sales in July, compared to 281 sales last month.

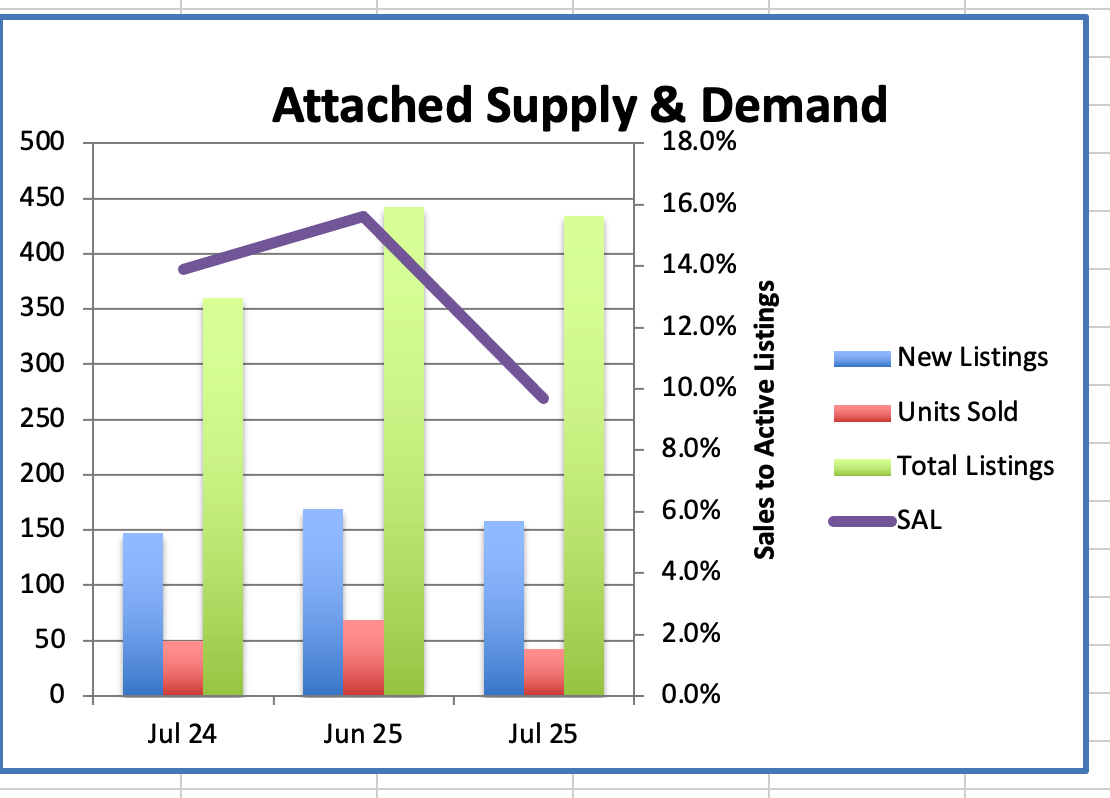
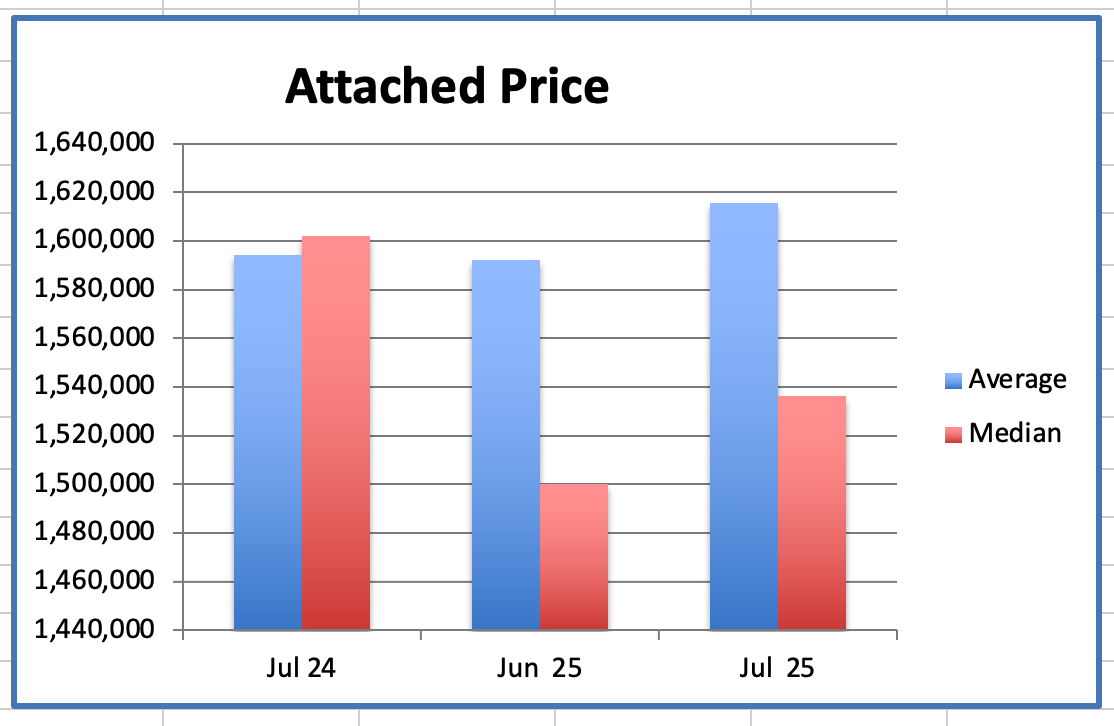
We had 42 Westside Attached home sales in July, compared to 69 sales last month.


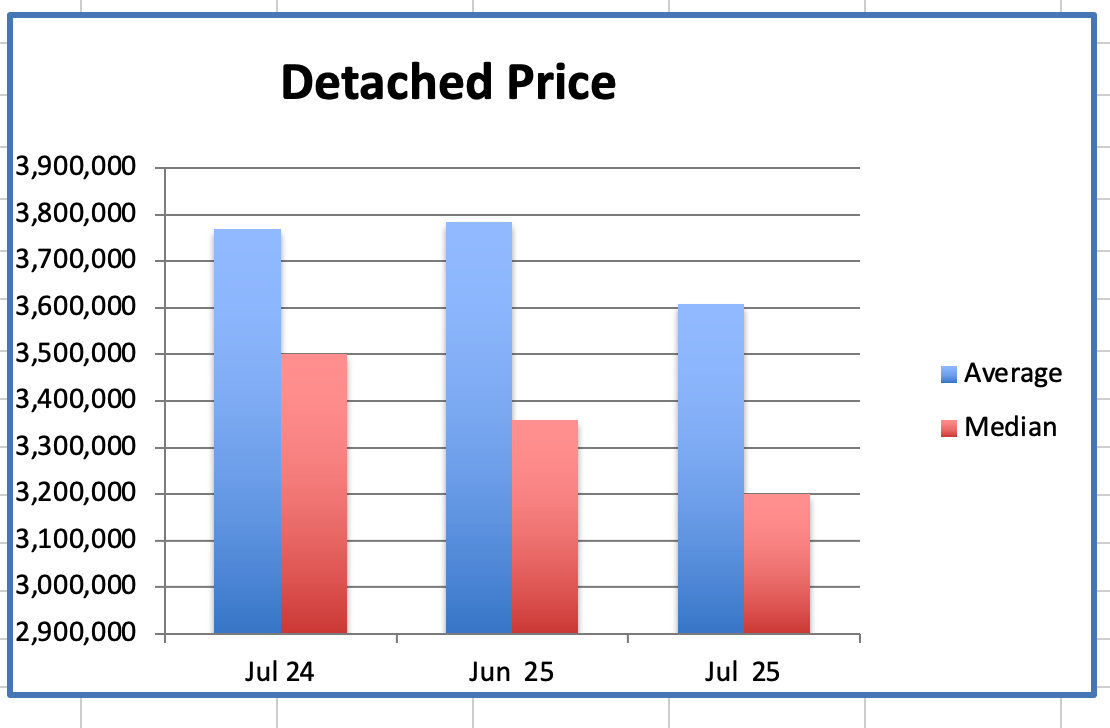
In July the westside Detached Home average price was down 24% from the peak in August 2023.

The Attached home average price was down 14% from the peak in Dec 2024.

The Apartment average price was down 19% from the peak in January 2018.


The Sales to Active Listings ratio (SAL) is a key indicator of market balance and it helps determine whether the market favours Buyers or Sellers.


Generally, downward pressure on home prices occurs when the ratio dips below 12% for a period of time. Upward pressure on home prices occurs when the ratio surpasses 20% over several months. The range between 12% and 20% is considered a balanced market.


Market conditions are dynamic and can change rapidly due to various economic factors & the ratio can vary significantly depending on the property type.


Currently the SAL for Westside detached is 7.9%, attached is 9.7% and apartments is 14.3%.


So demand is up over the last couple of months for detached homes, it is down for attached town homes and it has been stable for apartments. This increased activity in the detached market is due to the low SAL putting downward pressure on house prices making them better value. Decreased demand for Attached homes has caused their SAL to drop and the price will follow if demand does not pick up. Apartment prices have remained stable (within 7.5%) since Aug. 2024 because the SAR has remained close to a balanced market range between 12 & 20% since then with a couple of short drops which have not been sustained long enough to shift the price trend.


These are emerging signs that sales activity may be turning a corner, and the SAL ratio is improving which should help firm up prices. With the substantial current supply, there are buying opportunities and if the market really turns up, buyers will rush in, so now is a good time to buy while we have good supply and little competition


Sellers need to be the best value in their cohort to attract a buyer so strategic pricing is the key to achieving a sale.


Thinking of Selling? Let’s Talk!


📞 Call me today to discuss your options and make the most of the upcoming selling season.


Hope you had a great BC Day!


Best regards


Stuart ⛳ 🎾

Detailed information on the Westside detached homes market in July. Here's a summary of the key points:


  • Supply:
  • In July, the supply of Westside detached homes was down slightly 2.3% compared to June, with a total of 772 homes available, down from 790.
  • This is an increase of 12% compared to July 2024 when there were 691 homes on the market.
  • Demand:
  • Sales of Westside detached homes in July were down 9% from June, with 61 homes sold.
  • Sales were down 5% compared to July 2024, which had 64 sales.
  • The number of sales remains 15% lower than the ten-year average of 72 sales.
  • Sales to Active Listings Ratio (SAL):
  • The SAL in July decreased by 7% from the previous month, with a current SAL of 7.9% compared to 8.5% in June.
  • This represents a 15% decrease from July 2024.
  • An SAL between 12% to 20% is typically considered a balanced market, where prices tend to remain relatively stable.
  • Pricing:
  • The average detached home price in July decreased 24% and median decreased 24% from August 2023's peak.
  • The average price is $3.608 million, and the median price is $3.2 million.
  • Current prices are down 5% on average and down 5% on median from last month.
  • High and Low Sale Prices:
  • Westside detached home sales in July ranged from a low of $1.92 million to a high of $10.1 million. The most expensive property took 325 days to sell, while the least expensive sold in 16 days.
  • Of the 61 homes sold, only 9 sold at or above their asking price, indicating a buyer's market.


These statistics provide a comprehensive overview of the Westside detached homes market in July shedding light on changes in supply, demand, pricing, and notable sale prices.

Detailed information on the Westside apartment market in July. Here's a summary of the key points:

  • Supply:
  • In July, the supply of Westside apartments was down 4% compared to June, with a total of 2,040 apartments available for sale.
  • This number is up by 4% from July 2024.
  • Demand:
  • Demand for Westside apartments increased by 3.9% in July with 292 sales compared to 281 sales in June.
  • The number of sales in July was down 2% from the same month last year, which had 298 sales.
  • Apartment sales are down 15% from the ten-year average of 345 sales.
  • Sales to Active Listings (SAL):
  • The SAL in May increased by 8% compared to June, to 14%.
  • This is an decrease of 6% from the SAL of 15% in July 2024.
  • An SAL between 12% to 20% is typically considered a balanced market, where prices tend to remain relatively stable.
  • Prices:
  • The average price of Westside apartments in July increased very slightly from June, with the average price at $971K
  • It was down 5% from July 2024.
  • The median price was up 3.8% to $830K and is down 4.9% from July 2024.
  • Average prices are down 19% below the peak of $1,199,000 in January 2018, and median prices are 7% below the peak of June 2024.

These statistics provide a comprehensive picture of the Westside apartment market in July, highlighting changes in supply, demand, pricing, and their respective trends over time.

Detailed information on the Westside townhouse market in July. Here's a summary of the key points:

  • Supply:
  • In July, the supply of Westside townhouses decreased by 2% compared to June, with a total of 434 townhouses available for sale.
  • The supply was up 21% from July 2024, which had 360 townhouses on the market.
  • Demand:
  • The demand for townhouses in July decreased by 39%, with 42 sales.
  • The number of sales in July increased by 16% from the same month last year, which had 50 sales.
  • Attached home sales are 17% below the ten-year average of 51 sales.
  • Sales to Active Listings (SAL):
  • With the decrease in supply and demand, the current SAL for townhouses decreased by 38%, to 9.7%
  • This is 30% lower than the SAL of 13.9% in July 2024.
  • An SAL between 12% to 20% is typically considered a balanced market, where prices tend to remain relatively stable.
  • Prices:
  • The average price of townhouses in July was $1.62 million, up 1.5% from June.
  • It was up 1.3% from July 2024 when the average price was $1.59 million.
  • The median price in July was $1.536 million, a 2.4% increase from June ($1.6 million), and down 4% from July 2024.
  • Average prices for townhouses are down 14% from its peak. Median prices down 17% from its peak. The average peak of $1.885 million in Dec 2024, and the median peak of $1.855 million in Dec 2024.


These statistics provide a comprehensive overview of the Westside townhouse market in July, indicating changes in supply, demand, pricing, and their respective trends over time.

Facebook  Twitter  Linkedin