July 2026 Traffic Volume
The Town of Banff Traffic Management Team would like to share the following vehicle volume comparison charts and graphs with our stakeholders. Please note that all volume counts represent two-way traffic. For detailed definitions on each section of this report please see the end of this email.
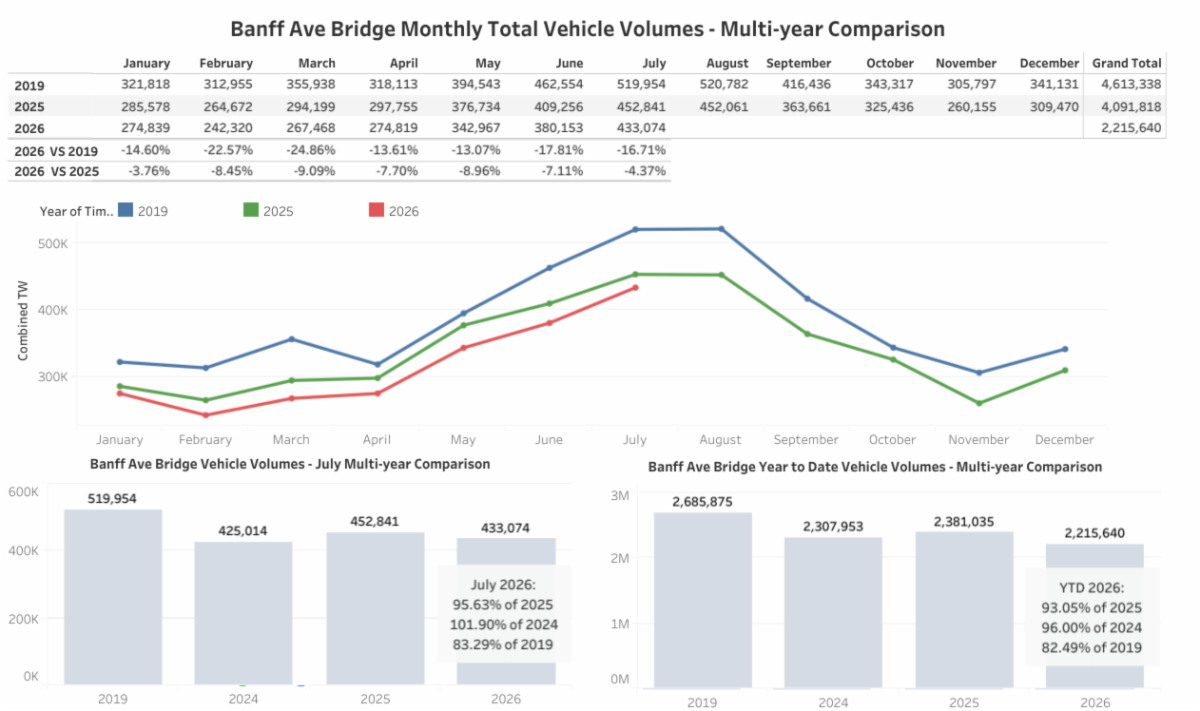
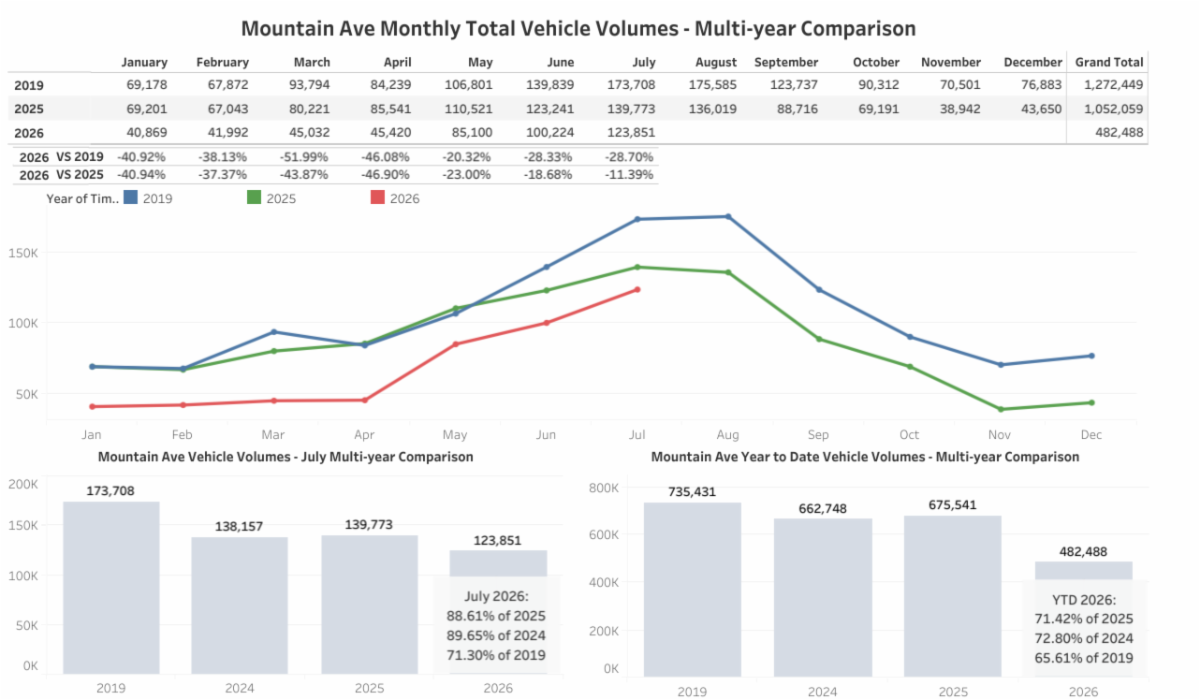
July saw a return to growth after three months of year-over-year decreases. Traffic volumes on the Bow River Bridge and Mountain Avenue remain significantly lower than in 2025. The Rimrock renovations were completed at the end of June, so Mountain Avenue traffic volumes should now reflect normal seasonal demand.
Main Entrances
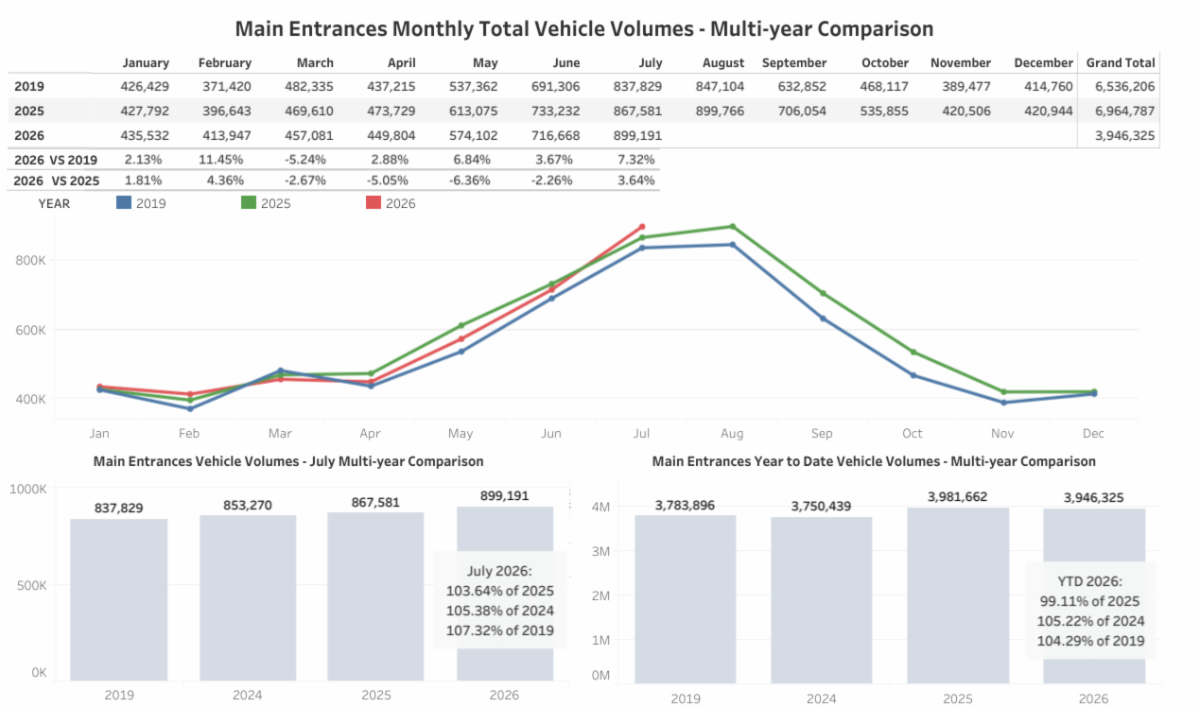
Traffic counters at the two main entrances to the town of Banff recorded a total of 899,191 vehicles in the month of July 2026, which is a 4% increase from July 2025 and a 7% increase from pre-pandemic 2019.
Year-to-date in 2026, up to the end of July, 3,946,325 vehicles were recorded at the two main entrances to the town of Banff. This is a 1% decrease compared with 2025 and a 4% increase compared with 2019.
July Weather Overview
- The average daily high in July 2026 was 25.4 C, the average daily low 7.2 C, and 5.9 mm precipitation.
- The average daily high in July 2025 was 21.5 C, the average daily low 7.5, and 98.7 mm precipitation.
- The average daily high in July 2024 was 26.2 C, the average daily low 8.7 C, and 11.1 mm precipitation.
The average daily high for July in Banff is 22.5 C, the average daily Low 6.8 C, and averages 46.9 mm precipitation. Climate normals are computed over a 30-year period to eliminate year-to-year variations.
Source: Environment Canada
|