|
In this issue:
- More teens working during the summer in Tennessee
- Big cities in the state seeing large bumps in population
- 2020 census challenges and group quarter reviews submitted across the state
- Areas of persistent poverty in Tennessee, by county and tract
| |
11,668 First-Time Child Abuse and Neglect Cases
occurred on average each year between 2019 and 2021 in Tennessee. The figure was among the findings in new Boyd Center research, which also showed one in eight children born in the state will be a substantiated victim by adulthood. The economic impact of child abuse in the state is estimated to be at least $3.3 billion annually.
| |  |
28.2 Percent of Households have One Person
according to the latest 2020 Census data release showing data on Tennessee households. This is up from 26.9% in 2010. A new U.S. Census Bureau report finds that only 7.7 percent of households had a single occupant in 1940. An increasing number of one-person households are headed by someone 65 years and older.
| |
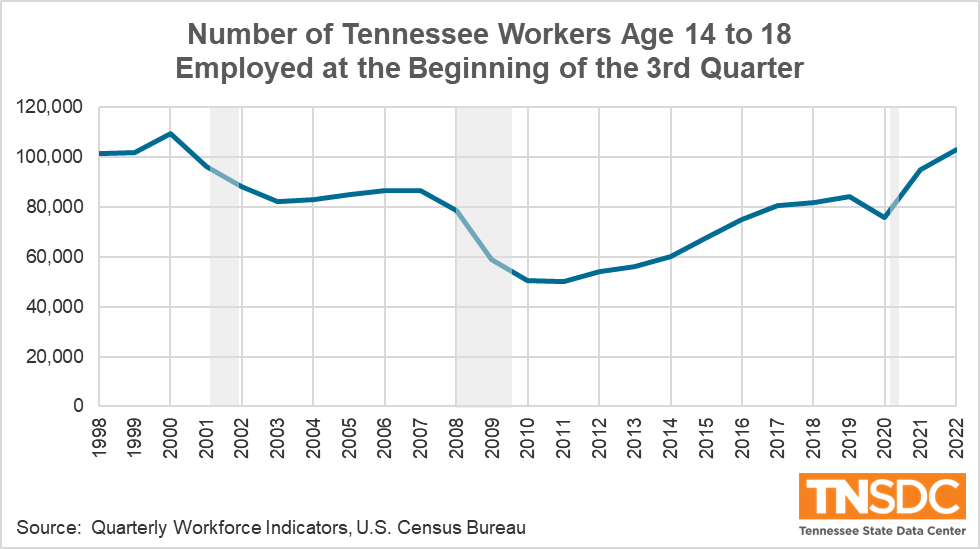
Teen Employment Makes a Comeback in Tennessee | |
|
For many teens, their entry point into the workforce is a job at a local restaurant, retailer or even summer work as a lifeguard. And the number of Tennessee teens that are working is on the rise.
In the third quarter of 2022, there were almost 103,000 teen workers – the highest level recorded since the summer of 2000 when over 109,000 teens were employed. And it’s more than double the number that were working in 2010 when just 12 percent of 14- to 18-year-olds had jobs.
| |
|
Summer Jobs - 2022’s top five sectors for change in quarter 2 to quarter 3 employment for 14- to 18-year-old workers in Tennessee. | |
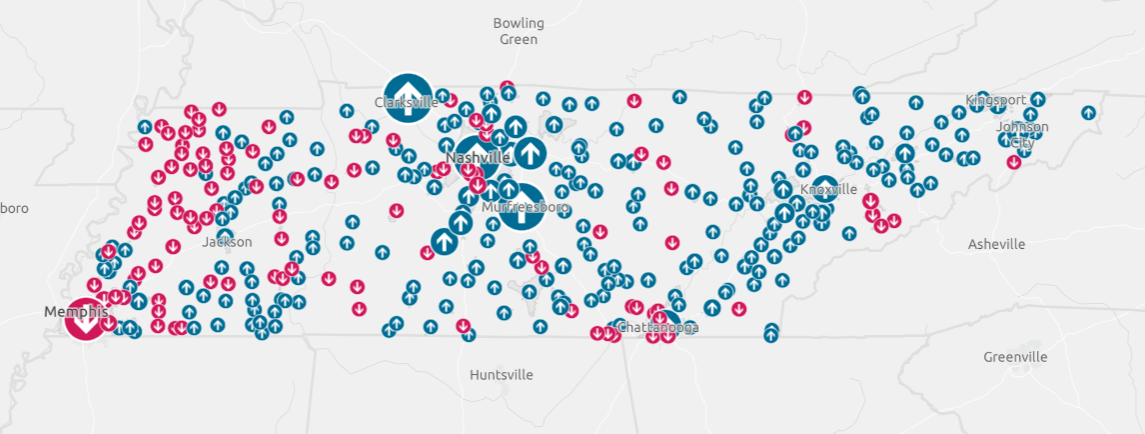
Clarksville Gonna Clarksville – Population Estimates Show Big Cities Make Big Gains in 2022 | |
View map full screen - Explore an interactive map of the newly released Vintage 2022 Population Estimates for each Tennessee city and town. | |
|
Back in 2021, estimates showed that population had declined in three of the four largest cities in Tennessee. But in 2022, the state’s big cities showed strong growth. New population estimate data released on May 18th by the Census Bureau showed that growth accelerated in large cities across Tennessee and the U.S. last year.
This year’s list was again led by two middle Tennessee cities. Clarksville added over 6,000 new residents and recorded its largest one-year increase since 2012. The Bureau’s revised 2021 numbers now show Clarksville was the state’s fastest-growing city for the second year running.
That led to some speculation that Clarksville could surpass Chattanooga to become the state’s fourth most populous city. It’s hard to say if either city will maintain 2022’s torrid pace of increase fueled by record net-migration increases across the state. Regardless, Clarksville has made up ground on the Scenic City, having outpaced its population increases in eight of the last 10 years.
Murfreesboro grew by 5,700 and likely saw its largest one-year gain ever. The Rutherford County city has more than doubled in size since 2000 when its population was just under 71,000.
| |
Ten Largest Numeric Population Increases Among Cities in Tennessee Between July 1, 2021, and July 1, 2022 | |
Source: Vintage 2022 Population Estimates, U.S Census Bureau. | | | |
- Interactive map of municipal population change
- Breakdowns on the rest of the top 10 fastest-growing cities
- Highlights from across the state
| |
Tennessee Economic Indicators | |
2020 Census Challenges and Group Quarter Reviews Submitted Across the State | |
|
The Census Bureau’s inbox has been full of mail from Tennessee communities challenging the 2020 Census. Huntsville, Rockford, Westmoreland and Jamestown all submitted evidence of corporate boundary problems that appeared in the 2020 Census Redistricting data. If accepted, revised counts will be issued and can be used in state and federal population-based funding formulas.
Those challenges were filed in part through a collaboration between the State Data Center and the University of Tennessee’s Municipal Technical Advisory Service (MTAS). Together, the organizations engaged targeted communities, helped with ordinance research and prepared the submission packages that are required to participate in the Bureau’s Count Question Resolution Program (CQR). Additional challenges are expected to be filed by the June 30 deadline.
Monitor CQR and PCGQR Cases on Our Website
- Published Errata
- Submission Packages for Tennessee Communities
- Census Bureau Determination Letters for Resolved Cases
- Status of Outstanding Cases
| |
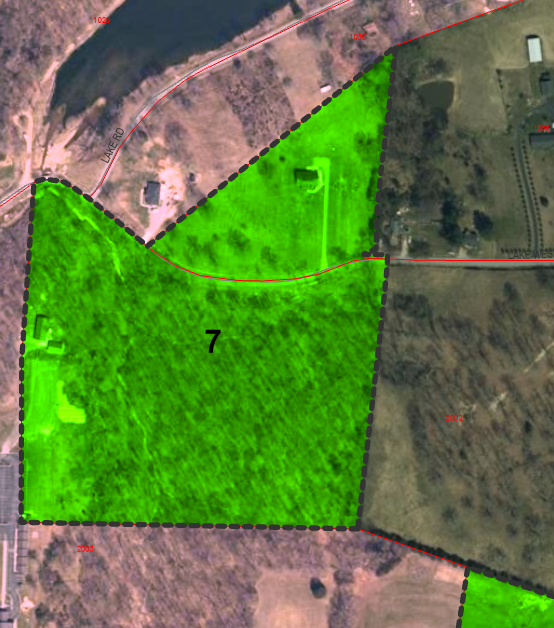
This area of Westmoreland was included in the town’s 2020 census challenge. It contains housing units and was inadvertently not shown as being within the corporate limits. | |
New Release: Areas of Persistent Poverty for Counties and Tracts
Persistent poverty focuses on identifying geographic areas with high poverty rates over a long period of time. New Census Bureau research incorporates data from the 1990 and 2000 decennial censuses with 5-year American Community Survey Data for 2009 and 2019. This shows areas where poverty rates have been higher than 20% for the duration of the 30-year period.
In total, 2.3 percent of the state’s population—or about 153,000 people—live in a county with persistent poverty, compared to 6.1 percent across the rest of the country. At the tract level, Tennessee's numbers increase with 9.5 percent or 620,000 people living in persistent-poverty census tracts.
The findings note that people living in persistent-poverty areas encounter “limited access to medical services, healthy and affordable food, quality education and civic engagement opportunities.”
| |
|
Counties in Persistent Poverty
(Download .xlsx)
| Eight rural Tennessee counties were identified as being in persistent poverty. These include Campbell, Cocke, Fentress, Grundy, Hancock, Johnson, Lake and Scott. | | |
Census Tracts in Persistent Poverty (Download .xlsx) | Persistent poverty at the tract level shows sub-county areas where poverty exceeded 20 percent over the past 30 years. A mix of 194 tracts in urban and rural areas were identified. | | |
Boyd Center Population Projections Update
The next round of Tennessee population projections could soon be on the horizon. A key input for the new projections will be the 2020 Intercensal Population Estimates, which are published by the Census Bureau’s Population Division. A release date for this product is not currently available but is expected to be announced soon.
The intercensal estimates provide a “smoothed” population estimate time series for each year between known population beginning and endpoints - the 2010 and 2020 Censuses. The Boyd Center’s current projections were released in the spring of 2022 and do not yet include important demographic data captured in the 2020 Census.
The Boyd Center projections are released on a biennial basis. They include annual data on 5-year age groups, sex and race/ethnicity for the state and Tennessee’s 95 counties covering the period from 2020-2070.
| |
US Census Bureau Special Census Program Opens
Tennessee communities looking to offload their special census work may want to look into the U.S. Census Bureau’s Special Census Program, which reopened in April. Historically, most areas of the state have conducted their own special census, but the state’s procedures permit communities to utilize the Census Bureau to complete the count.
Fast-growing communities in the state frequently turn to Tennessee’s Special Census program to enumerate their population between decennial censuses. If the results show a city, town or county added population, then it can collect a larger portion of the state’s shared revenues.
| |
About the Tennessee State Data Center Network | |
The State Data Center Program is a cooperative program of the State of Tennessee, The University of Tennessee and the U.S. Census Bureau. Data Centers in each state assist the Bureau by disseminating Census data, other federal data sets and information. | |
Data Center Affiliates
Each center has an internal statewide affiliate network to further assist in disseminating data to local users. These affiliates also have local information and expertise to offer. Visit tnsdc.utk.edu for a full listing of affiliates.
| |
916 Volunteer Blvd. | 713 Stokely Management Center
Knoxville, TN 37996
| |
| | | |