Key Questions for the Long-Term Investor
|
|
Focusing on what you can control can lead to a better investment experience.
Whether you’ve been investing for decades or are just getting started, at some point on your investment journey you’ll likely ask yourself some of the questions below. Trying to answer these questions may be intimidating, but know that you’re not alone. While this is not intended to be an exhaustive list it will hopefully shed light on a few key principles, using data and reasoning, that may help improve investors’ odds of investment success in the long run.
1.
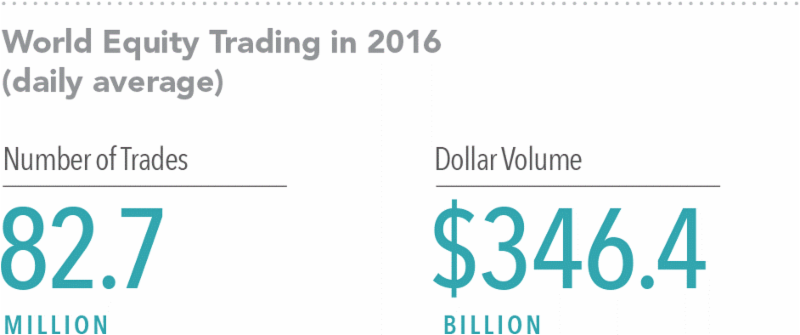
What sort of competition do I face as an investor?
The market is an effective information-processing machine. Millions of market participants buy and sell securities every day and the real-time information they bring helps set prices.
This means competition is stiff and trying to outguess market prices is difficult for anyone, even professional money managers (
see question 2 for more on this
). This is good news for investors though. Rather than basing an investment strategy on trying to find securities that are priced “incorrectly,” investors can instead rely on the information in market prices to help build their portfolios
(see question 5 for more on this
).
|
|
Source: World Federation of Exchanges members, affiliates, correspondents, and non-members. Trade data from the global electronic order book. Daily averages were computed using year-to-date totals as of December 31, 2016, divided by 250 as an approximate number of annual trading days.
|
|
2.
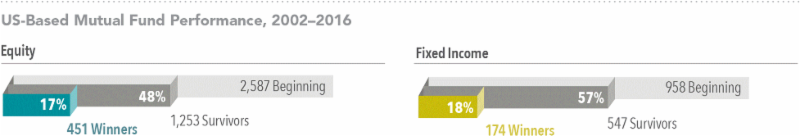
What are my chances of picking an investment fund that survives and outperforms?
Flip a coin and your odds of getting heads or tails are 50/50. Historically, the odds of selecting an investment fund that was still around 15 years later are about the same. Regarding
outperformance
, the odds are even worse. The market’s pricing power works against fund managers who try to outperform through stock picking or market timing. One needn’t look
further than real-world results to see this. A 2017 study of the mutual fund landscape showed that only 17% of US equity mutual funds and 18% of fixed income funds have survived and outperformed their benchmarks over the past 15 years. In other words, the deck is stacked against mutual funds that attempt to outguess the market.
|
|
Source: *Mutual Fund Landscape 2017, Dimensional Fund Advisors. See Appendix for important details on the study. Past performance is no guarantee of future results.
|
|
3.
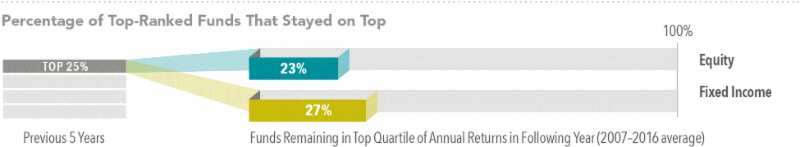
If I choose a fund because of strong past performance, does that mean it will do well in the future?
Some investors select mutual funds based on past returns. However, research shows that most funds in the top quartile (25%) of previous five-year returns did not maintain a top-quartile ranking in the following year. In other words, past performance offers little insight into a fund’s future returns.
This lack of persistence casts further doubt on the ability of managers to consistently gain an informational advantage on the market. Some fund managers might be better than others, but track records alone may not provide enough insight to identify management skill. Stock and bond returns contain a lot of noise, and impressive track records may result from good luck. The assumption that strong past performance will continue often proves faulty, leaving many investors disappointed.
|
|
Source: *Mutual Fund Landscape 2017, Dimensional Fund Advisors. See Appendix for important details on the study. Past performance is no guarantee of future results.
|
|
4.
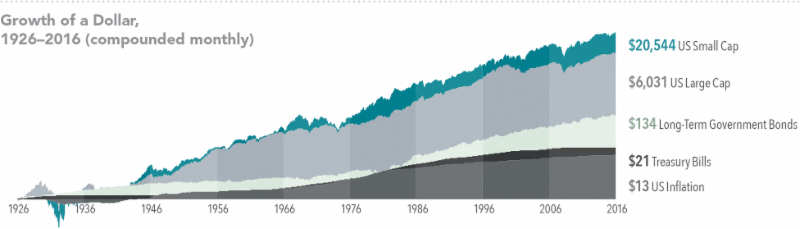
Do I have to outsmart the market to be a successful investor?
Financial markets have rewarded long-term investors. People expect a positive return on the capital they invest, and historically, the equity and bond markets have provided growth of wealth that has more than offset inflation. Instead of fighting markets, let them work for you.
|
|
US Small Cap is the CRSP 6–10 Index. US Large Cap is the S&P 500 Index. Long-Term Government Bonds is the IA SBBI US LT Govt TR USD, provided by Ibbotson Associates via Morningstar Direct. Treasury Bills is the IA SBBI US 30 Day TBill TR USD, provided by Ibbotson Associates via Morningstar Direct. US Inflation is measured as changes in the US Consumer Price Index. US Consumer Price Index data is provided by the US Department of Labor Bureau of Labor Statistics. CRSP data is provided by the Center for Research in Security Prices, University of Chicago. The S&P data is provided by Standard & Poor’s Index Services Group. Indices are not available for direct investment. Index performance does not reflect the expenses associated with the management of an actual portfolio. Past performance is no guarantee of future results.
|
|
5.
Is there a better way to build a portfolio?
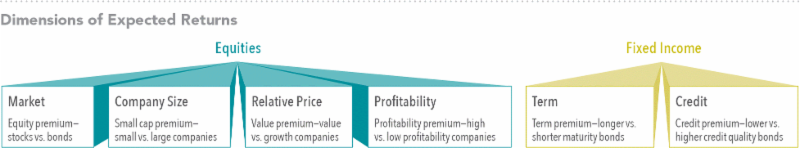
Academic research has identified certain equity and fixed income factors, which point to differences in expected returns among securities. Instead of attempting to outguess market prices, investors can instead pursue higher expected returns by structuring their portfolio around these factors.
In the equity market, the factors are size (small cap vs. large cap), relative price (value vs. growth), and expected profitability (high vs. low). In the fixed income market, these factors are term and credit quality. The return differences between stocks and bonds can be considerably large, as can the return differences among a group of stocks or bonds.
To be considered a reliable factor, it must be sensible, backed by data over time and across markets, and cost-effective to capture in diversified portfolios.
In a factors-based approach, capturing returns does not involve predicting which stocks, bonds, or market areas are going to outperform in the future. Rather, the goal is to hold well-diversified portfolios that emphasize factors that produce higher expected returns, control costs, and have low turnover.
|
|
Relative price is measured by the price-to-book ratio; value stocks are those with lower price-to-book ratios. Profitability is a measure of current profitability based on information from individual companies’ income statements.
|
|
6.
Is international investing for me?
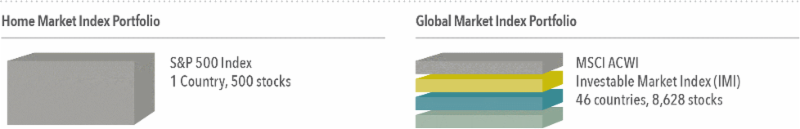
Diversification helps reduce risks that have no expected return, but diversifying only within your home market may not be enough. Instead, global diversification can broaden your investment opportunity set. By holding a globally diversified portfolio, investors are well positioned to capture returns wherever they occur.
|
|
Number of holdings and countries for the S&P 500 Index and MSCI ACWI (All Country World Index) Investable Market Index (IMI) as of December 31, 2016. The S&P data is provided by Standard & Poor’s Index Services Group. MSCI data ©MSCI 2017, all rights reserved. International investing involves special risks such as currency fluctuation and political stability. Investing in emerging markets may accentuate those risks. Diversification does not eliminate the risk of market loss. Indices are not available for direct investment.
|
|
7.
Will making frequent changes to my portfolio help me achieve investment success?
Even with a globally diversified portfolio, market movements can tempt investors to switch asset classes based on predictions of future performance.
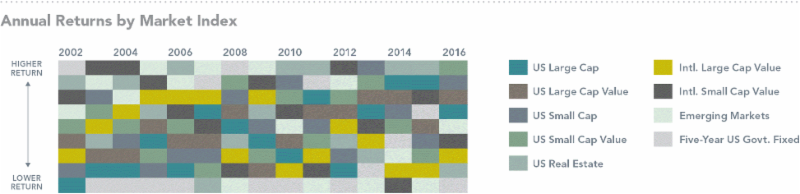
The image below features annual ranked performance of major asset classes in the US and international markets over the past 15 years. The asset classes are represented by corresponding market indices and the patchwork dispersion of colors shows that the relative performance of asset classes is unpredictable across periods.
Investors who follow a structured, diversified approach are well positioned to capture returns whenever and wherever they occur. Diversification also reduces the risk of being heavily invested in an underperforming asset group in any given year.
|
|
US Large Cap is the S&P 500 Index. US Large Cap Value is the Russell 1000 Value Index. US Small Cap is the Russell 2000 Index. US Small Cap Value is the Russell 2000 Value Index. US Real Estate is the Dow Jones US Select REIT Index. International Large Cap Value is the MSCI World ex USA Value Index (net dividends). International Small Cap Value is the MSCI World ex USA Small Cap Value Index (net dividends). Emerging Markets is the MSCI Emerging Markets Index (net dividends). Five-Year US Government Fixed is the Bloomberg Barclays US TIPS Index 1–5 Years. The S&P data is provided by Standard & Poor’s Index Services Group. Frank Russell Company is the source and owner of the trademarks, service marks, and copyrights related to the Russell Indexes. Dow Jones data provided by Dow Jones Indices. MSCI data ©MSCI 2017, all rights reserved. Bloomberg Barclays data provided by Bloomberg. Indices are not available for direct investment. Index performance does not reflect the expenses associated with the management of an actual portfolio. Past performance is no guarantee of future results.
|
|
8.
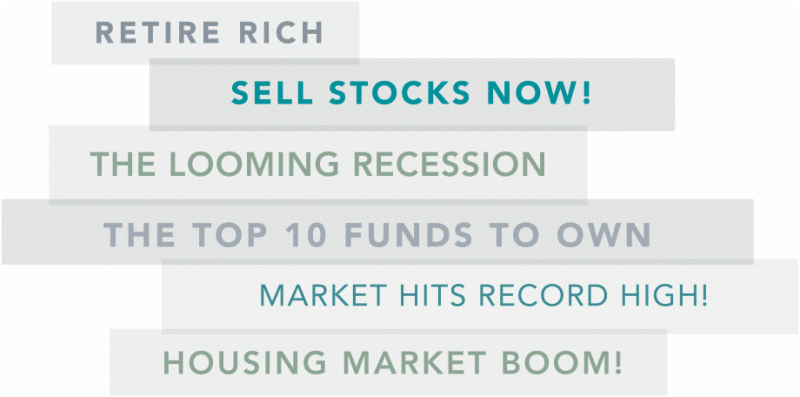
Should I make changes to my portfolio based on what I’m hearing in the news?
Daily market news and commentary can challenge your investment discipline. Some messages stir anxiety about the future, while others tempt you to chase the latest investment fad. If headlines are unsettling, consider
the source and try to maintain a long-term perspective.
|
|
9.
So, what should I be doing?
At Ascend Wealth Management, we believe that focusing on what you can control can lead to a better investment experience.
- Create an investment plan to fit your needs and risk tolerance.
- Structure a portfolio along the dimensions of expected returns.
- Diversify globally.
- Manage expenses, turnover, and taxes.
- Stay disciplined through market dips and swings.
|
|
APPENDIX
Question 2:
The sample includes US-based funds at the beginning of the 15-year period ending December 31, 2016. Each fund is evaluated relative to the Morningstar benchmark assigned to the fund’s category at the start of the evaluation period. Surviving funds are those
with return observations for every month of the sample period. Winner funds are those that survived and whose cumulative net return over the period exceeded that
of their respective Morningstar category benchmark.
Question 3:
At the end of each year, funds are sorted within their category based on their five-year total return. Funds in the top quartile (25%) of returns are evaluated again in the following year based on one-year performance in order to determine the percentage of funds that maintained a top-quartile ranking. The analysis is repeated each year from 2007–2016. The chart shows average persistence of top-quartile funds during the
10-year period.
Questions 2 and 3:
US-domiciled open-end mutual fund data is from Morningstar and Center for Research in Security Prices (CRSP) from the University of Chicago. Index funds and fund-of-funds are excluded from the sample. Equity fund sample includes the Morningstar historical categories: Diversified Emerging Markets, Europe Stock, Foreign Large Blend, Foreign Large Growth,
Foreign Large Value, Foreign Small/Mid Blend, Foreign Small/Mid Growth, Foreign Small/Mid Value, Japan Stock, Large Blend, Large Growth, Large Value, Mid- Cap Blend, Mid-Cap Value, Miscellaneous Region, Pacific ex-Japan Stock, Small Blend, Small Growth, Small Value, and World Stock. Fixed income fund sample includes the Morningstar historical categories:
Corporate Bond, Inflation-Protected Bond, Intermediate Government, Intermediate-Term Bond, Muni California Intermediate, Muni National Intermediate, Muni National Short, Muni New York Intermediate, Muni Single State Short, Short Government, Short-Term Bond, Ultrashort Bond, and World Bond. For additional information regarding the Morningstar historical categories, please see “The Morningstar Category Classifications”
at
morningstardirect.morningstar.com/clientcomm/
Morningstar_Categories_US_April_2016.pdf
. See Dimensional’s “Mutual Fund Landscape 2017” for more detail. Benchmark data provided by Bloomberg Barclays, MSCI, Russell, Citigroup, and S&P. Bloomberg Barclays data provided by Bloomberg. MSCI data © MSCI 2017, all rights reserved. Frank Russell Company is the source and owner of the trademarks, service marks, and copyrights related to the Russell Indexes. Citi fixed income indices © 2017 by Citigroup. The S&P data is provided by Standard & Poor’s Index Services Group.
|
|
Ascend Wealth Management Inc. is a Registered Investment Adviser. We serve as an independent, fee-only wealth management firm for individuals, families and institutions to help them achieve their investment goals. To learn more about us and our services, please visit our website or contact us at
info@ascendwealth.com
.
This newsletter is solely for informational purposes. Advisory services are only offered to clients or prospective clients where Ascend Wealth Management Inc. and its representatives are properly licensed or exempt from licensure. Past performance is no guarantee of future returns. Investing involves risk and possible loss of principal capital. No advice may be rendered by Ascend Wealth Management Inc. unless a client service agreement is in place.
|
|
Ascend Wealth Management Inc
.
700 Larkspur Landing Circle, Suite 199
Larkspur, CA 94939
(415) 569-7909
|
|
If you were forwarded this email and would like to receive future editions of
The Astute Investor
in your mailbox, please subscribe here:
|
|
|
|
|
|
|