|
The 2025 OUTLOOK is HERE!
In case you missed it, make sure to take a look at the...
2025 Outlook: Pragmatic Optimism
**IMPORTANT DISCLOSURES
This material is for general information only and is not intended to provide specific advice or recommendations for any individual. The economic forecasts may not develop as predicted. Please read the full OUTLOOK 2025: Pragmatic Optimism publication for additional description and disclosure. This research material has been prepared by LPL Financial LLC.
| | Fait Accompli \fe takɔ̃ˈpli\ noun: an accomplished fact; a thing already done | | |
Cornerstone Fait Accompli
Corned beef and cabbage is a staple of St. Patrick’s Day celebrations. In 2014 there were 40.3 billion pounds of beef and 2.2 billion pounds of cabbage in the United States.
| | | | Did you see our latest post? | |
Never miss a Cornerstone announcement - make sure you are following us on Facebook!
When you follow us you'll get access to up to date market information, helpful financial planning tools like calculators, and all of the Cornerstone office happenings!
Click the button below,
make sure you're logged into your account and follow our Facebook page.
| | Click on the buttons below and don't forget to like, comment and share our posts! | | This statement is a testimonial by a client of the financial professional as of 7/27/23. The client has not been paid or received any other compensation for making these statements. As a result, the client does not receive any material incentives or benefits for providing the testimonial. These views may not be representative of the views of other clients and are not indicative of future performance or success. | | |
U.S. equity markets officially entered correction territory last week for the first time in 344 trading days. Tariff uncertainty feeding into economic growth concerns has been the primary catalyst behind the risk-off rotation. The 10% drop — the technical qualifier for a correction — over the last few weeks has been swift and painful, especially given that the selling pressure started from a fresh record high on February 19. However, although the economy has slowed this year as we expected, it has not stopped, and corporate America continues to deliver double-digit earnings growth. The solid fundamental footing supports our thesis that the economy is not entering a recession or a bear market. Historically tight credit spreads further support this view. Our message to investors right now is don’t panic and stay focused on the long term. And remember, volatility also brings opportunity, or as legendary investor Warren Buffet once said, “Bad news is an investor’s best friend. It lets you buy a slice of America’s future at a marked-down price.”
Volatility Is Back
Inconsistency seems to be the only constant since tariffs were first announced. The White House’s continuous change in direction on trade policy has weighed on business sentiment gauges and left investors with limited visibility to buy the dip. Initially, markets welcomed President Trump’s delayed implementation of tariffs and his openness for trade negotiations, but that trend seemingly changed more toward a sell now, ask questions later attitude. This has been most pronounced at the institutional level, as the hedge fund community has steadily reduced U.S. equity market exposure over the last month (retail investors have remained buyers during this time).
The lack of clarity on tariffs also makes it difficult to assess their potential impact on inflation and economic growth. Some strategists aren’t waiting to find out and recently cut U.S. growth and earnings forecasts. We believe the risk of further downgrades remains on the table until there is more transparency on trade policy. Outside of tariffs, signs of a slowing economy and concerns over spending on artificial intelligence (AI) have further weighed on risk appetite and the American exceptionalism theme. Consumer spending and the jobs market, which have been the pillars of economic strength, have also shown slight signs of deceleration. On a more positive note, a U.S. government shutdown was averted after Congress passed a six-month stopgap spending bill on Friday, leaving investors one less thing to worry about.
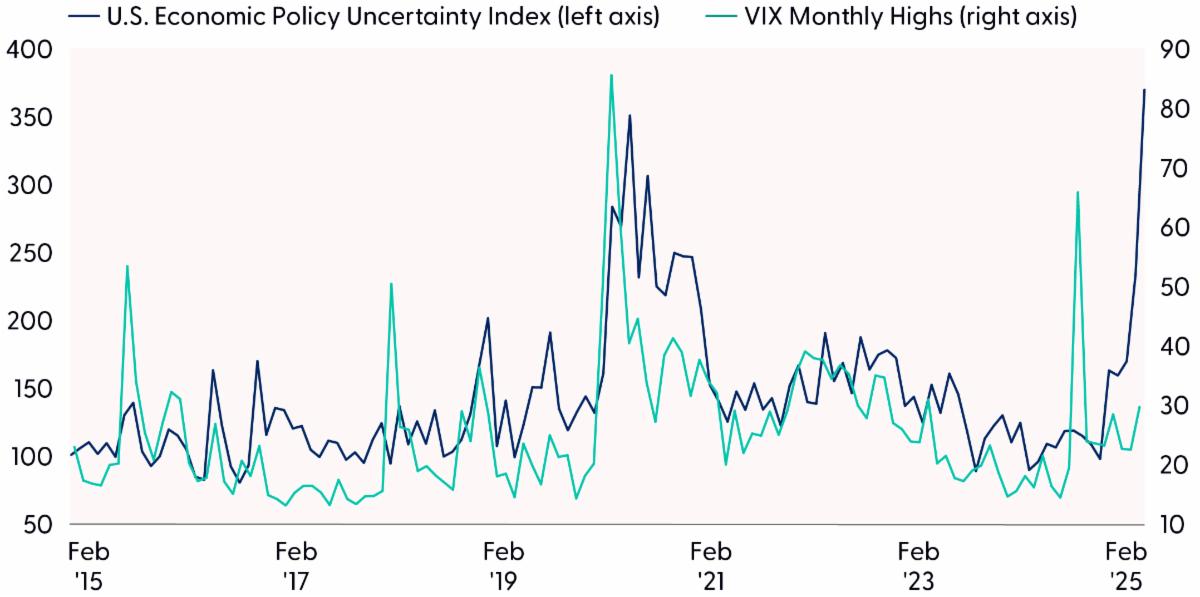
Rising uncertainty in the market is apparent in the U.S. Economic Policy Uncertainty Index. This index uses a mix of indicators to quantify the level of policy ambiguity, including references to economic uncertainty across major newspapers, the number of federal tax code provisions set to expire, and disagreement among economic forecasts. The index also has a high correlation to implied market volatility, measured by the CBOE’s Volatility Index (“VIX”, or as some call it, the “fear gauge”). This positive relationship suggests that until economic policy uncertainty subsides, or at least stabilizes, we should continue to expect elevated levels of market volatility.
Uncertainty Breeds Volatility
| | |
Source: LPL Research, Bloomberg 03/12/25
Disclosures: All indexes are unmanaged and cannot be invested in directly. Past performance is no guarantee of future results.
Corrections Are More Normal Than You May Think
The last few weeks serve as an important reminder that bull markets are not linear. The pain from the recent correction probably feels more acute due to the lack of volatility and selling pressure in 2024 — a year that averaged a new record high every 4.4 trading days. However, according to our friends at Ned Davis Research, a correction on the S&P 500 (from 1926 through 1957 the S&P index was formerly the S&P 90) has occurred every 1.1 years going back to 1928. Corrections also tend to produce attractive buying opportunities.
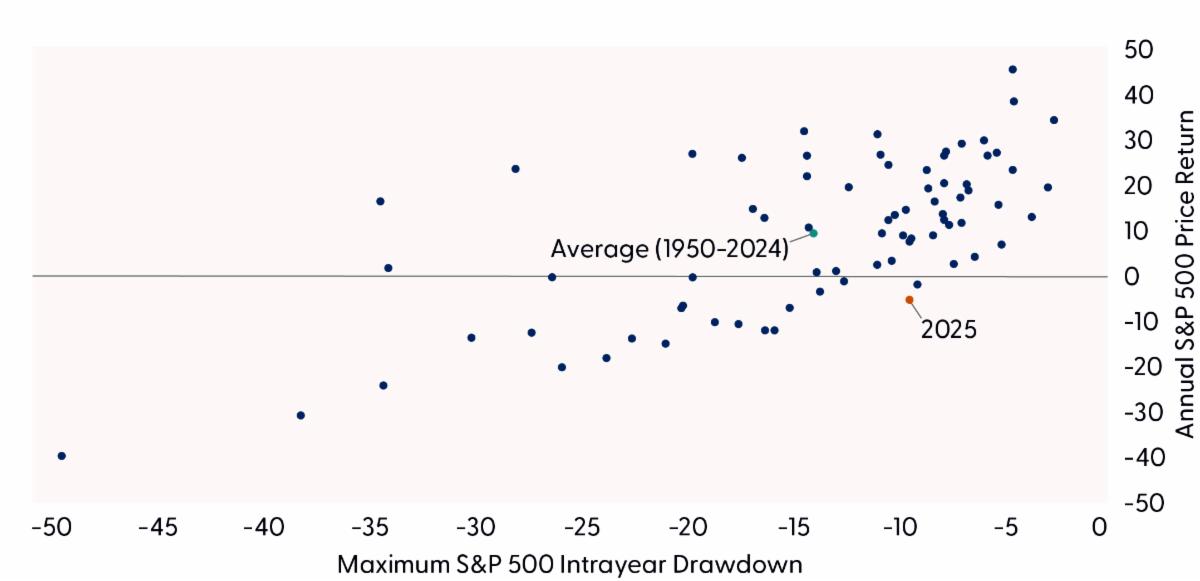
Since 1950, the average maximum drawdown for the S&P 500 during a calendar year has been -13.7%, but the average gain has been 9.5%, with 73% of years also generating positive returns. When focusing on performance for years when the S&P 500 registered a maximum intra-year drawdown between 10–20%, the annual average gain has been 8.4%, with 64% of those years finishing higher. Long story short, remain optimistic as history shows a 10% or more intra-year drawdown does not mean stocks will necessarily finish lower on the year.
S&P 500 Annual Price Returns vs. Intra-year Drawdowns (1950–YTD)
| | |
Source: LPL Research, Bloomberg 03/12/25
Disclosures: All indexes are unmanaged and cannot be invested in directly. Past performance is no guarantee of future results. The modern design of the S&P 500 stock index was first launched in 1957. Performance back to 1950 incorporates the performance of the predecessor index, the S&P 90.
Are We There Yet?
One of the most frequent questions asked during a correction is when the selling pressure will stop. Unfortunately, we do not have a crystal ball to tell us exactly when and where the market will bottom. However, we can leverage history and technical analysis to guide us toward a potential turning point that may get us close enough.
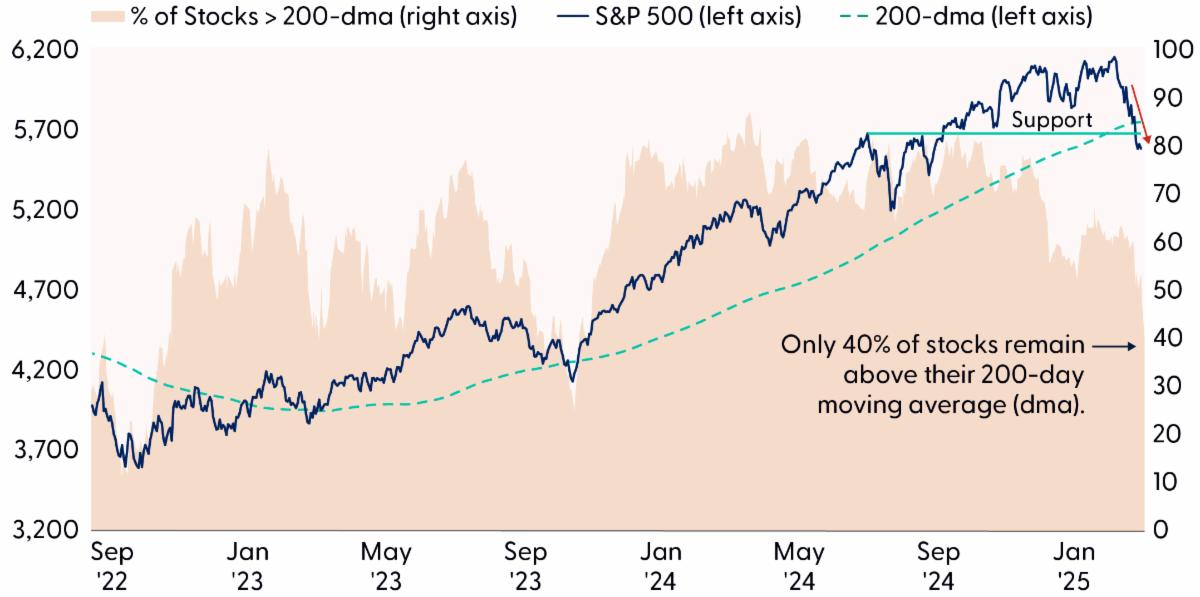
Over the last few weeks, the S&P 500 has suffered an array of technical damage, including a break below the closely watched 200-day moving average (dma) at 5,740 and the July highs near 5,667. These areas now serve as resistance if the market rebounds. Regarding downside risk, key support for the broader market sets up at 5,552, 5,505, and 5,400 (the index closed at 5,639 on March 14). These levels could be tested if market breadth on the index continues to deteriorate. As of last week, only 40% of S&P 500 constituents were trading above their 200-dma, marking the lowest reading since November 2023. While Friday’s broad-based relief rally was a step in the right direction, a reading of at least 50% would be required to push this breadth indicator back into bullish territory.
Technical Damage Continues to Mount on the S&P 500
| | |
Source: LPL Research, Bloomberg 03/12/25
Disclosures: All indexes are unmanaged and cannot be invested in directly. Past performance is no guarantee of future results.
The sharp sell-off has created oversold conditions, and we are beginning to notice signs of the broader market reaching washed-out territory. For example, the percentage of oversold stocks within the index climbed to over 20% last week, an area that has often overlapped with market capitulation points. Most sentiment gauges have also deteriorated to contrarian levels. However, there are still a few more boxes to check on our technical list for identifying a potential market bottom, including:
- A sub-10% reading on the percentage of stocks above their 20-dma
- An intraday high VIX reading of at least 30.1
- The return of institutional demand in U.S. equity markets
- A trend change from defensive to offensive/cyclical sector leadership
- Rebound supported by above-average volume and broad participation
With Volatility Comes Opportunity
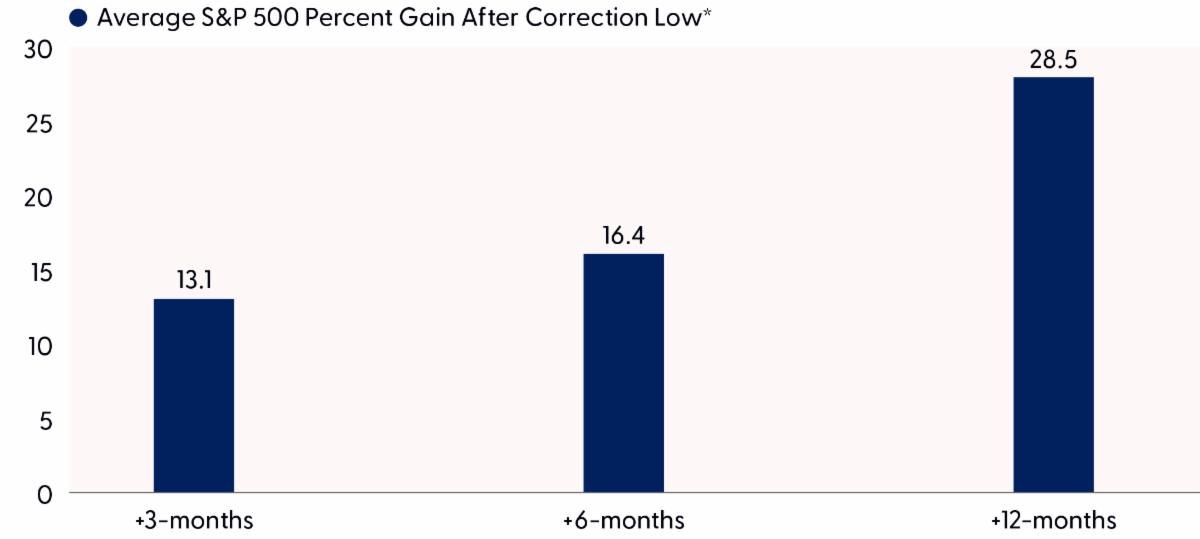
There is a saying on Wall Street that “Nothing good happens below the 200-dma.” This maxim serves more as a testament to respecting the primary trend of the market than science because some of the best buying opportunities throughout history have occurred below the market’s longer-term average. Since 1980, after a correction low, the S&P 500 has traded higher by an average of 13.1% three months later, with gains occurring 92% of the time. Looking ahead 12 months after a correction low, the broader market has gained nearly 30%. Of course, those rallies come with the benefit of hindsight, but they also highlight the potential upside of putting money to work during a correction. Furthermore, some of the best trading days of the year occur at/near correction lows, and trying to time these lows can be costly. For example, if you were to miss the one best day of a year for the S&P 500 since 1990, your annual gain would only be 6.1%. This compares to an average annual gain of 9.8% for a buy-and-hold strategy across the same period. Take out the two best days in the market, and the annualized gain drops to just 3%.
Stocks Tend to Rebound Sharply Off Correction Lows
| | |
*Corrections are defined by a 10-20% peak to trough decline in the S&P 500 from an all–time high.
Source: LPL Research, FactSet 03/10/25 (1980-Current)
Disclosures: All indexes are unmanaged and cannot be invested in directly. Past performance is no guarantee of future results.
Conclusion
Market volatility can be unsettling, especially after two years of steady gains in stocks. Enduring the ups and downs is the price of admission for the attractive returns the stock market offers over time. Volatility is normal, but understanding and controlling emotions in the moment is the hard part.
LPL’s Strategic and Tactical Asset Allocation Committee (STAAC) maintains a tactical neutral stance on equities while actively monitoring progress toward establishing a durable market low. More clarity on tariffs and trade policy, reductions in consensus economic growth and profit expectations, and more technical evidence that sellers have largely washed out are necessary ingredients. We believe we may be close in terms of levels on the S&P 500, but not quite there yet.
For now, we recommend caution. We will continue to monitor tariff news, economic data, earnings estimates, and various technical indicators to identify an attractive entry point to overweight equities. While the risk-reward trade-off has clearly improved, a swift and sustainable recovery seems unlikely under the cloud of trade uncertainty.
LPL Research also suggests exposure to diversifying alternative strategies for both tactical and strategic asset allocations. Products indexed to alternative strategies benchmarks have proven useful in mitigating equity market declines this year.
| | Etymology /edəˈmäləjē/ noun: the origin of a word and the historical development of its meaning. | | XRT: XRT is an extension printed after the ticker symbol for a stock. It indicates that the stock is trading on an ex-rights basis. (XRT is an abbreviation for the word ex-rights.) Ex-rights means that the buyer of the stock does not have the rights to purchase more shares at a lower price anymore because those rights have expired. XRT is printed on the ticker tape—or displayed on the electronic ticker—for clarity and to avoid disputes or confusion about where the rights currently remain. | | |
Have you taken advantage of
CAPS
yet?
Don't miss out!
Many of our clients ask how they benefit from taking action and initiating a Financial Plan for themselves.
When you sign up for our CAPS program, you will get access to:
A personalized financial plan, a place to keep all of
your accounts in one location and a secure place to store your
important documents.
Click Here to Learn More
| | Le commentaire \ˈkɒmɛnt\ masculine noun: a French word meaning a remark or comment | | |
Cornerstone Commentaire
“Women must try to do as men have tried. When they fail, their failure must be but a challenge to others."
-Amelia Earhart
| | Stay Safe, Stay Kind, Stay Strong, Stay Well | | |
P.S. Please feel free to forward this commentary to
family, friends, or colleagues.
+++++++++++++++++++++++++++
The highest compliment
you can give us would be the
referral
of your friends or family!
| | |
Disclosures
This material is for general information only and is not intended to provide specific advice or recommendations for any individual. There is no assurance that the views or strategies discussed are suitable for all investors or will yield positive outcomes. Investing involves risks including possible loss of principal. Any economic forecasts set forth may not develop as predicted and are subject to change.
References to markets, asset classes, and sectors are generally regarding the corresponding market index. Indexes are unmanaged statistical composites and cannot be invested into directly. Index performance is not indicative of the performance of any investment and do not reflect fees, expenses, or sales charges. All performance referenced is historical and is no guarantee of future results.
Any company names noted herein are for educational purposes only and not an indication of trading intent or a solicitation of their products or services. LPL Financial doesn’t provide research on individual equities.
All information is believed to be from reliable sources; however, LPL Financial makes no representation as to its completeness or accuracy.
All investing involves risk, including possible loss of principal.
US Treasuries may be considered “safe haven” investments but do carry some degree of risk including interest rate, credit, and market risk. Bonds are subject to market and interest rate risk if sold prior to maturity. Bond values will decline as interest rates rise and bonds are subject to availability and change in price.
The Standard & Poor’s 500 Index (S&P500) is a capitalization-weighted index of 500 stocks designed to measure performance of the broad domestic economy through changes in the aggregate market value of 500 stocks representing all major industries.
The PE ratio (price-to-earnings ratio) is a measure of the price paid for a share relative to the annual net income or profit earned by the firm per share. It is a financial ratio used for valuation: a higher PE ratio means that investors are paying more for each unit of net income, so the stock is more expensive compared to one with lower PE ratio.
Earnings per share (EPS) is the portion of a company’s profit allocated to each outstanding share of common stock. EPS serves as an indicator of a company’s profitability. Earnings per share is generally considered to be the single most important variable in determining a share’s price. It is also a major component used to calculate the price-to-earnings valuation ratio.
There is no guarantee that a diversified portfolio will enhance overall returns or outperform a non-diversified portfolio. Diversification does not protect against market risk.
Alternative investments may not be suitable for all investors and involve special risks such as leveraging the investment, potential adverse market forces, regulatory changes and potentially illiquidity. The strategies employed in the management of alternative investments may accelerate the velocity of potential losses.
All index data from FactSet or Bloomberg.
This research material has been prepared by LPL Financial LLC.
Not Insured by FDIC/NCUA or Any Other Government Agency | Not Bank/Credit Union Guaranteed | Not Bank/Credit Union Deposits or Obligations | May Lose Value
RES-0003080-0225 | For Public Use | Tracking #710394 (Exp. 03/2026)
| | | | |