Ask Us What We Can Do For You!
 
Market News Update 1/28/2020                                                            January  2020 - Vol 13, Week 4
Want More Information...Click Here for More Stats!
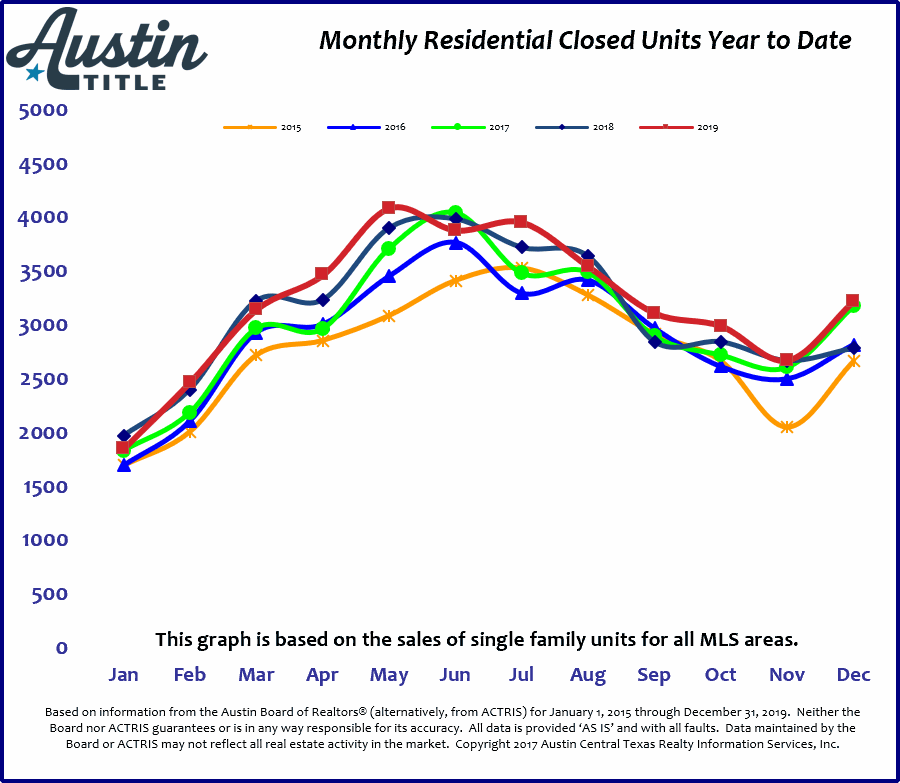
Preliminary Monthly S old Data
December Numbers as of 1/28/2020 (8:24pm)
(numbers may fluctuate as more homes are marked sold in MLS)
Units Sold:
3,214  up 14.99% f rom December 2018   
(The number of solds homes may increase as sales are reported/updated in MLS)

Average Sales Price:
$402,285  up 10.30 % from December 2018

Average Days on the Market:
66.73 days down 6.15 d ays from December 2018

Median Sales Price:
$318,040 which is up 6.37% from  December 2018
 
The Week in Review
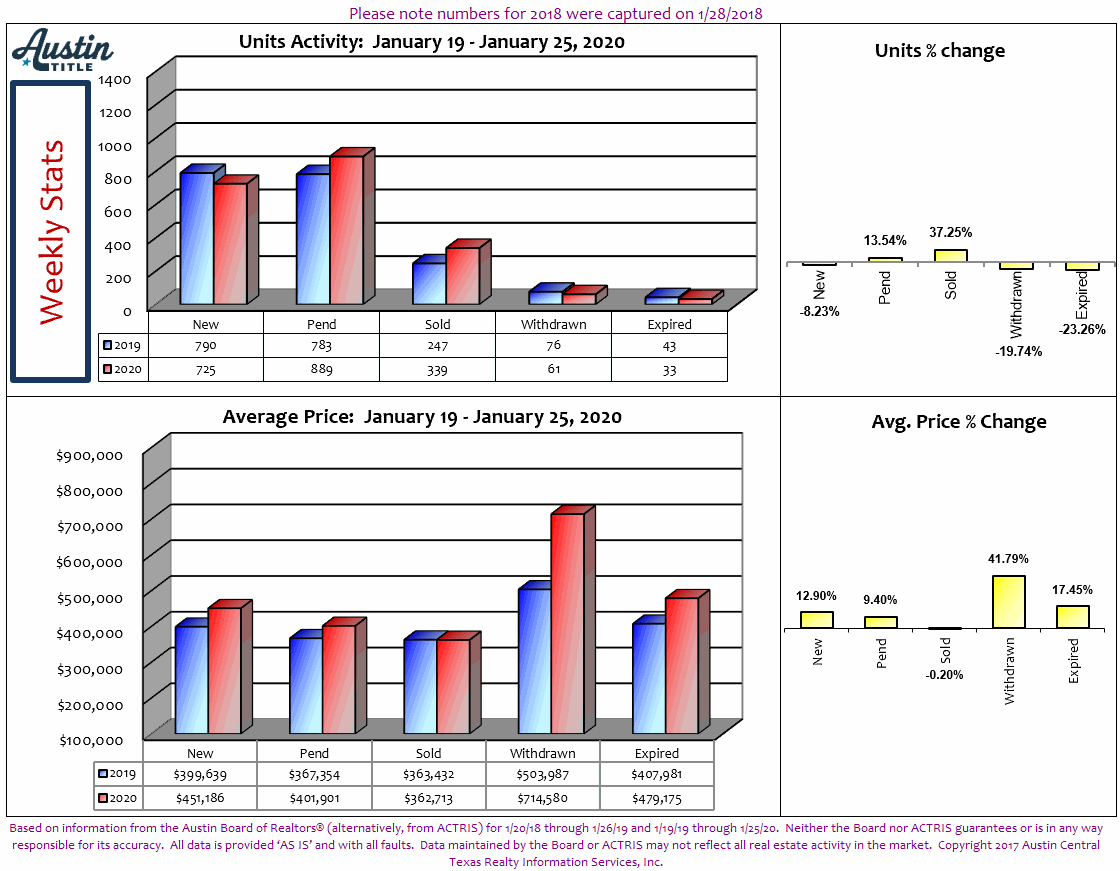
Changes in Units for Sale for the Week of January 19 - 25, 2020
 
New listings - down 8.23%  compared to 1/20- 1/26/2019
 
Pending listings - up 13.54% compared to last year

Sold listings - down 37.25%  compared to same week last year

Current Months of Inventory - is  1.98 months
(last week it was 2.05, last year it was 2.51)

Median Sales Price - $310,000 (1/1/2019 - 12/31/2019)
Changes in Price Ranges
Prices for the Week of January 19 - 25, 2020

Sold average sales prices decreased 0.20% to  $362,713 this past week compared to the same week in 2019 when we had an average of $363,432.

Currently the Total Number of Pending Listings = 4,575 with an average list price of $399,480.  In 2019 the total pendings during the same week was 3,723 with $379,938 average list price.  That is a 22.88% increase in the total number of pendings and a 5.14% increase in the average list price from 2019.
Updates on Current Inventory
Today there are 6,317 active listings on the market.  Last year there were 7,573 active listings during the same week.  That is a 16.59% decrease in total active listings from 2019.

Active Listing History:                                                                Weekly Pending History:
2020 = 6,317                                                                                 2020 = 889
2019 = 7,573                                                                                 2019 = 783
2018 = 6,858                                                                                 2018 = 745
2017 = 6,411                                                                                 2017 = 701
2016 = 5,783                                                                                 2016 = 712
2015 = 5,627                                                                                 2015 = 653
2014 = 5,198                                                                                 2014 = 574
2013 = 5,848                                                                                 2013 = 629
2012 = 7,810                                                                                 2012 = 461
2011 = 9,597                                                                                 2011 = 418
2010 = 9,754                                                                                 2010 = 441

How does this affect your listing?  Check out our Months of Inventory report on our website to get all the details by MLS area and price range.  The provider the report in two formats for either copying or printing for your clients.

Click here for the  MLS Area Inventory Report