|
Market Pulse
JANUARY 2026
| | |
The full 2026 East Tennessee REALTORS® Forecast Report is available now to help you better understand what to expect in the year ahead.
Home prices are forecasted to grow 3.1% in 2026.
Total home sales are expected to increase 6.8% year-over-year.
Rent is estimated to continue dropping slightly at - 1.6%.
If December's comeback is any indicator, 2026 will be a year of renewed opportunity for real estate in East Tennessee. The housing market reset has continued, with a second year of positive sales growth and slowing price appreciation.
While the path forward appears to be increasingly stable, regional supply challenges remain, and national consumer sentiment about the cost of borrowing continues to have an outsized affect on home sales.
| | |
Home Sales Report
DECEMBER 2025
-
East Tennessee home sales rose 15.1% from December 2024.
-
The median sale price was $370,000 — no change from the previous year.
-
Total housing inventory has increased 18.7% from the previous year.
-
Half of the homes sold were under contract in 38 days or less, up from 30 days a year ago.
-
37.8% of homes sold for the asking price or above, with 17.5% selling for more than the asking price. 6.1% sold for at least $10,000 over asking and 2.4% sold for at least $25,000 over asking price.
-
The sale-to-list price ratio held steady at 98.3% – the same as a year ago.
-
New construction was unchanged at 13.6% of total home sales.
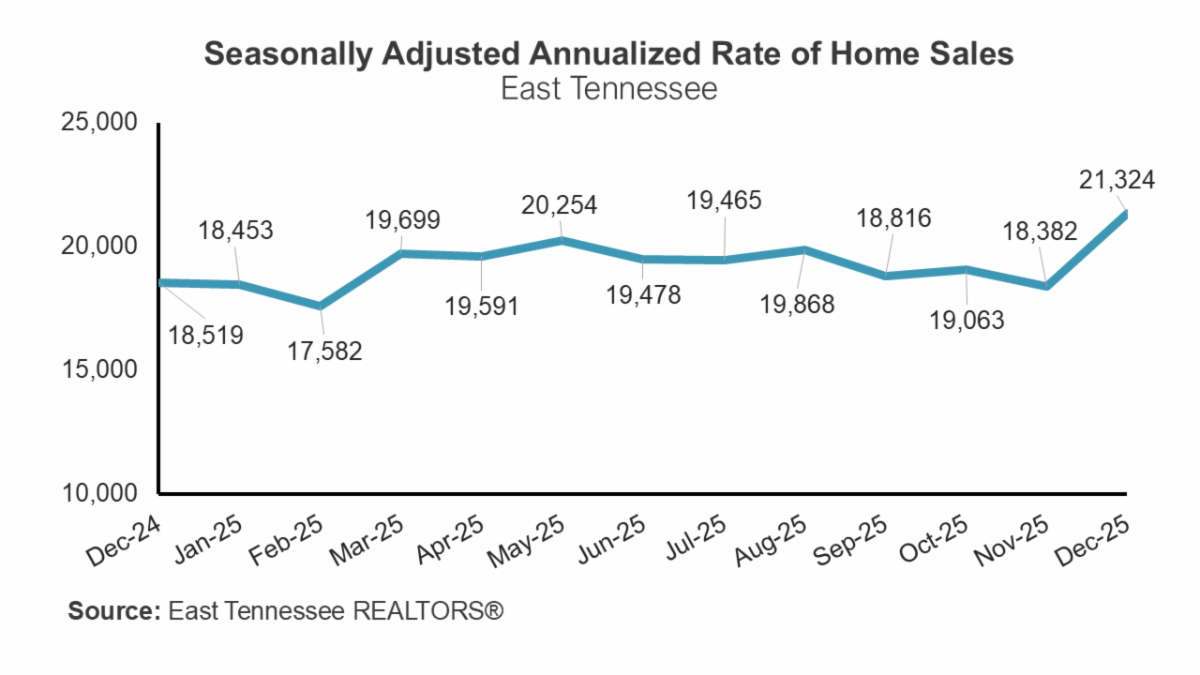
| | East Tennessee REALTORS® reports home sales data using a seasonally adjusted annualized rate (SAAR). This method takes into account seasonal fluctuations in the real estate market, such as increased home sales during the spring and summer, by adjusting the data to provide an annualized rate representing the projected number of homes that would be sold over a year if the current sales pace were to continue. | | |
What's the outlook?
December was an unseasonably robust month of sales, with consumer awareness and excitement about mortgage rates peaking around the rate drop on Dec. 9th and home purchases following. While rates only fell to 5.99% for a very short time (for most applicants), the momentum continued throughout the month.
Home sales finished the year strong, cumulatively up by 4.7% for 2025. This was only the second consecutive year of positive sales growth; sales increased by 1.8% in 2024 after several years of declines. The East Tennessee market has not quite caught up to its pre-pandemic momentum, with total sales in 2025 down 5% from 2019.
As we review the 2025 data and anticipate 2026, a few trends have appeared:
Buyers are overall seeking smaller homes, with the average square footage sold dropping by 2% over the year. The median square footage of homes sold in December was 1,742, notably below the 1,800 square feet benchmark which would traditionally be defined as a starter home.
The quantity of cash purchases has dropped to 21% of total sales from 28% in December 2024. Alongside data that shows the wage gap between incoming movers and existing residents is narrowing as out-of-state in migration calms, it appears that balance is slowly returning - good news for buyers who are borrowing.
Sales of new construction have held steady at 14%, down only slightly from 15% last year. In a reversal of traditional trends, new construction continues to be significantly more affordable than existing homes. In December, the median sale price of existing homes was $407,000 while new construction was $360,000.
The gap in inventory of modestly-priced homes has created an interesting split market dynamic in East Tennessee. Established, legacy neighborhoods with desirable access to amenities are largely "closed," preventing the addition of more dense, smaller homes through zoning, deed covenants or community defense through public process. These homes are typically sold at a luxury price point, and stay on the market slightly longer than average as buyers in this range have more choices and flexibility. ETNR members in this market sector have remarked that sales are sluggish.
On the other end, attainably priced homes are in short supply. Builders attempt to meet this need by adding denser developments in less developed areas, which sometimes strains infrastructure. Buyers of these homes are often budget-conscious, leading the builder to skip pricey add-ons like mature trees and sidewalks. The perception of a difference in value and attractiveness leads neighbors to push back on these developments, even as they are the type in highest demand. Tight supply pushes prices beyond what the buyer can support for this type of home, leading builders to then incentivize and add perks like rate buy-downs to make it accessible. Members in this market sector have noted that transactions are hectic, buyers are more picky than usual, and that there are periods where it seems like nothing is moving despite lots of interest.
Overall, this dynamic has kept the cost of new construction below existing homes nationally and in East Tennessee. The National Association of Homebuilders recently teamed up with the National Association of REALTORS® for an interview on the topic here.
To achieve a better market balance of amenities, housing cost, and quality of life, we will need to rethink the areas where varied housing types and density are permitted. In the interim, home sales volume remains constrained by supply.
| | |
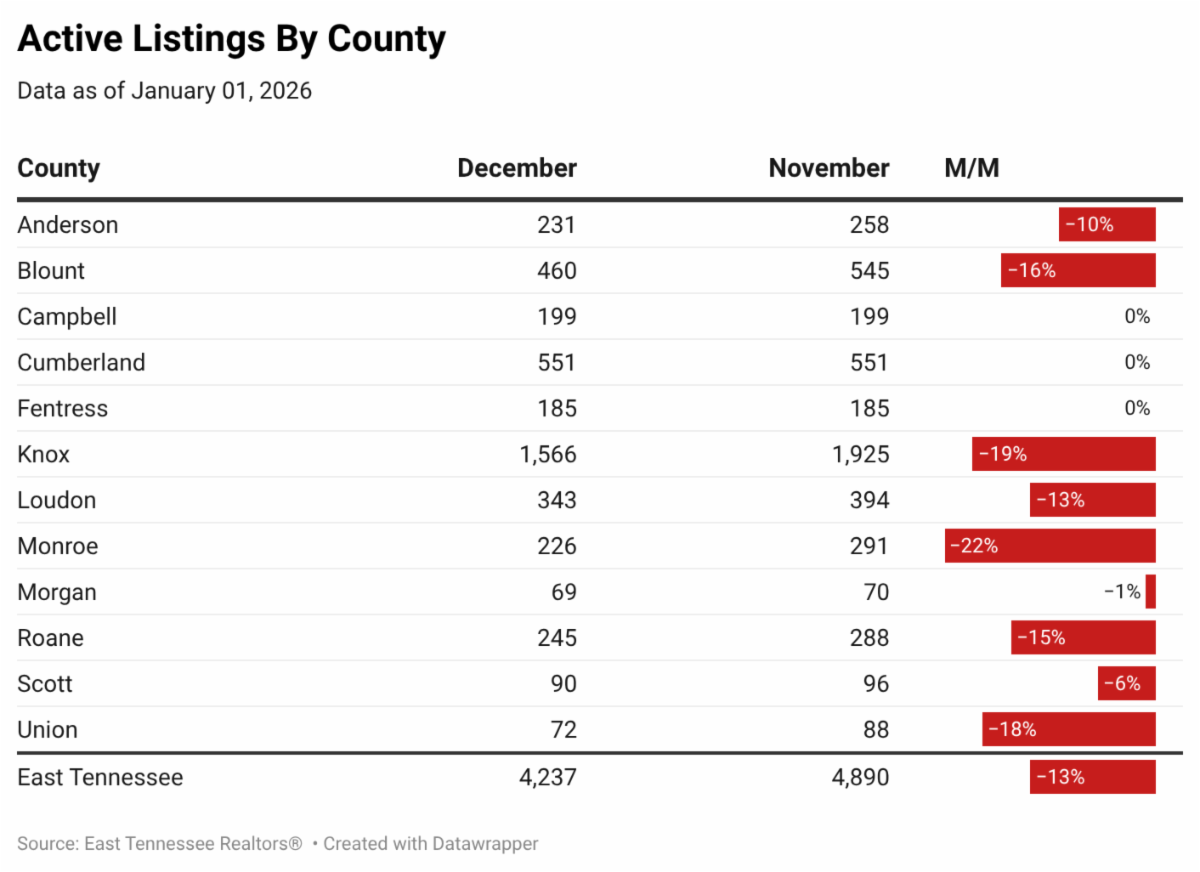
Inventory by county
Out of the 12 counties in the East Tennessee REALTORS® footprint, 8 marked measurable decreases in active listings month-over-month. Enthusiastic sales depleted inventory more quickly than is typical at this time of year. Overall, regional inventory decreased month-over-month by 13%.
| | |
First draft of new Knox County zoning categories is live for feedback
As the last step of the multi-year Advance Knox planning process, Knox County has engaged a consultant to help align codes with the future plan for land use. the result will be a Unified Development Ordinance (UDO) that combines all zoning, street, subdivision, stormwater and other development codes into one comprehensive document. Review the basics and ETNR's position here.)
| |
In January, the county and consultant Orion Planning + Design released the updated zoning districts, descriptions and purpose statements. These determine how land in each type of zone is intended to be used, corresponding to the future land use areas defined during the last step of the plan.
Several notable updates have been made to the zoning districts, including:
- Creating new mixed-use community zones that would allow the type of scaled residential and commercial integration desired in growth areas
- Updating the definition of agricultural districts to clarify acceptable uses and better define productive agriculture versus land that has agricultural characteristics
- Removing the separate Planned Residential district in favor of including planned developments under all of the districts where they previously applied
- Simplifying business and industrial park zoning to allow for tech, medical and other types of businesses to be combined as appropriate
While this initial draft is encouraging, the most difficult and contentious work lies ahead when the updated districts must be applied to the actual map parcel by parcel, including those where current zoning conflicts directly with the stated future plans for the area.
Public meetings have been held virtually and in-person to review the zoning district updates, and the team is accepting feedback online now.
| | |
Rent seasonality and costs flattening, but renters still burdened
Nationwide and locally, rent has continued a 2-year streak of slight declines. At the end of the year, median asking rent across the 50 largest U.S. markets was down 0.7% from 2024. The consistency of this trend is good news; building on a surge of multifamily construction in 2022-2024, supply has begun to catch up with demand.
However, the change in growth rates doesn't tell the whole story. Median asking rent nationwide was still $1,698 - the percentage change only shaves off $35 dollars a month for an individual renter. Data also shows that over the last 6 years, rent increased the most for those in the 25th percentile of cost, meaning that the renters who can least afford an increase are most affected. Realtor.com shares a full analysis of the national market here.
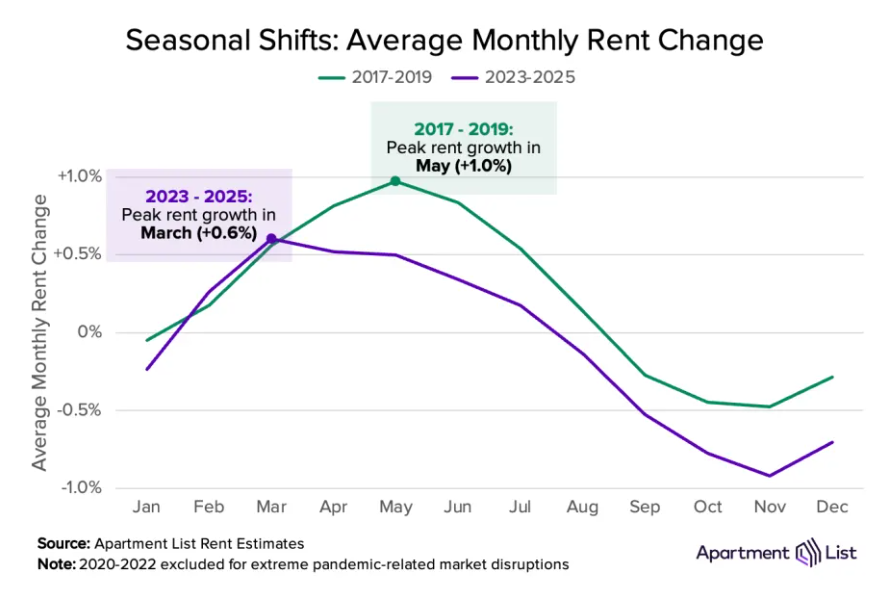
Seeing the shifts in the market, landlords and commercial property management groups have attempted to lessen the constant price adjustments by mitigating seasonality, spreading out renewal periods and offering incentives. Typically movers swap leases during the spring and summer, causing prices to leap during those months but then drop during fall and winter months as demand adjusts. This trend began to reset during the pandemic, as life was put on hold and many renters held on to leases longer than planned, and has continued to shift due to market changes.
According to a recent Apartment List analysis, since 2022 the seasonality of rent has moved earlier in the year, with most move-ins now occurring between January and May. This also affects the home sales market, pulling the seasonality of first time buyers moving from rentals to purchases toward the earlier months of the year when inventory is typically tighter from sellers.
An NAR study recently showed that more than 21,000 renter households in the Knoxville metropolitan statistical area could afford to buy the median priced home, based on the mortgage rates in December of 2025. While we can't show causation, anecdotal evidence indicates that these potential buyers are holding back because the right type of inventory is unavailable. If a buyer is searching in January in anticipation of leases ending, affordably inventory will be significantly lower than in spring months. This month in January 2025, a surge of demand in December has lowered our total regional inventory by 13%, and as much as 19-22% in more populous counties.
| | |
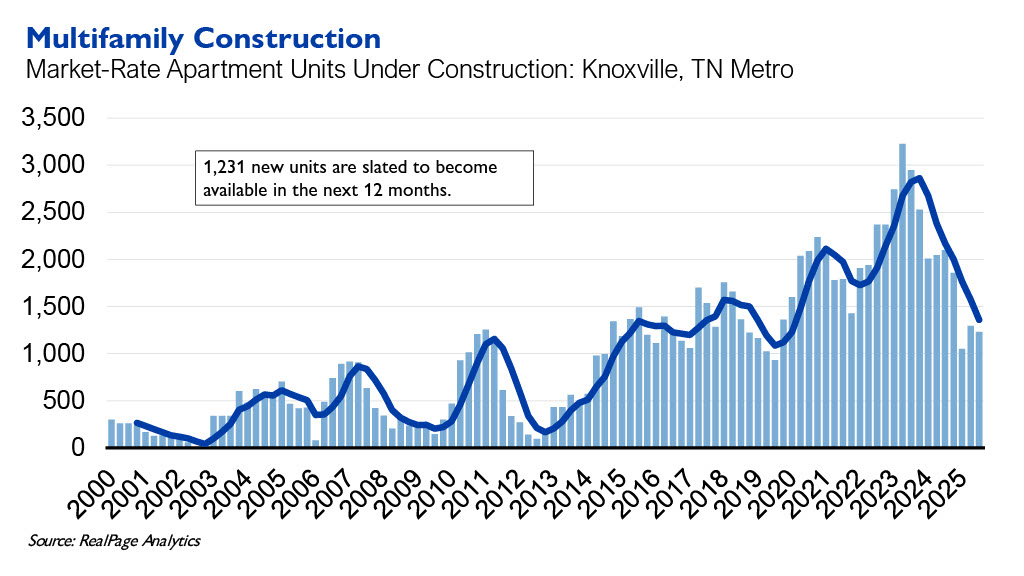
In East Tennessee, trends in rent have closely followed the national market despite the locally varied nature of multifamily supply. A surge in multifamily building between 2022 and 2024 helped keep rent flat, but there are caveats.
First, nearly 2,000 of the units delivered during this period were intended to house incoming students to the University of Tennessee. The additional capacity was quickly filled by the rising enrollment; overall, occupancy in the Knoxville area remained high at 95.6% as of December 2025.
Secondly, the rate of construction began to taper back in late 2024 as labor costs, economic concerns and builder confidence affected starts nationwide. As a result, the Knoxville area has an 800+ unit supply deficit going into 2026 that is based on an annual rate of about 1,500 new units. As of January, only 1,231 units are slated to deliver.
| |
Locally, rent dropped about 1.5% across the region in 2025. Wage growth has begun to catch up slowly, but nearly 60% of renter households are still cost-burdened, meaning they spend more than 30% of their monthly gross income on housing costs.
From 2020-2025, rents increased about 63%, an average addition of $587 per month across all unit types. During that same period, wages increased about 33% - an extraordinarily healthy rate that speaks to our regional economic success, but is still far less than the increase in housing costs. This is also a cumulative increase, meaning that it accounts for some higher-paying job additions, and the individual earner may not have enjoyed such a steep appreciation in income.
The East Tennessee area is breaking even for now, but more multifamily supply is needed to keep rents from rising. Assuming wage growth continues, rent would need to stay flat for 3-5 years to become affordable to the median earner.
| |
Ten years of housing data changes
Hopping on the latest social media trend, NAR took a look back at how 2026 compares to 2016... or 2025 to 2015, since it's always best to look at a full year of data in real estate.
While trends have been dramatic over the past few years, the national market is stable and has improved in many ways.
"One thing is clear: despite ever-evolving challenges posed in the real estate market, buyers and sellers want and are using a real estate agent to buy and sell. Even within a decade, there has been an increase in agent use. In 2015, 89% of sellers and 87% of buyers used an agent during their real estate transaction. In the 2025 Profile of Home Buyers and Sellers, 91% of sellers and 88% of buyers used an agent to buy and sell."
- Dr. Jessica Lautz, Deputy Chief Economist and Vice President of Research for the National Association of REALTORS®
Read the full article here.
| | |
Mortgage Rate Update
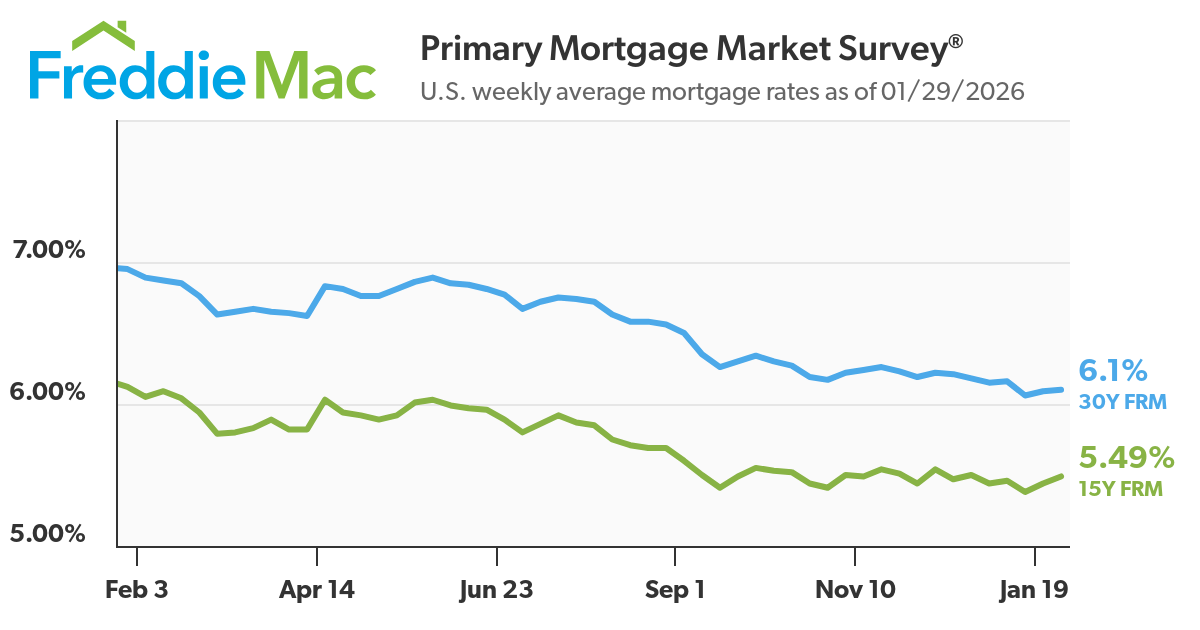
According to Freddie Mac's Primary Mortgage Market Survey, the 30-year fixed mortgage rate (30Y FRM) hovered at 6.10% as of the week ending January 26. This rate is down 0.85 points from one year ago at 6.95%.
| | |
Rates have remained low since the drop to around 6% in early December, moving up and down a few tenths of a percent each week. The market has made small reactions to national news and the federal monetary policy developments, but overall stayed steady.
At the January meeting of the Federal Reserve, the board of governors voted to hold the interest rate steady, as widely expected. Fed Chair Jerome Powell cited economic expansion, a slightly stabilized unemployment rate and a flat rate of job creation. While the Fed is expected to maintain a neutral position for now, the approach could change as the current chair finishes out the last months of his term.
Experts in the mortgage industry anticipate that if there are possible cuts it will be later in the spring of 2026, as early as April, but continue to advise us that this path is already "baked in" to rates. Homebuyers should not expect a big change, and for 30-year fixed rates to stay around 6%.
| | Stay up to date with the most recent information about East Tennessee's housing and real estate market. Here's the latest from local media: | | Market Pulse is a monthly research newsletter providing a rundown of the latest housing and economic research and analysis across East Tennessee. | | Was this email forwarded to you? Subscribe here. | | | | |