Dear Stuart,


Supply in June is up 23.8% year over year in Metro Vancouver which is 43.7% above the 10 year seasonal average while sales were down 25.8% below the 10 year seasonal average. The increase in supply and the decrease in demand are not as drastic as we saw in May so hopefully this is the start of a turnaround in the trend. 2025 has been an unusually weak real estate market and if this momentum shift continues, we may be looking at a more normal market again soon. These Metro Vancouver stats get a lot of press and are distinct from the west side market stats but we are facing similar trends here on the west side.


Westside detached home sales, when compared to the 10-year averages, are down by 23% for detached homes, down 23% for apartments and up by 15% for townhomes.


Compared to the 10-year average, supply is up 15% for Westside detached homes, while apartment supply is up 47%, and townhomes are up 66%.


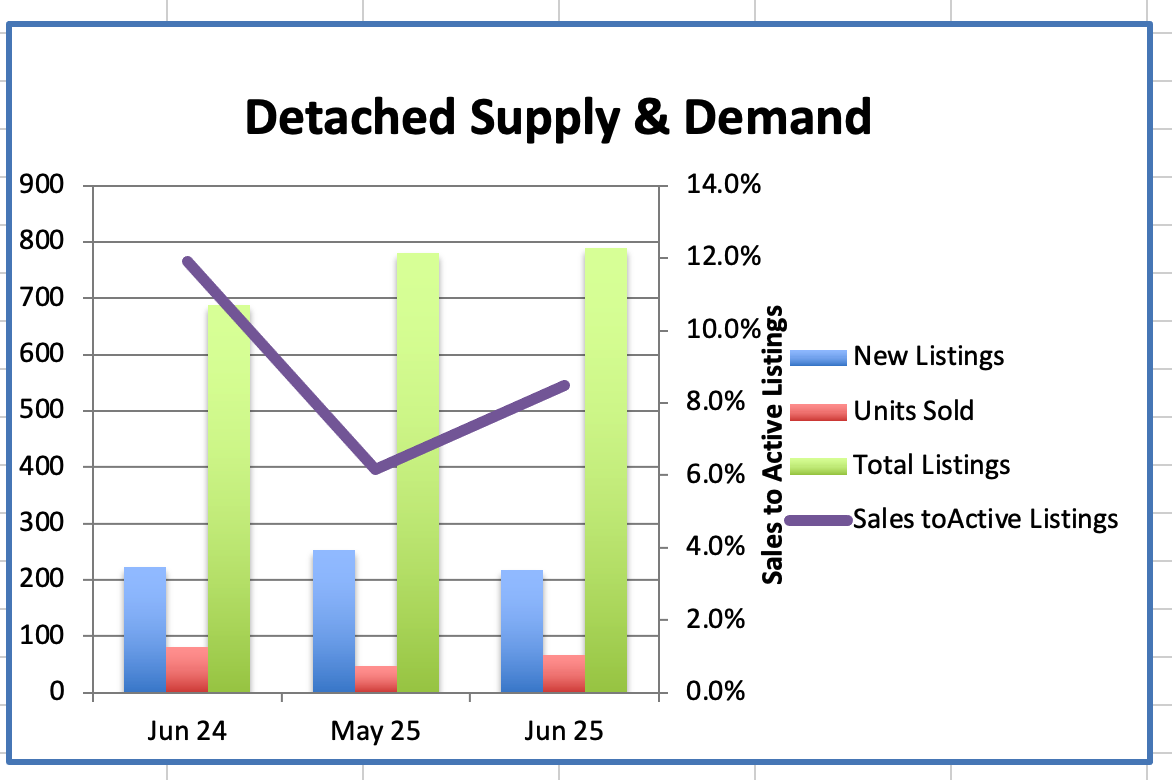
We had 67 Westside Detached home sales in June, compared to 48 sales last month.

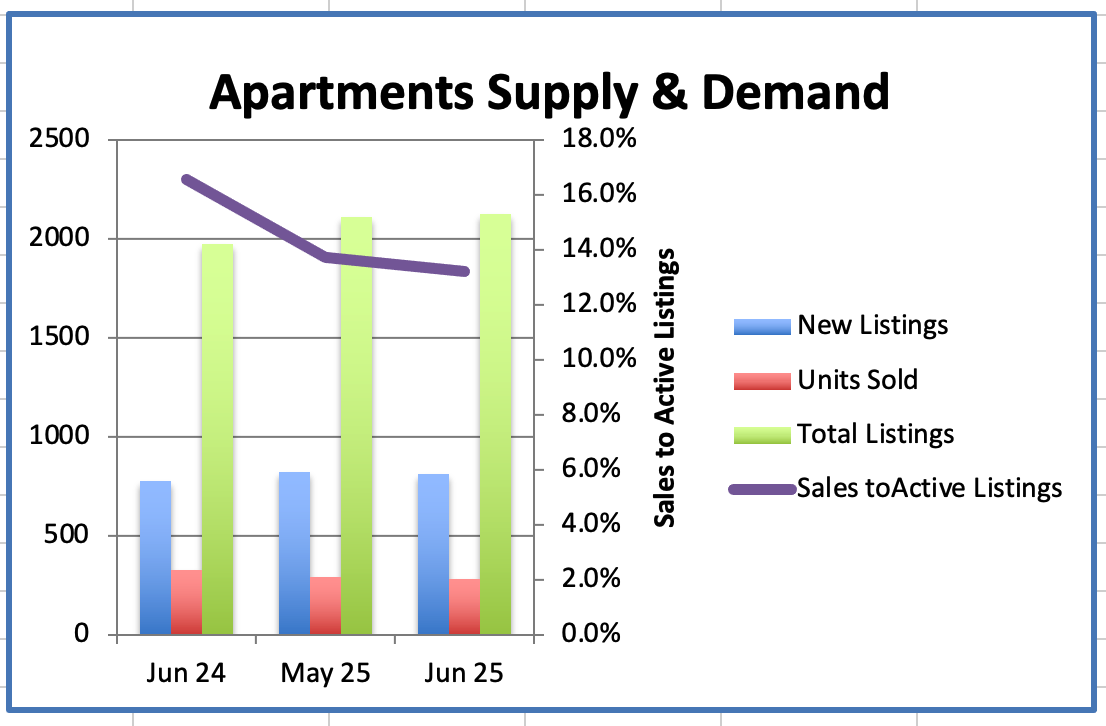
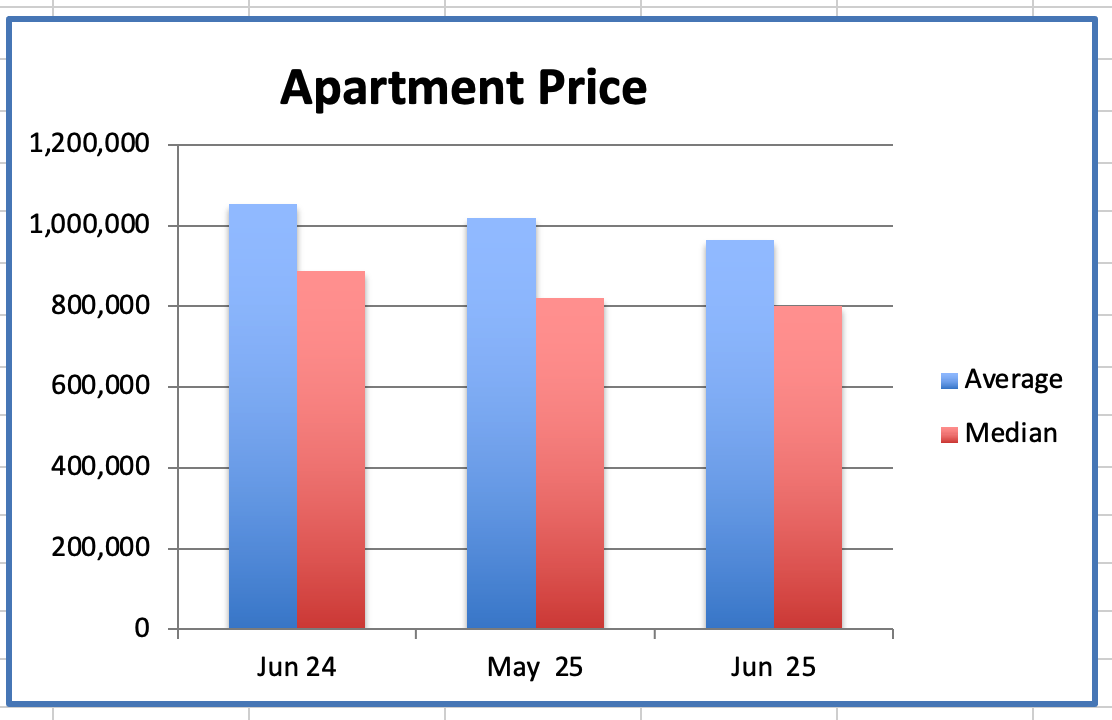
We had 281 Westside Apartment sales in June, compared to 290 sales last month.

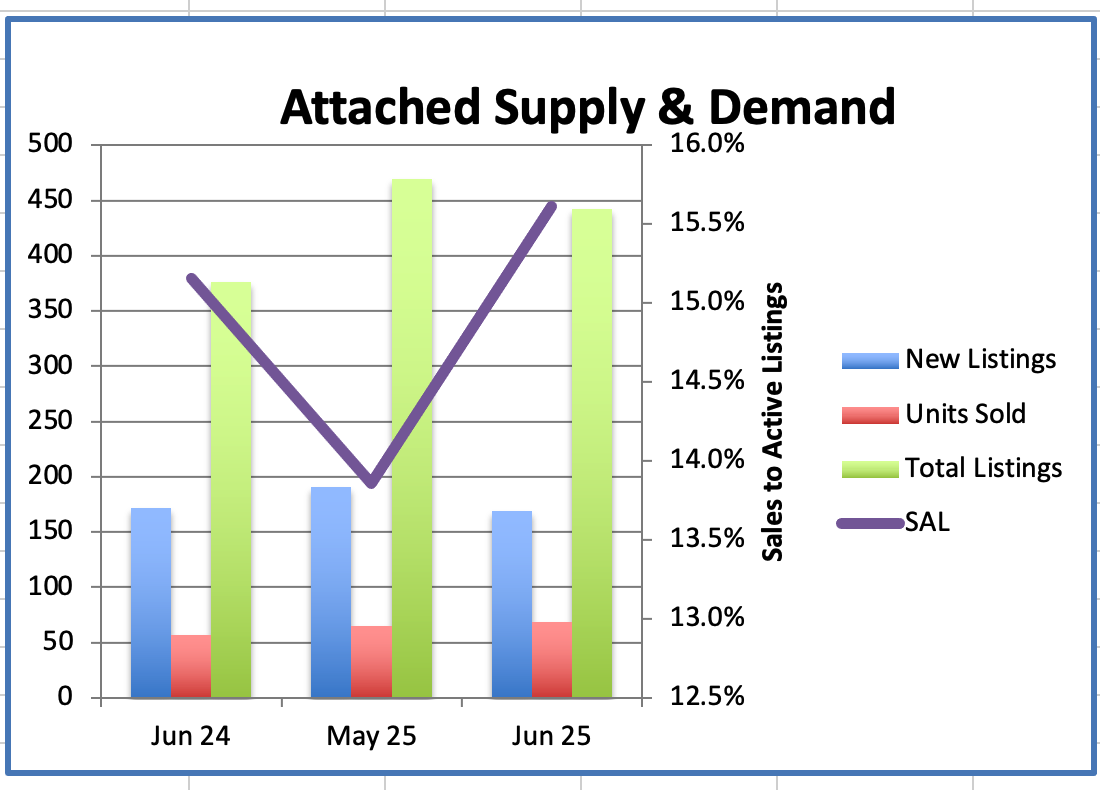
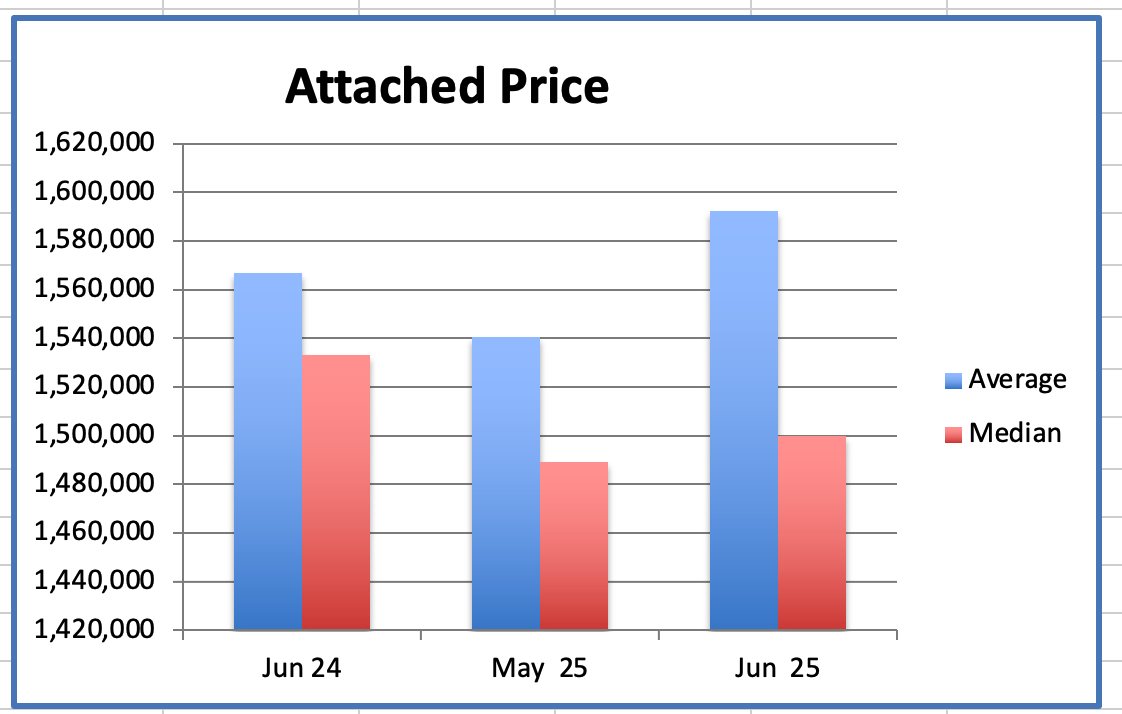
We had 69 Westside Attached home sales in June, compared to 65 sales last month.


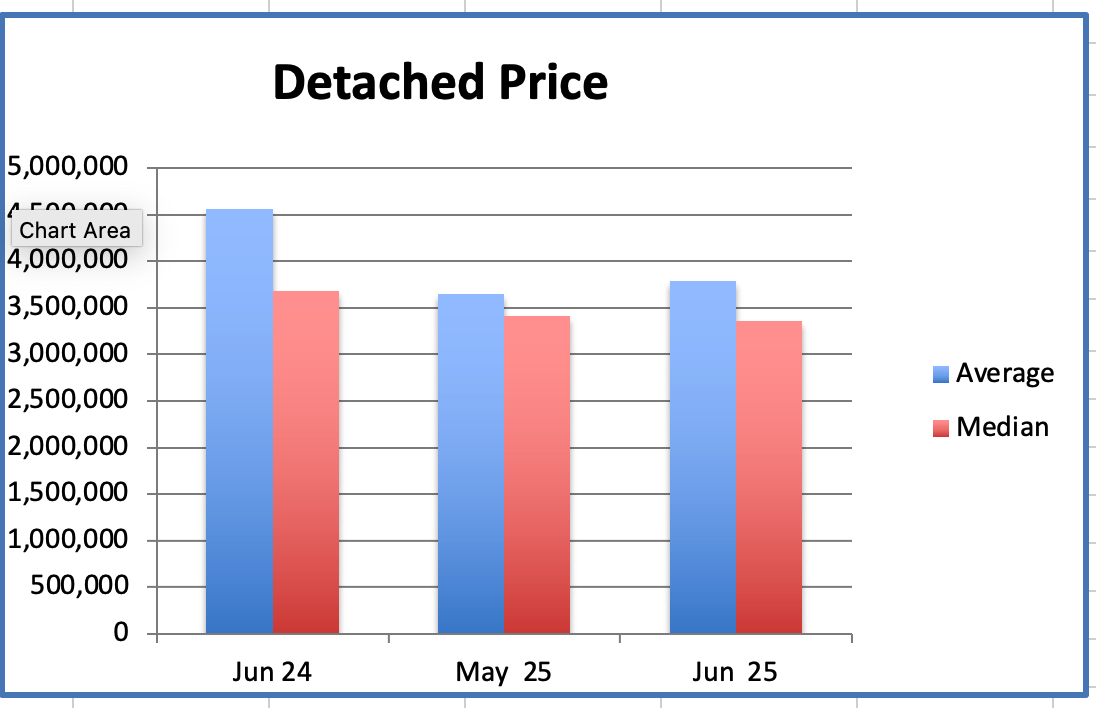
In June, the westside Detached Home average price was down 20% from the peak in August 2023.

The Attached home average price was down 16% from the peak in Dec 2024.

The Apartment average price was down 20% from the peak in January 2018.


The Sales to Active Listings ratio (SAL) is a key indicator of market balance and it helps determine whether the market favours Buyers or Sellers.


Generally, downward pressure on home prices occurs when the ratio dips below 12% for a period of time. Upward pressure on home prices occurs when the ratio surpasses 20% over several months. The range between 12% and 20% is considered a balanced market.


Market conditions are dynamic and can change rapidly due to various economic factors & the ratio can vary significantly depending on the property type.


Currently the SAL for Westside detached is 8.5%, attached is 16% and apartments is 13%.


So demand is up over the last few months for detached homes and town homes. This increased townhouse activity is a product of expanding the multi property zoning that is encouraging builders to make more and larger (3 br) townhomes in previously single family areas. Because they are cheaper than detached single family homes young families can sometimes get a foothold in that market. Demand for these townhomes is driving interest from builders in the land value detached homes so both segments are improving.


These are emerging signs that sales activity may be turning a corner, and the Sales to Active Listings ratio is improving which should help firm up prices. With the substantial current supply, there are buying opportunities and if the market really turns up, buyers will rush in, so now is a good time to buy while we have good supply and little competition


July & August will be prime for a summer rally given our very slow spring, so strategic pricing will be key to sellers achieving best results.


Thinking of Selling? Let’s Talk!


πŸ“ž Call me today to discuss your options and make the most of the upcoming selling season.


Hope you had a great Canada Day! πŸ‡¨πŸ‡¦


Best regards


Stuart β›³ 🎾 πŸ‡¨πŸ‡¦

Detailed information on the Westside detached homes market in June. Here's a summary of the key points:


  • Supply:
  • In June, the supply of Westside detached homes was up slightly 1.3% compared to May, with a total of 790 homes available, up from 780.
  • This is an increase of 22% compared to May 2024 when there were 639 homes on the market.
  • Demand:
  • Sales of Westside detached homes in June were up 40% from May, with 67 homes sold.
  • Sales were down 18% compared to June 2024, which had 82 sales.
  • The number of sales remains 23% lower than the ten-year average of 87 sales.
  • Sales to Active Listings Ratio (SAL):
  • The SAL in June increased by 38% from the previous month, with a current SAL of 8.5% compared to 6.2% in May.
  • This represents a 29% decrease from June 2024.
  • An SAL between 12% to 20% is typically considered a balanced market, where prices tend to remain relatively stable.
  • Pricing:
  • The average detached home price in June decreased 20% and median decreased 21% from August 2023's peak.
  • The average price is $3.784 million, and the median price is $3.36 million.
  • Current prices are up 4% on average and down 1.4% on median from last month.
  • High and Low Sale Prices:
  • Westside detached home sales in June ranged from a low of $1.91 million to a high of $15.18 million. The most expensive property took 465 days to sell, while the least expensive sold in 112 days.
  • Of the 67 homes sold, only 8 sold at or above their asking price, indicating a buyer's market.


These statistics provide a comprehensive overview of the Westside detached homes market in June shedding light on changes in supply, demand, pricing, and notable sale prices.

Detailed information on the Westside apartment market in June. Here's a summary of the key points:

  • Supply:
  • In June, the supply of Westside apartments was up 1% compared to May, with a total of 2,125 apartments available for sale.
  • This number is up by 8% from June 2024.
  • Demand:
  • Demand for Westside apartments decreased by 3% in June with 281 sales compared to 290 sales in May.
  • The number of sales in June was down 14% from the same month last year, which had 327 sales.
  • Apartment sales are down 23% from the ten-year average of 365 sales.
  • Sales to Active Listings (SAL):
  • The SAL in May decreased by 4% compared to May, to 13%.
  • This is an decrease of 20% from the SAL of 17% in June 2024.
  • An SAL between 12% to 20% is typically considered a balanced market, where prices tend to remain relatively stable.
  • Prices:
  • The average price of Westside apartments in June decreased 5% from May, with the average price at $964K
  • It was down 8% from June 2024.
  • The median price was down 2.4% to $800K and is down 9.9% from June 2024.
  • Average prices are down 20% below the peak of $1,199,000 in January 2018, and median prices are 10% below the peak of June 2024.

These statistics provide a comprehensive picture of the Westside apartment market in June, highlighting changes in supply, demand, pricing, and their respective trends over time.

Detailed information on the Westside townhouse market in June. Here's a summary of the key points:

  • Supply:
  • In June, the supply of Westside townhouses decreased by 6% compared to May, with a total of 442 townhouses available for sale.
  • The supply was up 18% from June 2024, which had 376 townhouses on the market.
  • Demand:
  • The demand for townhouses in June increased by 6%, with 69 sales.
  • The number of sales in June increased by 21% from the same month last year, which had 57 sales.
  • Attached home sales are 15% above the ten-year average of 69 sales.
  • Sales to Active Listings (SAL):
  • With the decrease in supply and increase in demand, the current SAL for townhouses increased by 13%, to 15.6%
  • This is 3% higher than the SAL of 15.2% in June 2024.
  • An SAL between 12% to 20% is typically considered a balanced market, where prices tend to remain relatively stable.
  • Prices:
  • The average price of townhouses in June was $1.59 million, up 3.4% from May.
  • It was up 1.6% from June 2024 when the average price was $1.57 million.
  • The median price in June was relatively unchanged at $1.5 million, a .7% increase from May ($1.489 million), and down 2% from June 2024.
  • Average prices for townhouses are down 16% from its peak. Median prices down 19% from its peak. The average peak of $1.885 million in Dec 2024, and the median peak of $1.855 million in Dec 2024.


These statistics provide a comprehensive overview of the Westside townhouse market in June, indicating changes in supply, demand, pricing, and their respective trends over time.

Facebook  Twitter  Linkedin