August 2025 - Investment Newsletter

KEY TAKEAWAYS

>>  Q2 2025 real U.S. GDP growth was revised up 0.3% to 3.3% in the most recent Bureau of Economic Analysis estimate, marking a sharp rebound from the –0.5% contraction in Q1.

>> The rebound in Q2 was driven by strong consumer spending, a downturn in imports, and a surge in business investment, especially in artificial intelligence infrastructure.

>> Real final sales to private domestic purchasers, a key measure watched by the Federal Reserve that strips out trade distortions by measuring sales of domestically produced goods and services to domestic households and businesses, was revised up to 1.9%, significantly above the previous estimate of 1.2%, indicating robust core domestic demand despite tariff turbulence.

>>  Another weak jobs report showed the U.S. economy added only 22,000 jobs and unemployment ticked higher from 4.2 to 4.3% in August, as initial jobless claims hit a three-month high and job seekers have started to outnumber openings.

  • Despite goods prices moderating, core PCE increased by 0.3% in July and 2.9% year-over-year driven by services prices jumping 3.6%. The headline figures, which include food and energy, came in at 0.2% and 2.6%, respectively.


  • August ISM Manufacturing PMI showed that U.S. factory activity remained in contraction territory for a sixth straight month, though there were a few positives in the report like new orders expanding for the first time in 2025.


  • Despite dipping to start the month, U.S. equities had a strong August with the S&P 500 returning 2.0% and the Russell 2000 surging 7.1% as expectations of a September interest rate cut acted as a stronger tailwind for more rate-sensitive small-cap stocks.


  • Internationally, developed market (+4.3%) and emerging market equities (+1.5%) were also additive to portfolios and continue to meaningfully outpace domestic stocks year-to-date.


  • A weakening U.S. dollar continues to be a significant tailwind for international stocks as the greenback remains down over 9.0% in 2025 after falling ~1.5% in August, effectively erasing the gains from its July bounce.


  • Within fixed income, core bond returns were modestly positive in August as Treasury yields drifted lower into month‑end, with the yield on 10-year Treasuries falling from ~4.37% to ~4.23%, supporting duration‑sensitive sectors.


  • Municipal bonds finished slightly positive, weighed down by increased supply and fiscal uncertainties, which led to weaker technicals and underperformance versus taxable fixed income.


  • The FOMC will meet on September 16–17 to review policy rates with markets closely watching. While the data-dependent FOMC would prefer to see inflation cooling before lowering interest rates, Fed Chair Powell’s focus has recently shifted to the labor market, and the August data cemented market expectations for a 0.25% cut following the meeting.


  • Regardless of the outcome, volatility may persist in coming months and investors are typically best served by aligning portfolios with overall risk tolerance and long-term financial goals while ensuring proper diversification both within and across asset classes.

Asset Class Performance as of 8/31/2025

ECONOMY

Inflation Remains Sticky Heading into FOMC


  • Core PCE inflation matched consensus expectations and came in at 2.9% in July, up from 2.8% in June, marking its highest level since February.


  • The headline figure registered at 2.6% year-over-year with services prices jumping 3.6%, far outpacing the 0.5% increase in goods. Energy declined 2.7% while food prices rose 1.9% year-over-year.


  • Despite inflation remaining sticky, consumer spending increased 0.5% and personal income accelerated 0.4% in July, signaling resilient demand.


  • While the data-dependent FOMC would prefer to see inflation trending downward before lowering interest rates, softening employment is now more likely to determine their timing.

Core & Headline PCE - YoY

Labor Market Weakness Continues


  • After the July jobs report showed tepid growth and major downward revisions to the previously released May and June figures, nonfarm payrolls increased by only 22,000 in August, highlighting U.S. labor market weakness heading into the September FOMC meeting.


  • Unemployment also ticked higher, from 4.2% in July to 4.3% in August, as initial jobless claims hit a three-month high and, for the first time in four years, the number of available jobs is lower than the number of job seekers.


  • In recent public statements, Chair Powell has noted that the Fed’s focus has shifted from inflation to the labor market, and the August data solidified expectations for a 0.25% cut following the September FOMC meeting.

Total Nonfarm Payroll Jobs Added & Unemployment

Sentiment Falls After Early Summer Uptick


  • According to the University of Michigan, the consumer sentiment index fell from 61.7 in July to 58.2 in August, hitting a three-month low as tariff-related concerns over inflation and the global economic outlook persisted.


  • Consumers expect prices to rise at an annual rate of 4.8% over the next year, up from 4.5% in July.


  • Expectations for inflation over the next five to 10 years now sits at 3.5% annualized, which is well above the Fed’s 2.0% target but meaningfully below the 4.4% expected back in April when President Trump first proposed reciprocal tariffs.


  • Roughly 63% of respondents expect unemployment to rise in the year ahead, while expectations for overall business conditions also deteriorated despite forecasts for personal finances remaining mostly stable.


University of Michigan Consumer Sentiment

Index & 5-year Inflation Expectations

MARKETS

Sector Rotation Within U.S. Equities


  • After leading the V-shaped recovery from April lows, information technology, communication services, and consumer discretionary stocks have slowed down in Q3.


  • With valuations in those sectors becoming stretched, some investors feel lower future rates have already been priced into growth and artificial intelligence names.


  • As such, materials, healthcare, and energy led in August, illustrating a healthy rotation into overlooked corners of the market that may also benefit from lower rates.


  • Despite solid year-to-date performance, the S&P 500 (+10.8%) is still lagging its developed (+23.3%) and emerging market counterparts (+19.6%), further demonstrating the need for proper geographic diversification within an equity portfolio.


Major Index Performance - Total Return

Duration Assets Rally, Spreads Remain Tight


  • Treasury yields declined into month-end, with the 10-year falling from ~4.37% to ~4.23%, creating a tailwind for duration-sensitive sectors like Treasuries and investment-grade bonds. The curve steepened slightly as front-end yields also eased.


  • Supported by the rates rally, investment-grade and high-yield corporates posted positive returns, though upside was capped by the already tight spreads.


  • Investment-grade spreads held near cycle tights at ~0.68%, while high-yield spreads tightened modestly to ~2.5%, reflecting strong risk appetite and benign default expectations.


  • Limited room for further tightening suggests future returns may rely on income generation as downside risks from tariffs and global uncertainty persist.

Credit Spreads

REITs Rebound in August


  • Rates drifting lower and expectations of a rate cut following the FOMC’s September meeting supported longer-duration cash flows leading to a strong August for real estate, though many subsectors remain in negative territory year-to-date.


  • Results have been uneven at the sector level, with rate sensitivity remaining the dominant performance driver.


  • The retail sector has remained resilient, supported by steady consumer demand, and remains one of the few bright spots for the year.


  • Residential, lodging/resort, and office got a boost from falling rates, but are still negative year-to-date as weak fundamentals and low occupancy remain headwinds.

FTSE NAREIT Sector Performance

DISCLOSURES

Compliance Code: 8362062.1


This commentary was authored by the investment team at Summit Financial, LLC., an SEC Registered Investment Adviser (“Summit”), headquartered at 4 Campus Drive, Parsippany, NJ 07054, Tel. 973-285-3600. It is provided for your information and guidance and is not intended as specific advice and does not constitute an offer to sell securities. Summit is an investment adviser and offers asset management and financial planning services. Indices are unmanaged and cannot be invested into directly.


Data in this newsletter is obtained from sources which we, and our suppliers believe to be reliable, but we do not warrant or guarantee the timeliness or accuracy of this information. Consult your financial professional before making any investment decision. Past performance is no guarantee of future results. Diversification/asset allocation does not ensure a profit or guarantee against a loss. Economic and market forecasts presented herein reflect our judgment as of the date of this presentation and are subject to change without notice. Any forecasts are subject to high levels of uncertainty that may affect actual performance. Accordingly, forecasts should be viewed as merely representative of a broad range of possible outcomes. Forecasts are estimated, based on assumptions, and are subject to significant revision and may change materially as economic and market conditions change. Forecasts do not take into account the specific investment objectives, restrictions, tax and financial situation or other needs of any specific client.
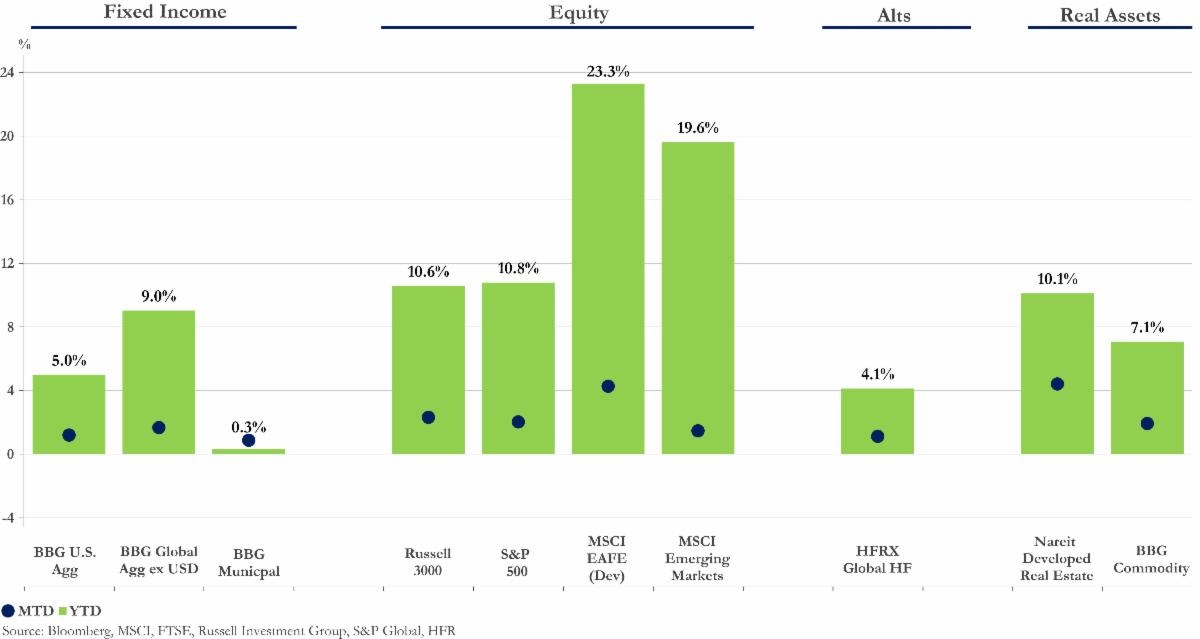

BBG U.S. Agg

Bloomberg U.S. Aggregate Bond Index

The Bloomberg U.S. Aggregate Bond Index is a broad-based flagship benchmark that measures the investment grade, U.S. dollar-denominated, fixed- rate taxable bond market. The index includes Treasuries, government-related and corporate securities, MBS (agency fixed-rate pass-throughs), ABS, and CMBS (agency and non-agency).


BBG Global Agg ex USD

Bloomberg Global Aggregate Index

The Bloomberg Global Aggregate Index is a flagship measure of global investment grade debt from twenty-four local currency markets. This multi- currency benchmark includes Treasury, government-related, corporate, and securitized fixed-rate bonds from both developed and emerging markets issuers.


BBG Municipal

Bloomberg Municipal Bond Index

The Bloomberg Municipal Bond Index covers the U.S. dollar-denominated long-term tax-exempt bond market. The index has four main sectors: state and local general obligation bonds, revenue bonds, insured bonds, and pre-refunded bonds.


Russell 3000

Russell 3000 Index

The Russell 3000 Index measures the performance of the largest 3,000 U.S. companies representing approximately 98% of the investable U.S. equity market. It is constructed to provide a comprehensive, unbiased, and stable barometer of the broad market and is completely reconstituted annually to ensure new and growing equities are included.


Russell 2000

Russell 2000 Index

The Russell 2000 Index measures the performance of the small-cap segment of the U.S. equity universe. It is a subset of the Russell 3000 Index repre- senting approximately 10% of the total market capitalization of that index. It includes approximately 2,000 of the smallest securities based on a combi- nation of their market cap and current index membership.


S&P 500

S&P 500 Index

The S&P 500 Index is a market capitalization-weighted index of 500 widely held stocks often used as a proxy for the stock market. It measures the movement of the largest issues. Standard and Poor’s chooses the member companies for the 500 based on market size, liquidity, and industry group representation. Included are the stocks of eleven different sectors.


MSCI EAFE (Dev)

MSCI EAFE Index

The MSCI EAFE Index (Europe, Australasia, Far East) captures large- and mid-cap representation across developed markets countries around the world, excluding the U.S. and Canada. The index covers approximately 85% of the free float-adjusted market capitalization in each country.


MSCI Emerging Markets

MSCI Emerging Markets Index

The MSCI Emerging Markets Index captures large- and mid-cap representation across emerging markets countries across the world. The index covers approximately 85% of the free float-adjusted market capitalization in each country.


 HFRX Global HF 

HFRX Global Hedge Fund Index

The HFRX Global Hedge Fund Index is comprised of funds representing the overall hedge fund universe. Constituent funds include but are not limited to convertible arbitrage, distressed securities, equity hedge, equity market neutral, event-driven, macro, merger arbitrage, and relative value arbitrage. The underlying strategies are asset-weighted based on the distribution of assets in the hedge fund industry.


Nareit Developed Real Estate

FTSE EPRA/NAREIT Developed Index

The FTSE EPRA/NAREIT Developed Index is designed to track the performance of listed real estate companies and REITS worldwide. Index constituents are free float-adjusted, subject to liquidity, size, and revenue screening for inclusion.


BBG Commodity

Bloomberg Commodity Index

The Bloomberg Commodity Index reflects commodity futures price movements and is calculated on an excess return basis. The index rebalances annually weighted 2/3 by trading volume and 1/3 by world production, and weight-caps are applied at the commodity, sector, and group level for diversification. The roll period typically occurs from the 6th-10th business day based on the roll schedule.


Consumer Confidence Index

Conference Board Consumer Confidence Index

The Consumer Confidence Index is a measure based on a survey administered by The Conference Board that reflects prevailing business conditions and likely developments for the months ahead. This monthly report details consumer attitude, buying intentions, vacation plans, and consumer expectations for inflation, stock prices, and interest rates.


U.S. Dollar Index (DXY)

U.S. Dollar Index (DXY)

The U.S. Dollar Index (DXY) is an index of the value of the United States dollar relative to a basket of foreign currencies, often referred to as a basket of U.S. trade partners' currencies. The Index goes up when the U.S. dollar gains "strength" (value) when compared to other currencies.


DJIA

Dow Jones Industrial Average

The Dow Jones Industrial Average (DJIA), commonly known as “The Dow”, is a price-weighted measure of 30 U.S. blue-chip companies. The index covers all industries except transportation and utilities.


ISM Manufacturing Index

ISM Manufacturing Index

The ISM Manufacturing Index, also known as the purchasing managers’ index (PMI), is a monthly indicator of U.S. economic activity based on a survey of executives covering all North American Industry Classification System’s businesses in the manufacturing sector.


ISM Non-Manufacturing Index

ISM Non-Manufacturing Index

The ISM Non-Manufacturing Index is a monthly indicator of U.S. economic activity based on a survey of executives covering all North American Industry Classification System’s businesses in the services (or non-manufacturing) sector.


QUESTIONS?

Our Wealth Management team is ready to answer your questions and help you prepare for your future with a suite of planning solutions focused on you.

View as Webpage

6135 Memorial Drive Suite 103, Dublin, OH 43017 | 614.380.3800