|
U.S. Agg
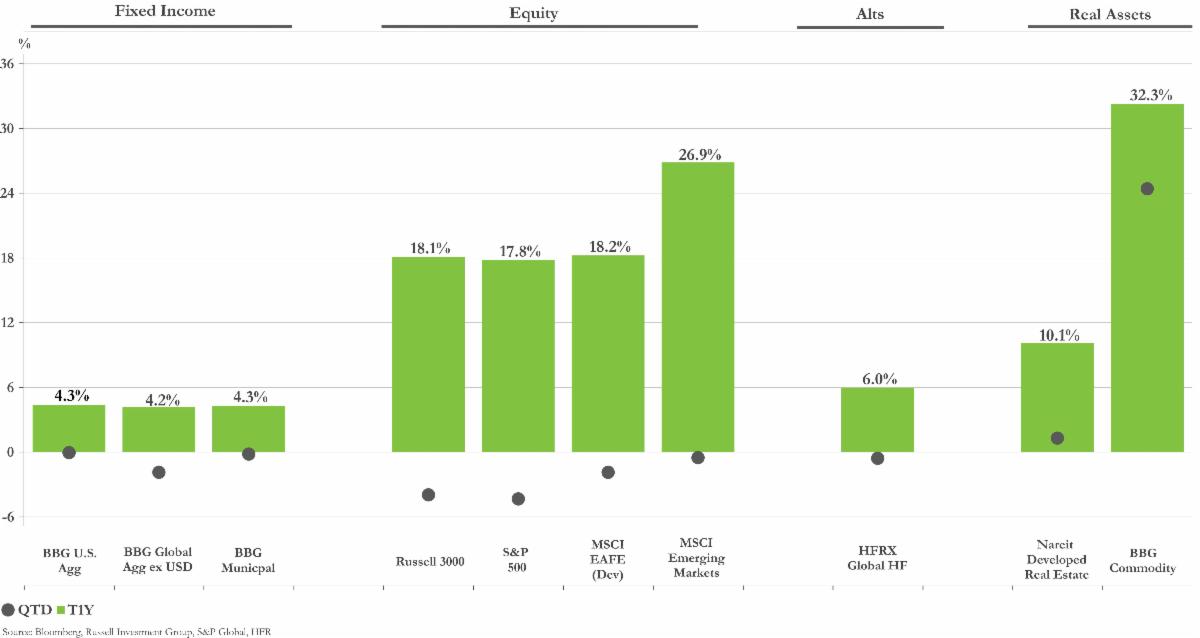
Bloomberg U.S. Aggregate Bond Index
The Bloomberg U.S. Aggregate Bond Index is a broad-based flagship benchmark that measures the investment grade, U.S. dollar-denominated, fixed-rate taxable bond market. The index includes Treasuries, government-related and corporate securities, MBS (agency fixed-rate pass-throughs), ABS, and CMBS (agency and non-agency).
Global Agg ex USD
Bloomberg Global Aggre- gate Index
The Bloomberg Global Aggregate Index is a flagship measure of global investment grade debt from twenty-four local currency markets. This multi-currency benchmark includes Treasury, government-related, corporate, and securitized fixed-rate bonds from both developed and emerging markets issuers.
Municipal
Bloomberg Municipal Bond Index
The Bloomberg Municipal Bond Index covers the U.S. dollar-denominated long-term tax-exempt bond market. The index has four main sectors: state and local general obligation bonds, revenue bonds, insured bonds, and pre-refunded bonds.
Russell 3000
Russell 3000 Index
The Russell 3000 Index measures the performance of the largest 3,000 U.S. companies representing approximately 98% of the investable U.S. equity market. It
is constructed to provide a comprehensive, unbiased, and stable barometer of the broad market and is completely reconstituted annually to ensure new and
growing equities are included.
S&P 500
S&P 500 Index
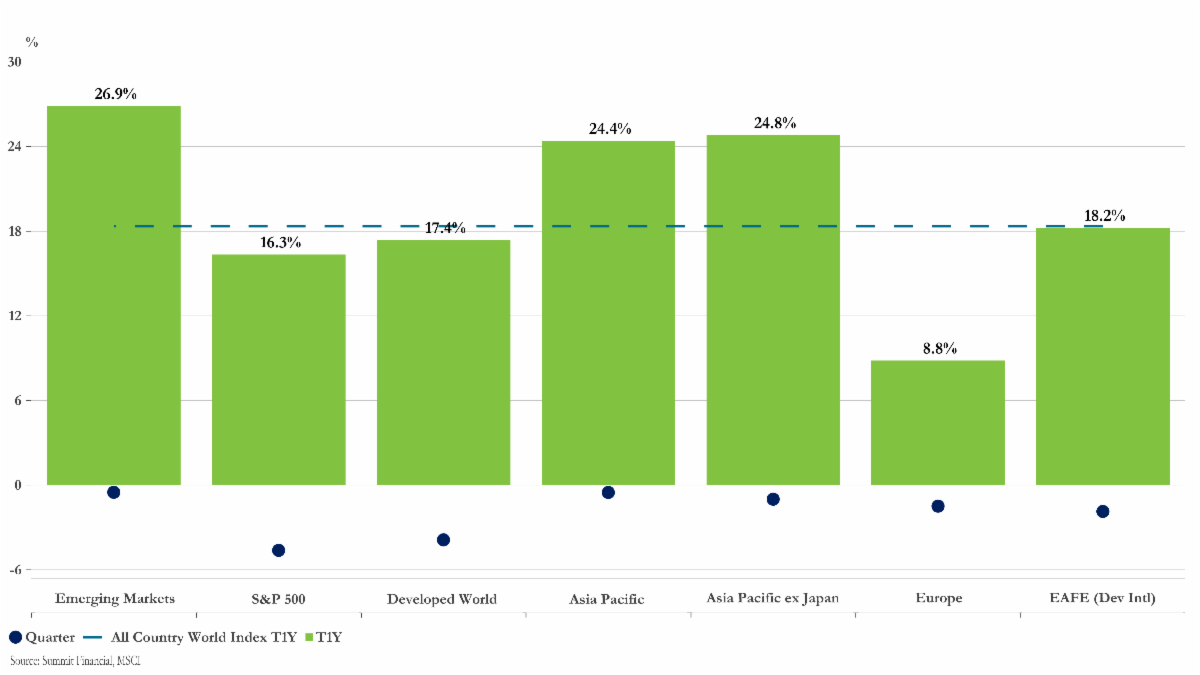
The S&P 500 Index is a market capitalization-weighted index of 500 widely held stocks often used as a proxy for the stock market. It measures the movement of the largest issues. Standard and Poor’s chooses the member companies for the 500 based on market size, liquidity, and industry group representation. In-
cluded are the stocks of eleven different sectors.
MSCI EAFE (Dev)
MSCI EAFE Index
The MSCI EAFE Index (Europe, Australasia, Far East) captures large- and mid-cap representation across developed markets countries around the world, excluding the U.S. and Canada. The index covers approximately 85% of the free float-adjusted market capitalization in each country.
MSCI Emerging Markets
MSCI Emerging Markets Index
The MSCI Emerging Markets Index captures large- and mid-cap representation across emerging markets countries across the world. The index covers approxi- mately 85% of the free float-adjusted market capitalization in each country.
HFRI FoF Comp.
HFRI Fund of Funds Composite Index
The HFRI Fund of Funds Composite Index is an equally weighted hedge fund of funds benchmark composed of global constituent funds. The underlying constituents are typically diversified among multiple managers and styles to provide a comprehensive representation of the hedge fund of funds investment
space.
Nareit Developed Real Estate
FTSE EPRA/NAREIT
Developed Index
The FTSE EPRA/NAREIT Developed Index is designed to track the performance of listed real estate companies and REITS worldwide. Index constituents are free float-adjusted, subject to liquidity, size, and revenue screening for inclusion.
BBG Commodity
Bloomberg Commodity Index
The Bloomberg Commodity Index reflects commodity futures price movements and is calculated on an excess return basis. The index rebalances annually weighted 2/3 by trading volume and 1/3 by world production, and weight-caps are applied at the commodity, sector, and group level for diversification. The roll period typically occurs from the 6th-10th business day based on the roll schedule.
Developed World
MSCI World Index
The MSCI World Index captures large- and mid-cap representation across developed markets countries. The index covers approximately 85% of the free float- adjusted market capitalization in each country.
Asia Pacific
MSCI AC Asia Pacific Index
The MSCI AC Asia Pacific Index captures large and mid cap representation across 5 Developed Markets countries and 8 Emerging Markets countries in the Asia Pacific region. With 1,537 constituents, the index covers approximately 85% of the free float-adjusted market capitalization in each country.
Asia Pacific ex Japan
MSCI AC Asia Pac ex. Japan
The MSCI AC Asia Pacific ex Japan Index captures large and mid cap representation across 4 of 5 Developed Markets countries (excluding Japan) and 9 Emerging Markets countries in the Asia Pacific region. With 1,312 constituents, the index covers approximately 85% of the free float-adjusted market capitalization in each country.
Europe
MSCI Europe Index
The MSCI Europe Index captures large- and mid-cap representation across developed markets countries in Europe. The index covers approximately 85% of the free float-adjusted market capitalization across the European developed markets equity universe.
Comm. Services
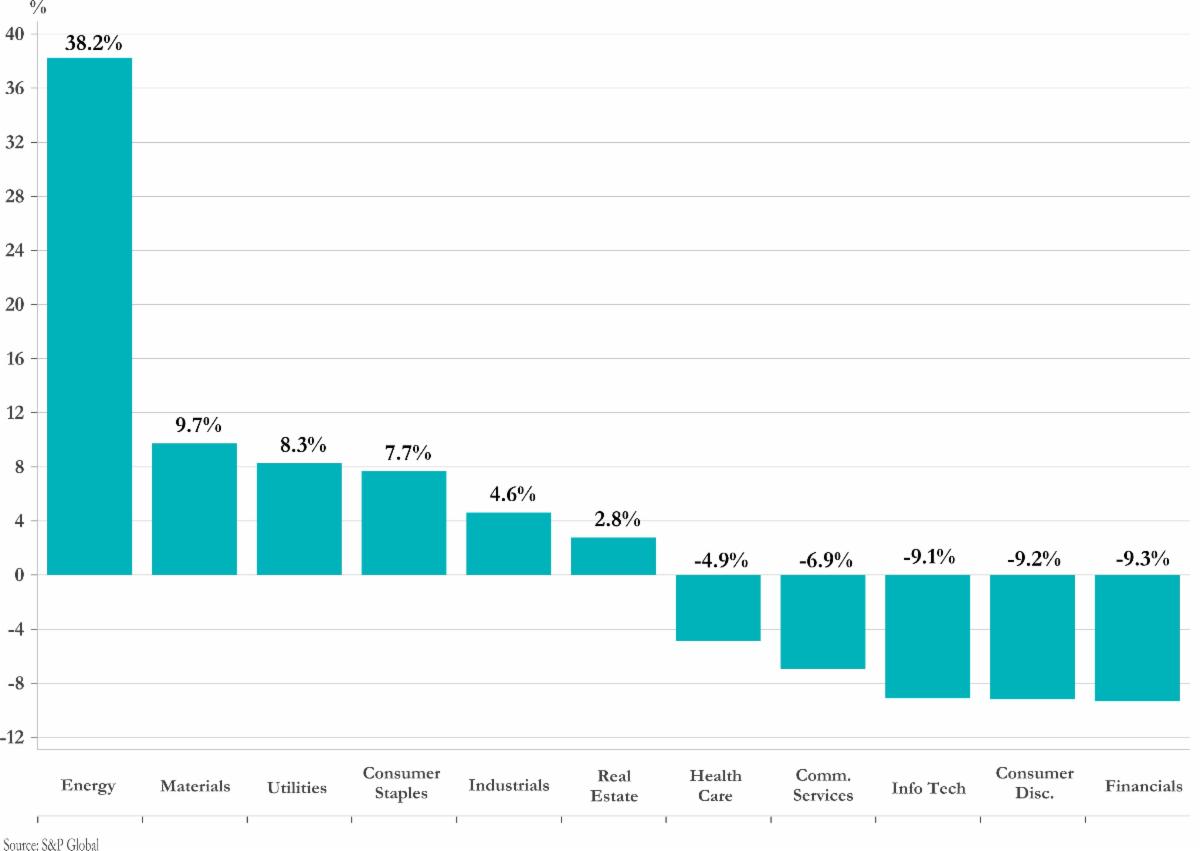
S&P 500 Communication Services
The S&P 500® Communication Services comprises those companies included in the S&P 500 that are classified as members of the GICS® communication services sector.
Info Tech
S&P 500 Information Technology
The S&P 500® Information Technology comprises those companies included in the S&P 500 that are classified as members of the GICS® information technology sector.
Consumer Disc.
S&P 500 Consumer Discretionary
The S&P 500® Consumer Discretionary comprises those companies included in the S&P 500 that are classified as members of the GICS® Consumer Discretionary sector.
Industrials
S&P 500 Industrials
The S&P 500® Industrials comprises those companies included in the S&P 500 that are classified as members of the GICS® industrials sector.
Materials
S&P 500 Materials
The S&P 500® Materials comprises those companies included in the S&P 500 that are classified as members of the GICS® materials sector.
Energy
S&P 500 Energy
The S&P 500® Energy comprises those companies included in the S&P 500 that are classified as members of the GICS® energy sector.
Real Estate
S&P 500 Real Estate
The S&P 500® Real Estate comprises those companies included in the S&P 500 that are classified as members of the GICS® Real Estate sector.
Financials
S&P 500 Financials
The S&P 500® Financials comprises those companies included in the S&P 500 that are classified as members of the GICS® financials sector.
Consumer Staples
S&P 500 Consumer Staples
The S&P 500® Consumer Staples comprises those companies included in the S&P 500 that are classified as members of the GICS® consumer staples sector.
Health Care
S&P 500 Health Care
The S&P 500® Health Care comprises those companies included in the S&P 500 that are classified as members of the GICS® health care sector.
Utilities
S&P 500 Utilities
The S&P 500® Utilities comprises those companies included in the S&P 500 that are classified as members of the GICS® utilities sector.
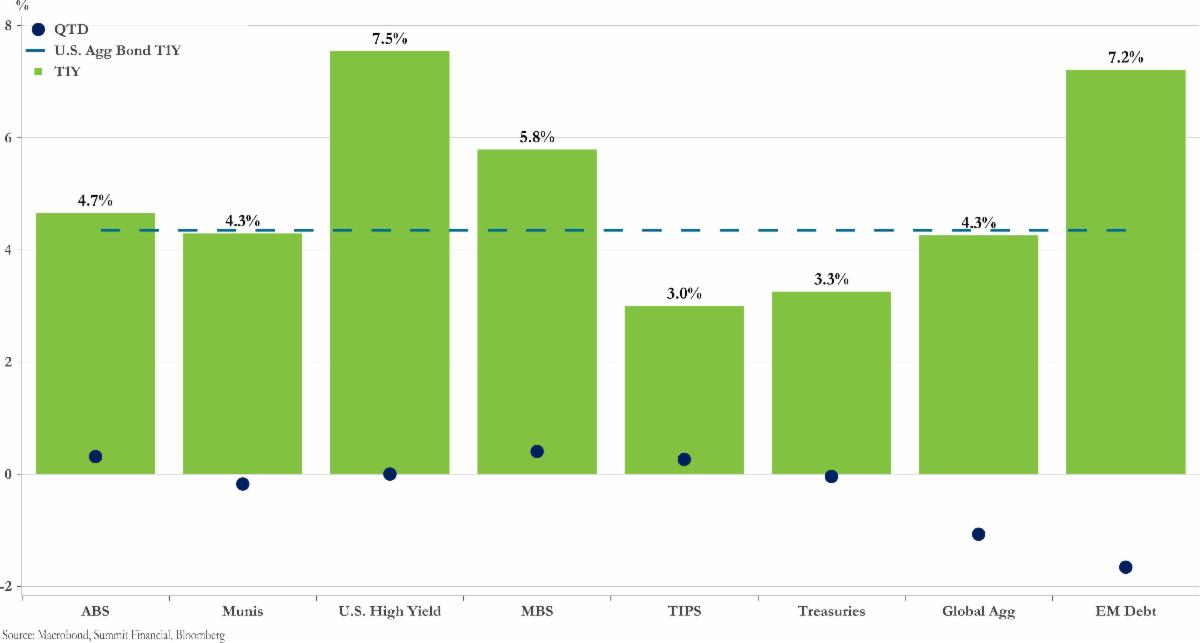
ABS
Bloomberg US Asset- Backed Securities Index
The Bloomberg US ABS Index is a broad-based flagship benchmark that measures the investment grade, US dollar-denominated, fixed-rate taxable bond market. The index only includes ABS securities.
U.S. High Yield
Bloomberg U.S. Corporate High-Yield Index
The Bloomberg U.S. Corporate High-Yield Index measures the U.S. dollar-denominated, high yield, fixed-rate corporate bond market. Securities are classified as high yield if the middle rating of Moody’s, Fitch, and S&P is Ba1/BB+/BB+ or below. Bonds from issuers with an emerging markets country of risk, based
on Barclays EM country definition, are excluded.
MBS
Bloomberg U.S. Mortgage- Backed Securities Index
The Bloomberg Mortgage-Backed Securities Index tracks fixed-rate agency mortgage-backed pass-through securities guaranteed by Ginnie Mae (GNMA), Fannie Mae (FNMA), and Freddie Mac (FHLMC). The index is constructed by grouping individual TBA-deliverable MBS pools into aggregates or generics
based on program, coupon, and vintage.
TIPS
Bloomberg U.S. Treasury Inflation Notes 1-10 Year Index
The Bloomberg U.S. Treasury Inflation Notes 1-10 Year Index measures the performance of the U.S. Treasury Inflation-Protected Securities (TIPS) market with less than 10 years to maturity. TIPS are inflation-protected bonds (IPBs) that are issued by the U.S. Treasury. Their face value is pegged to the CPI and adjusted in step with changes in the rate of inflation.
Treasuries
Bloomberg U.S. Treasury Index
The Bloomberg U.S. Treasury Index measures U.S. dollar-denominated, fixed-rate, nominal debt issued by the U.S. Treasury. Treasury bills are excluded by the maturity constraint but are part of a separate Short Treasury Index. STRIPS are excluded from the index because their inclusion would result in double- counting.
EM Debt
Bloomberg Emerging Markets Tradeable Debt
Index: Total Return
This index measures the performance of emerging market debt on a total return basis
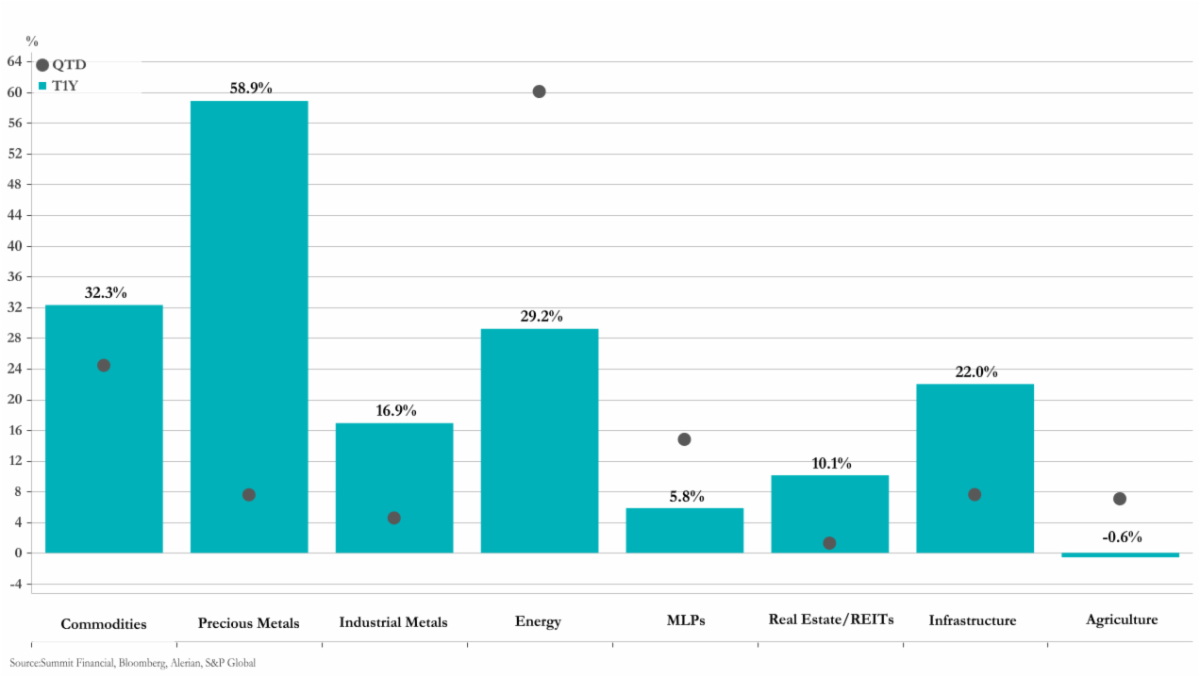
Precious Metals
Bloomberg Precious Metals Subindex
Formerly known as Dow Jones-UBS Precious Metals Subindex (DJUBSPR), the index is a commodity group subindex of the Bloomberg CI. It is composed of futures contracts on gold and silver. It reflects the return of underlying commodity futures price movements only and is quoted in USD.
Industrial Metals
Bloomberg Industrial Metals Subindex
Formerly known as Dow Jones-UBS Industrial Metals Subindex (DJUBSIN), the index is composed of futures contracts on aluminum, copper, nickel and zinc. It reflects the return of underlying commodity futures price movements only. It is quoted in USD.
Energy
Bloomberg Energy Subin- dex
Formerly known as Dow Jones-UBS Energy Subindex (DJUBSEN), the index is a commodity group subindex of the Bloomberg CI. It is composed of futures contracts on crude oil, heating oil, unleaded gasoline and natural gas. It reflects the return of underlying commodity futures price movements only and is quoted in USD.
MLPs
Alerian MLP Index
The Alerian MLP Index is a float-adjusted, capitalization-weighted index whose constituents earn most of their cash flow from midstream activities involving energy commodities. It tracks energy infrastructure Master Limited Partnerships (MLPs).
Real Estate/REITs
FTSE EPRA/NAREIT
Developed Index
The FTSE EPRA/NAREIT Developed Index is designed to track the performance of listed real estate companies and REITS worldwide. Index constituents are free float-adjusted, subject to liquidity, size, and revenue screening for inclusion.
Infrastructure
S&P Global Infrastructure Index
The S&P Global Infrastructure Index is designed to track 75 companies from around the world chosen to represent the listed infrastructure industry while maintaining liquidity and tradability. To create diversified exposure, the index includes three distinct infrastructure clusters: energy, transportation, and utilities.
Agriculture
Bloomberg Agriculture Subindex
Formerly known as Dow Jones-UBS Agriculture Subindex (DJUBSAG), the index is a commodity group subindex of the Bloomberg CI. It is composed of futures contracts on coffee, corn, cotton, soybeans, soybean oil, soybean meal, sugar and wheat. It reflects the return of underlying commodity futures price movements only and is quoted in USD.
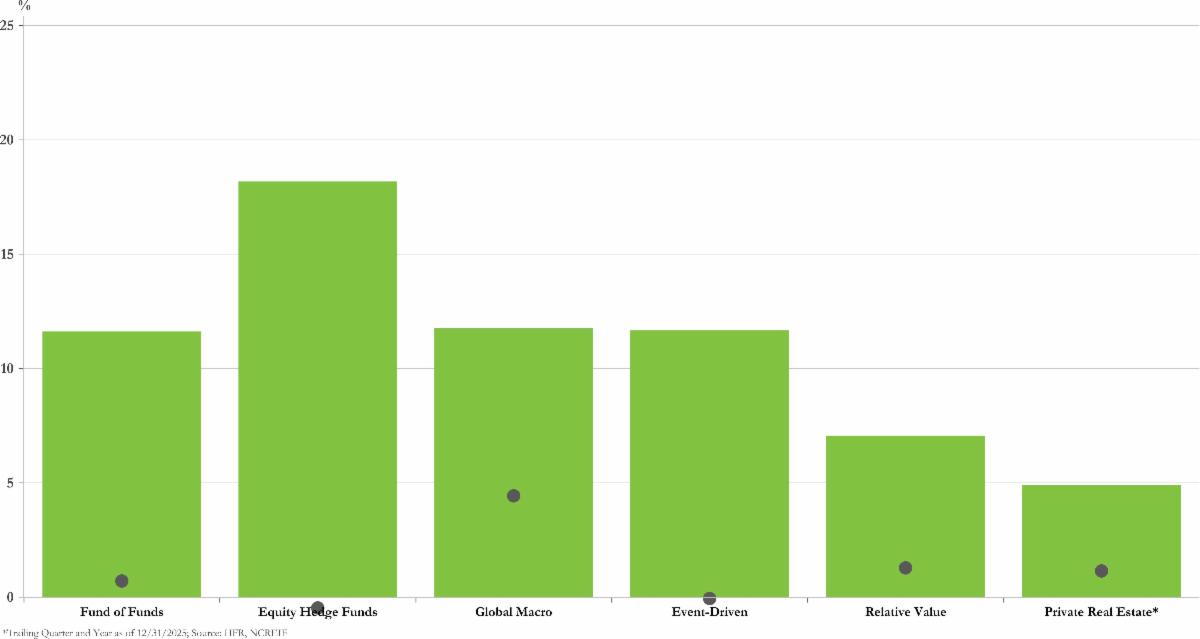
Fund of Funds
HFRI Fund of Funds
Composite Index
The HFRI Fund of Funds Composite Index is an equally weighted hedge fund of funds benchmark composed of global constituent funds. The underlying constituents are typically diversified among multiple managers and styles to provide a comprehensive representation of the hedge fund of funds investment space.
Equity Hedge Funds
HFRI Equity Hedge Index
The HFRI Equity Hedge Index is an equally weighted hedge fund benchmark composed of investment managers who maintain both long and short positions, primarily in equity and equity derivative securities. Equity hedge managers typically maintain at least 50% exposure to, and may in some cases be entirely invested in, equities, both long and short.
Global Macro
HFRI Macro Index
The HFRI Macro Index is an equally weighted hedge fund benchmark composed of investment managers that trade a broad range of strategies in which the investment process is predicated on movements in underlying economic variables and the impact these have on equity, fixed income, hard currency, and commodity markets. Managers employ a variety of techniques, both discretionary and systematic analysis, combinations of top-down and bottom-up theses, quanti-
tative and fundamental approaches, and long- and short-term holding periods.
Event-Driven
HFRI Event-Driven Index
The HFRI Event-Driven Index is an equally weighted hedge fund benchmark composed of investment managers who maintain positions in companies currently or prospectively involved in corporate transactions of a wide variety including but not limited to mergers, restructurings, financial distress, tender offers, shareholder buybacks, debt exchanges, security issuance or other capital structure adjustments. Event-driven exposure includes a combination of sensitivities to
equity markets, credit markets, and idiosyncratic, company-specific developments.
Relative Value
HFRI Relative Value Index
The HFRI Relative Value Index is an equally weighted hedge fund benchmark composed of investment managers who maintain positions in which the investment thesis is predicated on the realization of a valuation discrepancy in the relationship between multiple securities. Managers employ a variety of fundamental and quantitative techniques to establish investment theses, and security types can range broadly across equity, fixed income, derivative, or other security types.
Private Real Estate
NCREIF Property Index
The NCREIF Property Index is a quarterly, unleveraged composite total return for private commercial real estate properties held for investment purposes only. Constituents include operating apartment, hotel, industrial, office, and retail properties.
U.S. Large Cap
Russell 1000 Index
The Russell 1000 Index measures the performance of the large-cap segment of the U.S. equity universe. It is a subset of the Russell 3000 Index representing approximately 90% of the total market capitalization of that index. It includes approximately 1,000 of the largest securities based on a combination of their market cap and current index membership.
U.S. Mid Cap
Russell Midcap Index
The Russell Midcap Index measures the performance of the mid-cap segment of the U.S. equity universe. The Russell Midcap Index is a subset of the Russell 1000 Index. It includes approximately 800 of the smallest securities based on a combination of their market cap and current index membership. The Russell Midcap Index represents approximately 31% of the total market capitalization of the Russell 1000 companies.
U.S. Small Cap
Russell 2000 Index
The Russell 2000 Index measures the performance of the small-cap segment of the U.S. equity universe. It is a subset of the Russell 3000 Index representing approximately 10% of the total market capitalization of that index. It includes approximately 2,000 of the smallest securities based on a combination of their
market cap and current index membership.
U.S. Core
Russell 1000 Index
The Russell 1000 Index measures the performance of the large-cap segment of the U.S. equity universe. It is a subset of the Russell 3000 Index representing approximately 90% of the total market capitalization of that index. It includes approximately 1,000 of the largest securities based on a combination of their market cap and current index membership.
U.S. Value
Russell 1000 Value Index
The Russell 1000 Value Index measures the performance of the large-cap value segment of the U.S. equity universe. It includes those Russell 1000 companies with lower price-to-book ratios and lower forecasted growth values.
U.S. Growth
Russell 1000 Growth Index
The Russell 1000 Growth Index measures the performance of the large-cap growth segment of the U.S. equity universe. It includes those Russell 1000 companies with higher price-to-book ratios and higher forecasted growth values.
International Large Cap
MSCI All Country World ex. U.S. Index
The MSCI All Country World ex U.S. Index captures large- and mid-cap representation across developed and emerging markets countries, excluding the U.S. The index covers approximately 85% of the global equity opportunity set outside the U.S.
International Mid Cap
MSCI All Country World ex. U.S. Mid Cap Index
The MSCI ACWI ex USA Mid Cap Index captures mid cap representation across 22 Developed Markets (DM) and 24 Emerging Markets (EM) countries*. With 1,208 constituents, the index covers approximately 15% of the free float-adjusted market capitalization in each country.
International Small Cap
MSCI All Country World ex. U.S. Small Cap Index
The MSCI ACWI ex USA Small Cap Index captures small cap representation across 22 of 23 Developed Markets (DM) countries (excluding the US) and 24 Emerging Markets (EM) countries*. With 4,263 constituents, the index covers approximately 14% of the global equity opportunity set outside the US.
International Core
MSCI All Country World
ex. U.S. Index
The MSCI All Country World ex U.S. Index captures large- and mid-cap representation across developed and emerging markets countries, excluding the U.S.
The index covers approximately 85% of the global equity opportunity set outside the U.S.
International Value
MSCI All Country World ex. U.S. Value Index
The MSCI ACWI ex USA Value Index captures large and mid cap securities exhibiting overall value style characteristics across 22 Developed and 24 Emerging Markets countries*. The value investment style characteristics for index construction are defined using three variables: book value to price, 12-month forward earnings to price and dividend yield.
International Growth
MSCI All Country World ex. U.S. Growth Index
The MSCI ACWI ex USA Growth Index captures large and mid cap securities exhibiting overall growth style characteristics across 22 Developed Markets (DM) countries and 24 Emerging Markets (EM) countries*. The growth investment style characteristics for index construction are defined using five variables: long-term forward EPS growth rate, short-term forward EPS growth rate, current internal growth rate and long-term historical EPS growth trend and long-
term historical sales per share growth trend.
|