Second Quarter 2026 - Investment Newsletter

KEY TAKEAWAYS

>> Geopolitical conditions remain unsettled, particularly in the Middle East. Developments involving Iran have moved in and out of focus, with intermittent signs of de-escalation offset by the absence of a clear, lasting resolution. The recent breakdown of ceasefire efforts has reintroduced the risk of renewed escalation and reinforced the region's ongoing geopolitical uncertainty. The quarter demonstrated both the region's ability to disrupt key transit routes and greater-than-expected resilience in global energy markets, as supply adjustments helped mitigate what could historically have been a more severe shock.

>> The global buildout of AI and digital infrastructure continues to be a defining driver of capital allocation among many of the world's largest and most profitable companies. Investment in data centers, semiconductors, and power capacity continues to accelerate, and supply constraints and rising input costs are increasingly filtering through to pricing, introducing a more persistent, targeted source of inflation pressure.

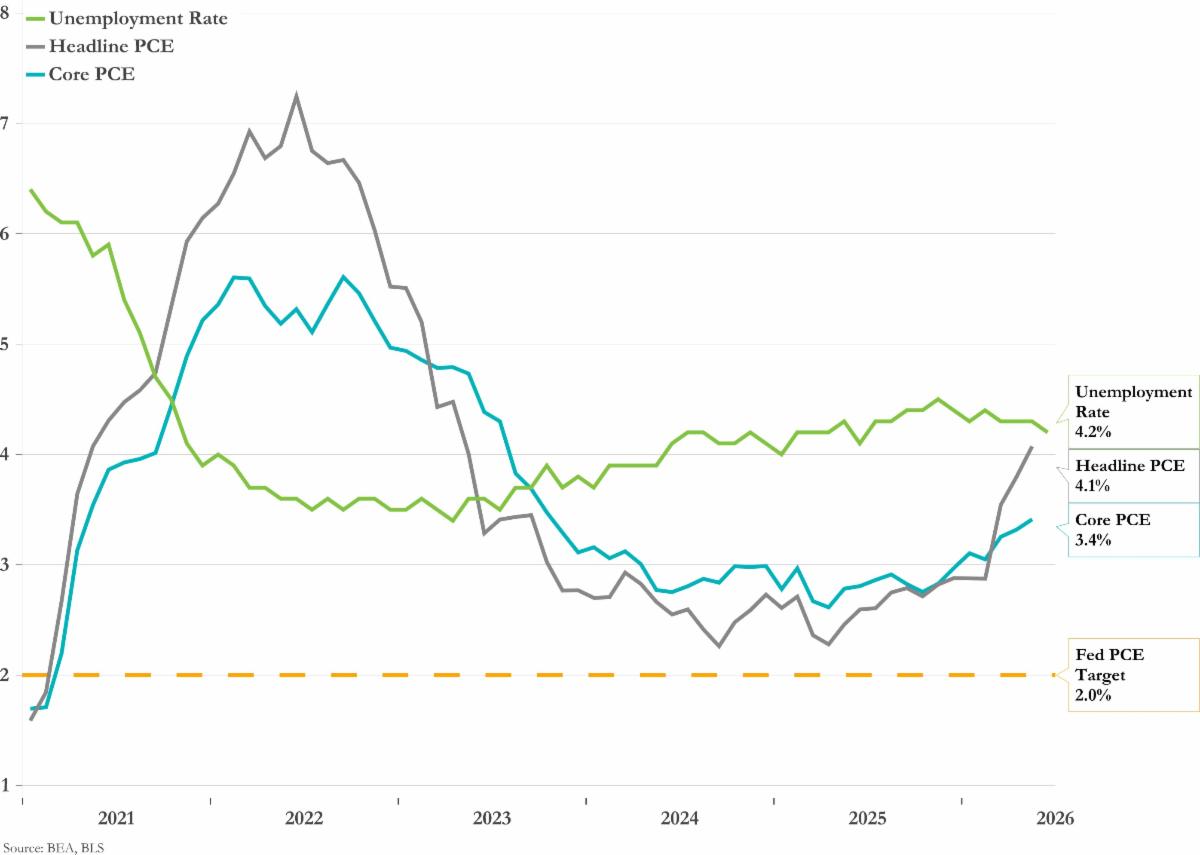
>> Inflation was one of the quarter's biggest surprises, reaccelerating as the spike in energy prices tied to the Iran conflict worked through the economy. Headline consumer and producer price readings reached their highest levels in more than three years, with energy responsible for the bulk of the increase. Core and slower-moving measures held closer to trend, however, suggesting the surge was concentrated in volatile categories rather than broadening out. With crude retreating after the mid-June ceasefire framework, headline inflation appears to be near a peak, though the path from here remains uncertain.

>> Financial assets remained resilient against this backdrop. Equity performance was supported by durable earnings, continued capital investment, and a willingness among investors to look through near-term uncertainty. Pullbacks were limited and shorter in duration than the macro environment might have suggested.

  • Market leadership broadened at the margins, small caps and emerging markets outperformed, and participation extended beyond mega-cap technology, even as U.S. large-cap indices remain highly concentrated by historical standards, with a handful of AI-linked names driving an outsized share of returns. Elevated capital spending tied to AI infrastructure may continue to reshape return profiles going forward.


  • Fixed income markets adjusted to a policy outlook that shifted from anticipated cuts to a genuine possibility of hikes, even as the Fed held rates steady through quarter-end. Elevated starting yields helped offset potential duration-related losses as rates moved higher.


  • Real assets reflected both cyclical and structural forces, and performance diverged sharply across the complex. Energy was volatile as Middle East supply risk unwound, and precious metals, which had appreciated significantly through 2025 and into early 2026, gave back much of that gain in one of their sharpest quarterly pullbacks in years, even as they continue to serve as a longer-term hedge against inflation and geopolitical risk. Infrastructure, particularly assets tied to digital capacity and energy systems, continued to benefit from sustained structural demand.


  • Private markets remain constructive, though the opportunity set is increasingly varied across asset classes and vintages. Segments such as real estate appear to be troughing, while others are closer to more mature points in the cycle. Areas tied to long-term capital needs, such as infrastructure, are well supported, and private credit continues to offer attractive income potential as headline concerns have moderated. Manager selection, underwriting discipline, and access remain critical drivers of outcomes.


  • The broader takeaway is familiar but worth reinforcing: staying aligned with long-term objectives, rather than reacting to short-term uncertainty, is what matters most. Despite the noise, markets remained supportive this quarter, and while evolving risks may warrant incremental adjustments at times, long-term outcomes are more often shaped by consistent execution than by short-term reactions.


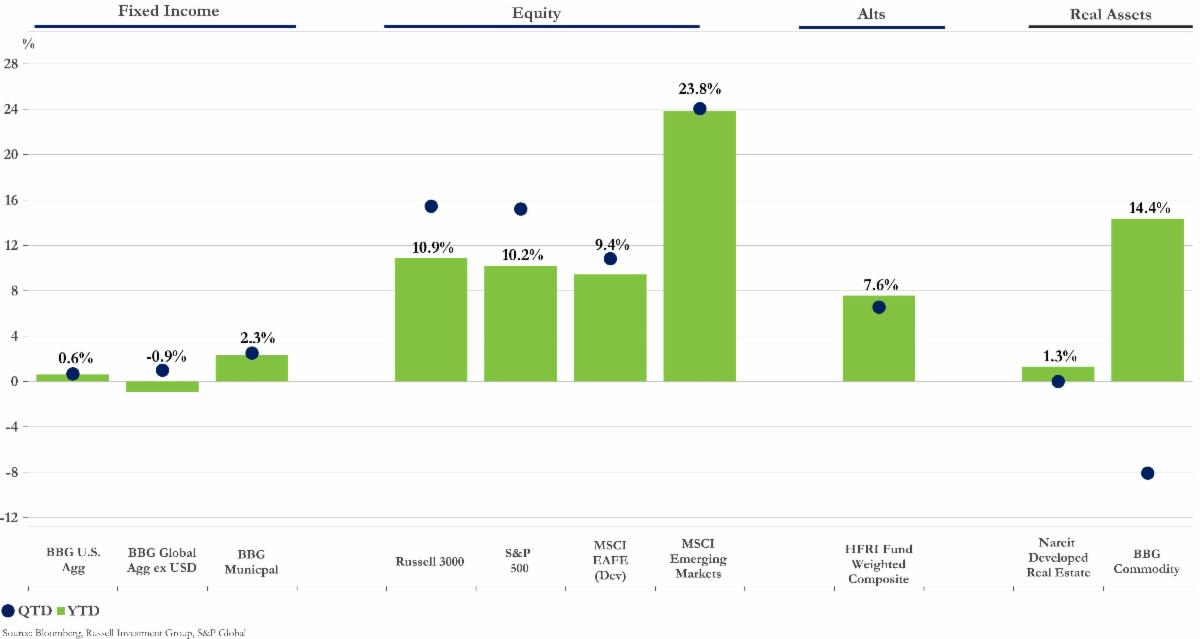
Asset Class Performance as of 6/30/2026

ECONOMY

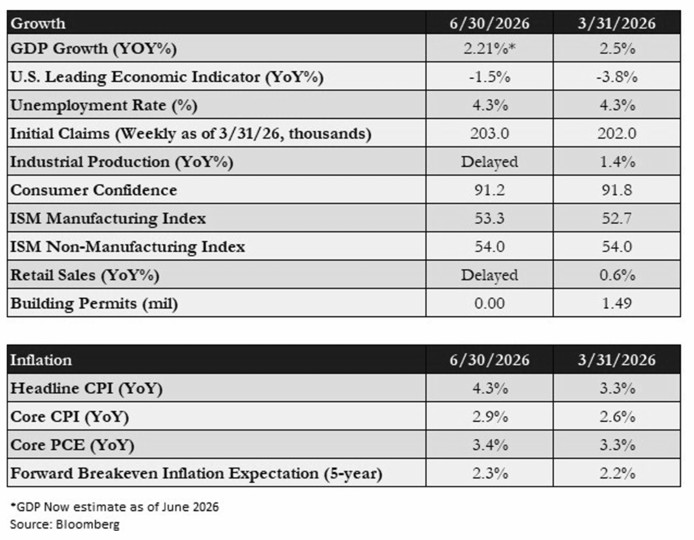
As the second quarter closed, the U.S. economy continued to prove more durable than expected, even as the sources of growth narrowed. First-quarter GDP was revised up to an annualized 2.1%, supported by resilient business investment, government spending, and heavy capital deployment into AI and digital infrastructure. Globally, growth moderated but remained intact, with consensus near 3% for the year. The outlook increasingly rests on two questions: whether stability holds in the Middle East, and how long the AI investment cycle can sustain its current pace.


AI-related spending emerged as the single most powerful force in the economy. Corporate capital expenditures reached levels rarely seen in modern history, translating into earnings growth of more than 20% year-over-year in the first quarter, the fastest pace since 2021. The strength was broad enough that companies outside the largest technology names posted a third consecutive quarter of double-digit gains. This has offset softness elsewhere in the economy, though it has also concentrated market performance around a single, capital-intensive theme.


Consumer spending held up better than feared, but the quality of that strength eroded. Retail sales accelerated through the spring, yet the gains were carried disproportionately by higher-income households, which now account for roughly 60% of all spending, a record. The savings rate fell to around 3%, households leaned more heavily on credit, and delinquencies among lower-income borrowers reached multi-year highs. With consumer confidence at a multi-year low and real incomes barely positive, the K-shaped dynamic of the post-pandemic period persisted.


The labor market cooled but showed encouraging stability. May payrolls surprised to the upside, and broader unemployment measures ticked lower, as slower job growth was offset by slower labor force expansion. Wage growth remained contained, easing inflationary pressure while reflecting subdued hiring. The overall picture is one of gradual normalization rather than deterioration, though a meaningful rise in unemployment would reshape the policy conversation.


Manufacturing continued to lag but showed tentative signs of stabilizing. Higher financing costs, uncertain demand, and tariff-related pressures weighed on output and new orders, and energy-intensive industries remained exposed to commodity swings tied to the Middle East. At the same time, surging demand for the physical inputs of the AI buildout, from equipment to metals and materials, provided an increasingly important source of support.


The U.S. dollar traded on the softer side for much of the quarter. After weakening through 2025, it remained pressured by large fiscal deficits, a heavy Treasury refinancing burden, and a narrowing interest rate advantage, dynamics also reflected in gold's rally to record highs before its subsequent pullback. The dollar found periodic support from safe-haven demand and the mid-June repricing of Fed policy. Its movements remain consequential for inflation, trade competitiveness, and international asset returns.


Geopolitics remained a defining feature of the quarter. The Iran conflict, which erupted late in the first quarter, continued to influence energy prices and sentiment, and the preliminary ceasefire did little to fully remove the risk of re-escalation, particularly heading into a contentious midterm election season. History offers some perspective: selloffs tied to past oil shocks have generally proven short-lived, a reminder that markets tend to look forward even amid unsettling headlines.


Inflation & Policy Implications


  • Headline inflation reaccelerated sharply, as the energy shock from the Iran conflict pushed consumer and producer prices to their highest levels in more than three years, with energy responsible for the bulk of the increase.


  • Core and slower-moving measures remained far more contained, though structural forces such as elevated fiscal deficits, reshoring, and higher tariffs continue to argue for a higher inflation floor over time.


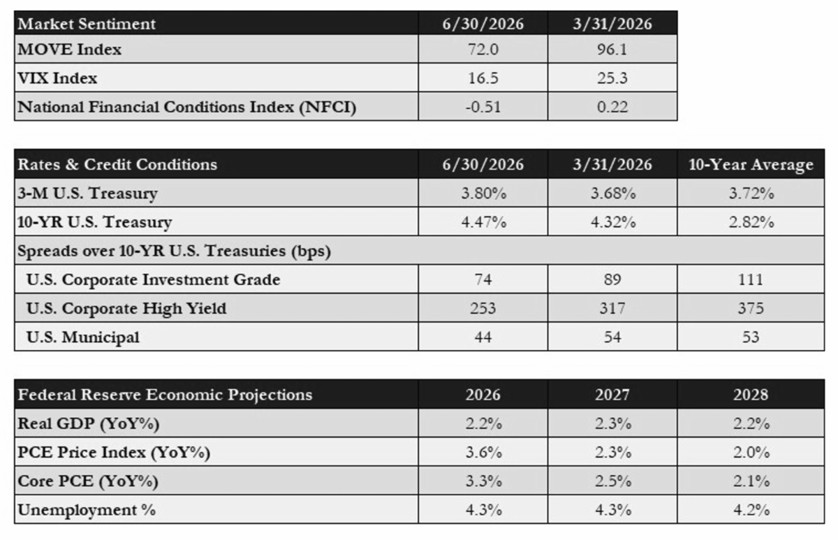
  • The Fed held its policy rate steady at a target range of 3.50%–3.75%, but its mid-June projections signaled the possibility of rate increases later in the year, a marked shift from the cuts investors had anticipated entering 2026.


  • The transition to new Fed Chair Kevin Warsh added further uncertainty, as he scaled back forward guidance and pointed to alternative inflation gauges, reinforcing a patient, data-dependent approach.

Unemployment and PCE Inflation

MARKETS

Equities Markets


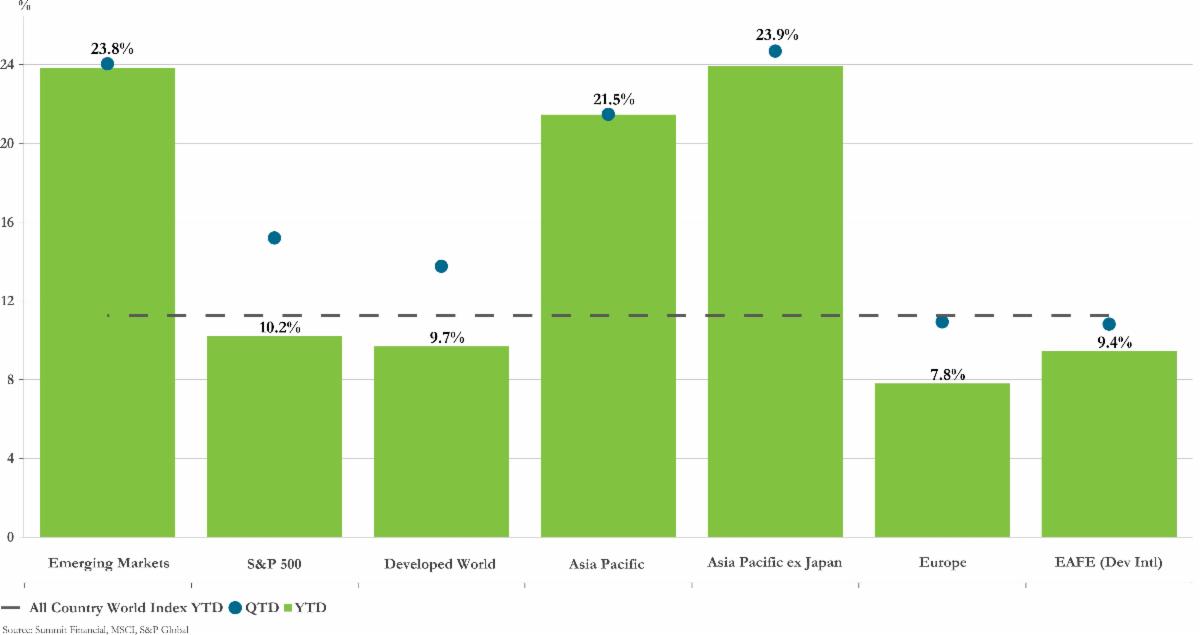
Global equities delivered exceptional gains in the second quarter, led by the S&P 500 (+15.2%) and Nasdaq 100 (+27.7%). The rally was driven primarily by the artificial intelligence investment cycle, which more than offset persistent inflation and an unchanged Fed policy stance, adding over $8 trillion in market capitalization to the S&P 500. Performance also broadened meaningfully beyond mega-cap technology: the Russell 2000 advanced 21.6% during the quarter, outperforming the S&P 500 by more than 600 basis points, supported by resilient labor market conditions and strong consumer sentiment. A Supreme Court ruling that struck down a key component of federal tariff policy also contributed to the positive backdrop, prompting the U.S. Treasury to refund nearly $22 billion in tariff revenue in May alone.


International equities also had a standout quarter, driven primarily by the AI-led semiconductor cycle and supported by the resolution of key macro overhangs, including tariff policy uncertainty and improving geopolitical conditions. The MSCI World ex-U.S. advanced 12.0%, while the MSCI Emerging Markets Index gained 24.1%. Despite periods of intra-quarter volatility, particularly in technology-sensitive markets, the rally broadened geographically, with Japan and emerging Asia leading performance while Hong Kong and the UK lagged. The AI investment cycle remained the dominant driver across the region, with South Korea and Taiwan standing out as key beneficiaries: Korean exports grew 53.2% in May, and Taiwan's GDP expanded to growth rates not seen since the 1970s and 1980s.


Overall, the second quarter marked a sharp reversal from the turbulence seen in the first, underscoring how quickly market conditions can shift. Easing geopolitical tensions, driven by progress toward a U.S.–Iran agreement, contributed to a decline in energy prices even as inflation reemerged as a concern, and the appointment of Kevin Warsh as Fed Chair introduced a more hawkish policy tone that reshaped rate expectations. SpaceX’s June 13, 2026 IPO priced at $135 per share raised a record $75 billion amid exceptional demand, drove a ~26.6% return by quarter-end with rapid early trading gains that pushed its market cap above $2.3 trillion, and was followed by major strategic moves, including a $60 billion Cursor acquisition, a $25 billion bond issuance, and imminent Nasdaq 100 inclusion, underscoring strong investor confidence and growth ambitions.


Global Equity Market Performance

S&P 500 Sector Divergence


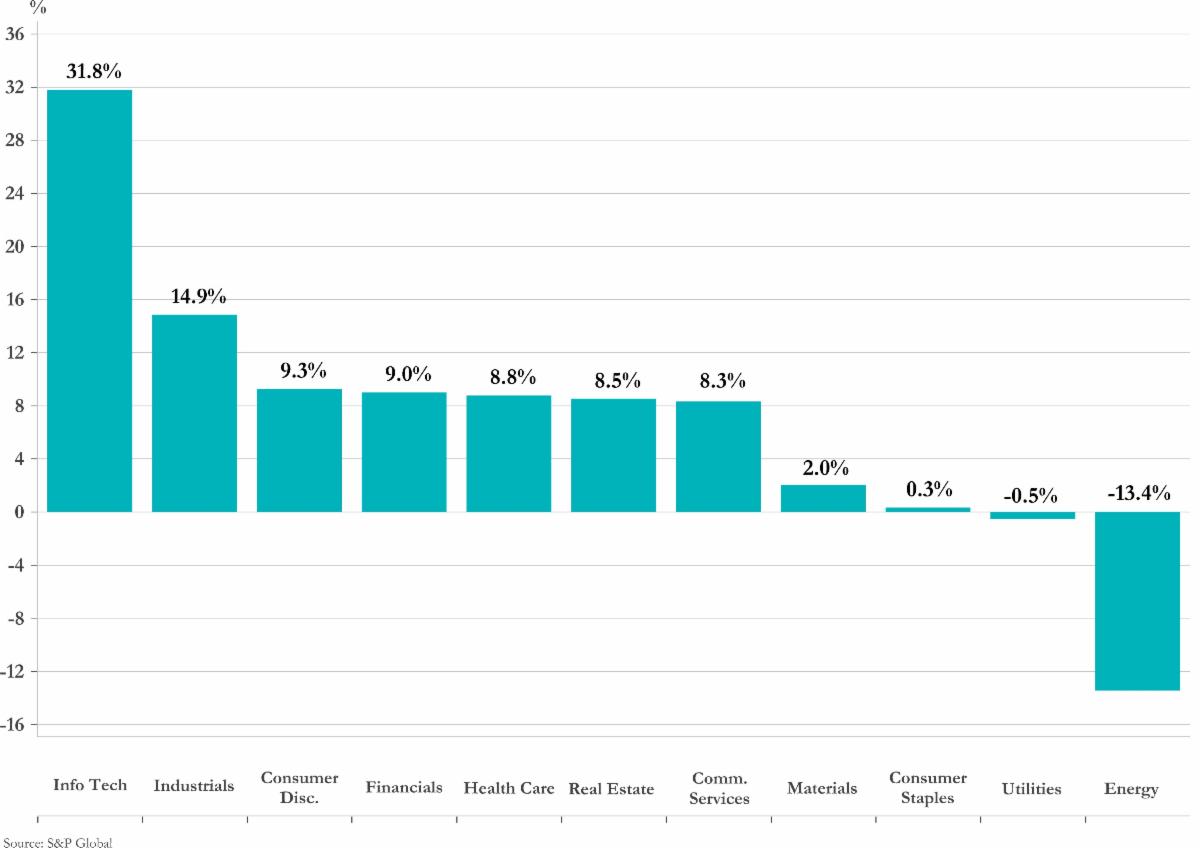
  • Technology-led performance, surging 49.3% on record semiconductor strength and acting as the primary driver of S&P 500 gains. However, this concentration raises questions about the rally’s durability and breadth.


  • AI-driven capex and infrastructure investment also lifted cyclical sectors, extending gains beyond pure Tech. Real Estate and Industrials benefited from data center demand and AI buildout, while Financials (+8.1%) were supported by increased AI-related equity issuance boosting investment banking activity.


  • Lagging sectors diverged from the trend. Energy fell 8.5% due to a sharp reversal in crude prices tied to the reopening of the Strait of Hormuz, while Communications declined 0.9% amid OpenAI’s reported IPO delay and a late-quarter Apple selloff.


S&P 500 Sector Returns - Q2 2026

Fixed Income Markets


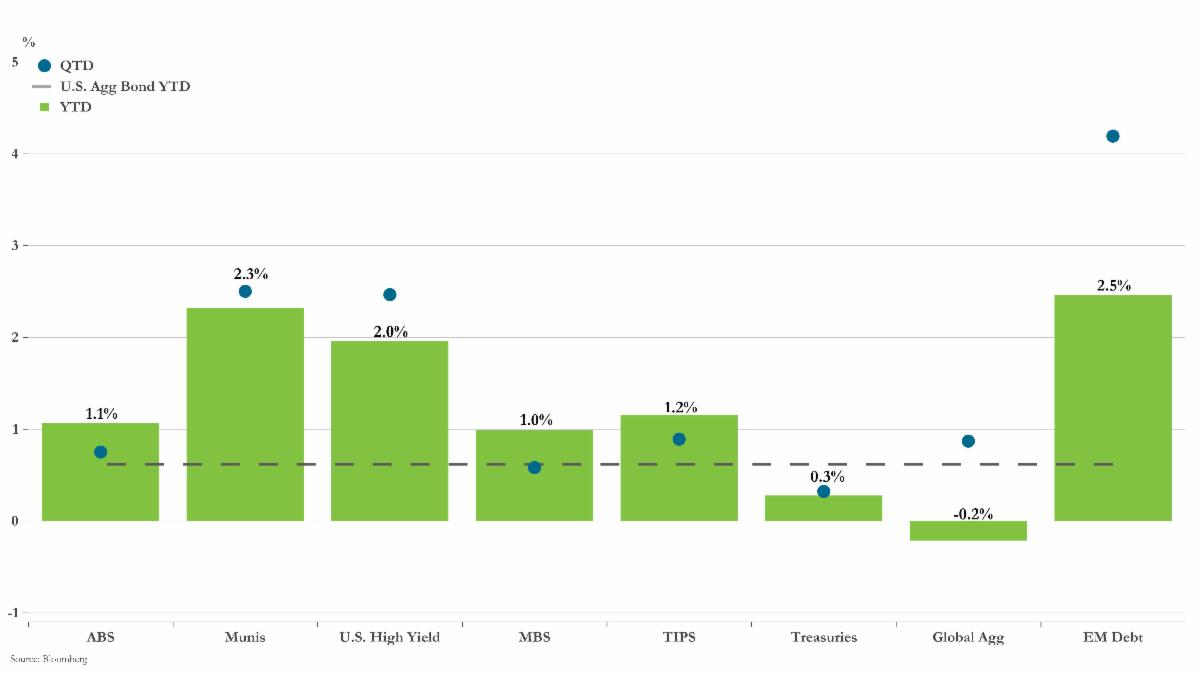
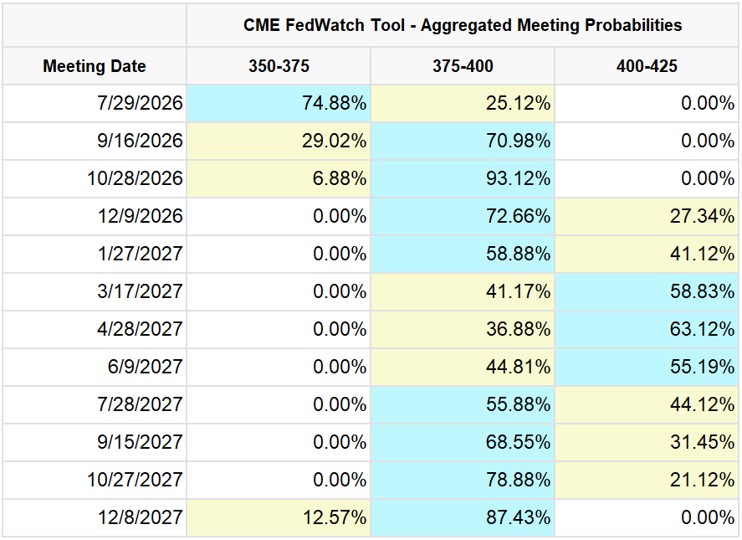
U.S. fixed income delivered modest returns in the second quarter as macro conditions remained mixed and policy expectations shifted meaningfully. Oil prices declined sharply as ceasefire negotiations progressed and key supply routes reopened, but inflation remained elevated, with Core PCE continuing to run above the Fed’s target. The Fed held rates unchanged at a target range of 3.50%–3.75% at both the April and June FOMC meetings. Market expectations, however, shifted materially over the quarter: a rate cut had been the consensus entering April, but by May the market had pivoted to pricing in a potential hike by year-end, and by quarter-end was increasingly focused on a possible hike as early as September.


Against this backdrop, Treasury yields moved higher, led by the front end, resulting in a bear-flattening of the curve. The 2-year yield rose meaningfully while the 10-year moved more modestly higher, briefly reaching intra-quarter highs before ending June near 4.47%, with the long end remaining relatively anchored. This flattening dynamic suggests markets are pricing in more Fed tightening and a higher-for-longer rate environment.


The Bloomberg U.S. Aggregate Index returned approximately 0.7% for the quarter, while risk assets performed well as credit spreads tightened broadly across investment grade and high yield markets despite elevated issuance. High yield gained roughly 2.5%, supported by improved sentiment and resilient economic data, while TIPS returned about 0.9%, continuing to provide inflation protection.


Municipal bonds outperformed taxable fixed income during the quarter, with the Bloomberg Municipal Bond Index returning approximately 2.5%. Strong investor demand was a key driver, with funds seeing inflows in 12 of 13 weeks and totaling roughly $50 billion year-to-date, helping to absorb elevated issuance that has outpaced last year’s record levels.


Unlike Treasuries, municipal yields declined during the quarter, led by the long end, resulting in a flatter curve. Thirty-year yields fell significantly more than intermediate maturities, though the curve remains relatively steep compared to Treasuries and continues to offer opportunities further out the curve. Performance was led by long-duration bonds, with revenue and lower-rated securities, including high yield municipals, outperforming higher-quality segments as risk sentiment improved.


Overall, the quarter reflected a transition across both taxable and tax-exempt markets, characterized by resilient credit conditions, strong municipal technicals, and a meaningful repricing of Fed expectations toward a more restrictive policy path.


Fixed Income Sector Performance

Shifting Interest Rate Expectations


  • Having entered April expecting a rate cut, the market fully pivoted by May to pricing in one rate hike by year-end, as officials warned that policy may not be sufficiently restrictive to return inflation to 2%.


  • The June FOMC dot plot showed a hawkish shift: nine of nineteen officials projected at least one rate hike in 2026 (six of whom projected two or more), while the remaining participants expected no change or a cut.


  • By quarter-end, markets were pricing in one rate hike as early as September, with the possibility of a second in early 2027.


REAL ASSETS


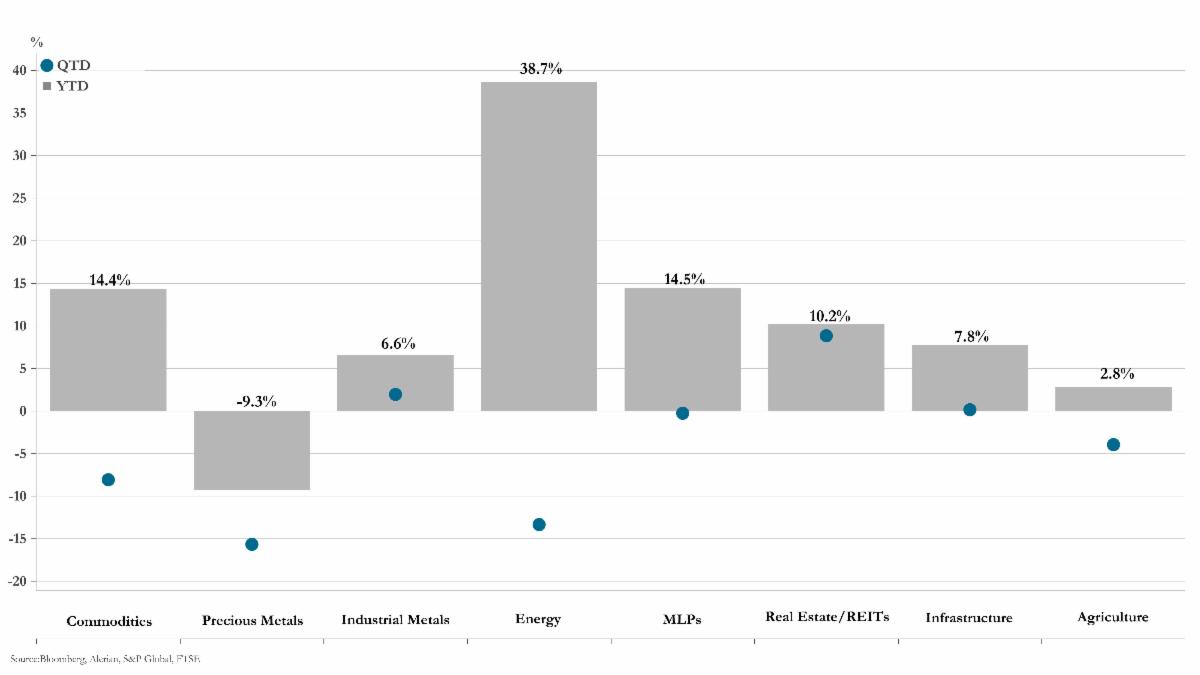
Public real assets delivered a divergent second quarter, with listed real estate posting solid gains while commodity-linked segments broadly retreated. The dominant story was the reversal in energy markets following the U.S.–Iran ceasefire and the reopening of the Strait of Hormuz, which unwound much of the geopolitical risk premium from the first quarter and drove performance across most real asset segments.


Listed real estate was the standout performer: the FTSE EPRA Nareit Developed Index returned 9.7% for the quarter, bringing its year-to-date gain to 13.7%. Stabilizing rate expectations, resilient occupancy fundamentals, and renewed demand for yield-oriented equities supported the sector. Hotel and office REITs led performance, while data center demand remained a key structural tailwind as U.S. technology companies committed significant capital to new capacity.


Infrastructure and midstream energy assets also held up well. The Alerian MLP Index returned 1.4% for the quarter, demonstrating resilience despite lower energy prices and bringing its year-to-date return to 20.8%. The S&P Global Infrastructure Index gained 1.6%, with returns supported by continued AI-driven data center construction, partially offset by emerging political headwinds in some markets.


Commodities, by contrast, sold off broadly. The Bloomberg Commodity Index fell 8.9%, led by a 14.1% drop in energy, though the sector remains sharply higher year-to-date. Precious metals were the weakest segment, declining 15.7% as safe-haven demand reversed. Industrial metals were roughly flat but still positive year-to-date, while agriculture declined 4.0% amid improving supply conditions and a stronger dollar.


Looking ahead, performance will hinge on the durability of energy supply recovery, the path of interest rates, and the sustainability of AI-driven infrastructure demand. Listed real estate remains sensitive to rate moves, midstream assets appear well positioned given their fee-based structure, and commodities, particularly precious metals, remain vulnerable to further unwinding of geopolitical premiums, though inflation or a weaker dollar could provide support.


Real Assets Performance

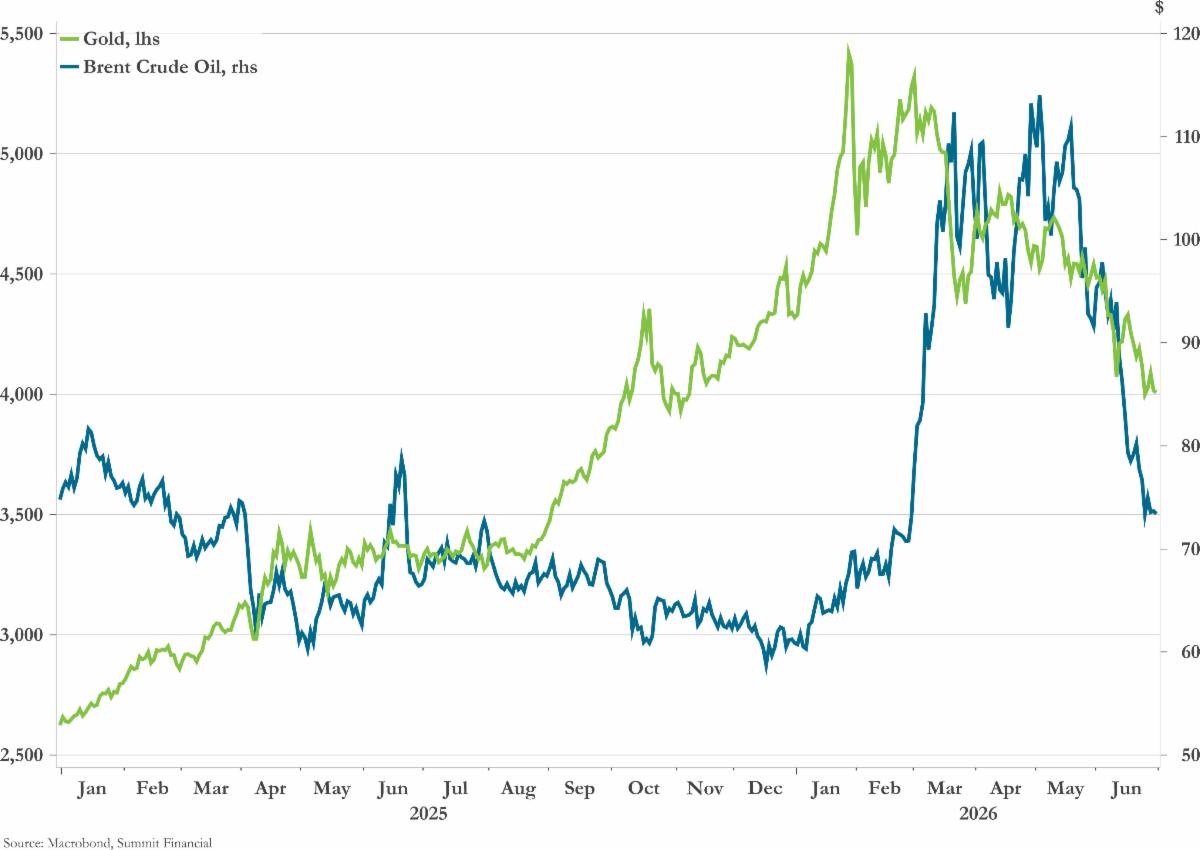
Sharp Reversal in Oil & Gold


  • Brent crude gave back much of its first-quarter rally in Q2, as the U.S.–Iran ceasefire and phased reopening of the Strait of Hormuz eased fears of a prolonged disruption to global oil flows, though the path forward is now back in question.


  • OPEC output had hit its lowest level in decades in April amid the Hormuz blockade, yet the swift return of shipping and production drove a sharp quarterly decline, prompting several major banks to cut their year-end price forecasts.


  • Gold and silver retreated alongside oil, as de-escalation of the Iran conflict unwound much of the safe-haven premium built up earlier in the year, marking one of the sharpest quarterly pullbacks in precious metals in recent memory.


ALTERNATIVES


Geopolitics remained a prominent influence across private markets, as the Iran conflict and broader Middle East instability kept energy prices and volatility elevated. As is often the case, periods of stress served to differentiate asset quality and manager skill rather than alter the long-term case for private markets. Discipline around underwriting, liquidity, and access remained central, and the opportunity set grew increasingly varied across asset classes and vintages.


Private equity remained in a period of recalibration. The recovery that appeared to take shape late last year has been slower to materialize, with renewed volatility from the Iran conflict interrupting an emerging uptick. U.S. deal value declined modestly year-over-year in the first quarter even as deal count rose, suggesting capital is being deployed across smaller transactions rather than large buyouts. With higher financing costs limiting leverage, returns increasingly hinge on operational value creation, and small-and mid-market strategies continued to stand out. Secondary markets remained a bright spot, with record 2025 volumes and a growing role for continuation vehicles.


Private credit delivered modest returns amid ongoing negative headlines, while continuing to attract strong investor interest due to attractive yields, floating-rate structures, and lender protections. Spreads stabilized in recent months following earlier volatility, as net asset values adjusted, particularly in software-related exposures, before recovering alongside improving sentiment. Despite these positive trends, direct lending redemptions remained elevated in the second quarter, with many funds experiencing requests above 10%. Performance across collateral-backed strategies, including real estate debt and asset-based lending, was more resilient, supported by stable credit fundamentals. Overall, while recent pressures appear market-driven and largely isolated rather than systemic, manager selection remains critical, with lower-leverage, well-diversified platforms best positioned to capitalize on current opportunities.


Private real estate showed a nuanced backdrop, though signs of stabilization grew more visible. Pricing appears to be working through prior valuation pressure, with fund net asset values improving from recent lows and several segments looking as though they may be troughing. Performance stayed highly differentiated, with industrial and multifamily assets holding up better amid steady demand and constrained supply, while office remained challenged in select markets. Elevated financing costs continued to temper transaction activity, reinforcing the importance of selectivity.


Private infrastructure remained one of the more resilient segments, underpinned by durable, long-term demand tied to digital infrastructure, electrification, and the energy transition. It also drew attention as a primary source of financing for the AI buildout. Because many assets operate under contractual or regulated revenue models, they can pass rising costs through to customers, historically supporting returns in inflationary periods. Stable cash flows, low correlation to public markets, and reduced rate sensitivity continued to support investor interest, even as elevated valuations called for disciplined underwriting.


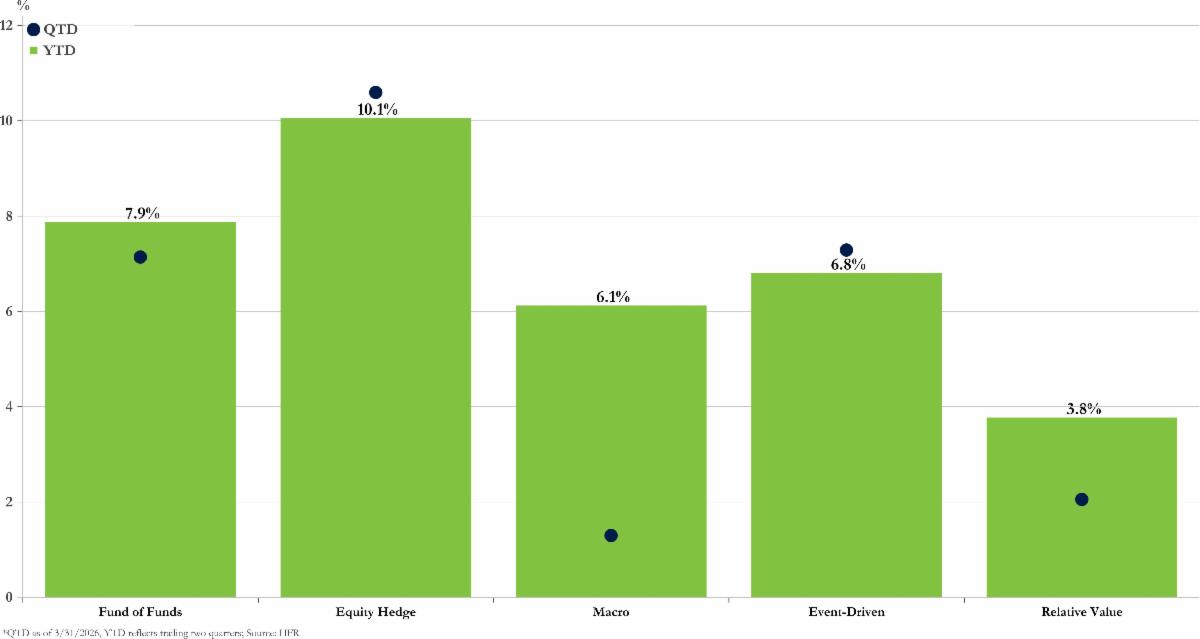
Hedge funds delivered solid results amid a volatile first half, extending the favorable 2025 backdrop. Sharp moves driven by geopolitics, shifting rate expectations, and diverging central bank policies created opportunities, particularly for macro and trading-oriented strategies. Elevated equity and credit valuations left markets more sensitive to turbulence. Across strategies, performance dispersion is likely to remain wide, reinforcing the value of diversification and thoughtful manager selection.


Across private markets, maintaining a long-term perspective remains essential. Periods of volatility are a normal part of market cycles, particularly for asset classes with longer horizons. While short-term disruptions can test sentiment, they reinforce the importance of partnering with experienced managers who demonstrate disciplined underwriting and repeatable value creation. Over time, that focus should support more consistent outcomes.


Alternatives

DISCLAIMER

Compliance Code: 9017551.1


This commentary was authored by the investment team at Summit Financial, LLC., an SEC Registered Investment Adviser (“Summit”), headquartered at 4 Campus Drive, Parsippany, NJ 07054, Tel. 973-285-3600. It is provided for your information and guidance and is not intended as specific advice and does not constitute an offer to sell securities. Summit is an investment adviser and offers asset management and financial planning services. Indices are unmanaged and cannot be invested into directly.


Data in this newsletter is obtained from sources which we, and our suppliers believe to be reliable, but we do not warrant or guarantee the timeliness or accuracy of this information. Consult your financial professional before making any investment decision. Past performance is no guarantee of future results. Diversification/asset allocation does not ensure a profit or guarantee against a loss. Economic and market forecasts presented herein reflect our judgment as of the date of this presentation and are subject to change without notice. Any forecasts are subject to high levels of uncertainty that may affect actual performance. Accordingly, forecasts should be viewed as merely representative of a broad range of possible outcomes. Forecasts are estimated, based on assumptions, and are subject to significant revision and may change materially as economic and market conditions change. Forecasts do not take into account the specific investment objectives, restrictions, tax and financial situation or other needs of any specific client.


DEFINITIONS & DESCRIPTIONS

CBOE Volatility Index (VIX)

The CBOE Volatility Index (VIX) reflects the market’s real-time expectation of 30-day forward-looking volatility. It is created by the Chicago Board of Options Exchange (CBOE).


National Financial Condi-tions Index (NFCI)

The Chicago Fed’s National Financial Conditions Index (NFCI) provides a comprehensive weekly update on U.S. financial conditions in money markets, debt and equity markets, and the traditional and “shadow” banking systems


Consumer Confidence Index

The Consumer Confidence Index is a measure based on a survey administered by The Conference Board that reflects prevailing business conditions and likely developments for the months ahead. This monthly report details consumer attitude, buying intentions, vacation plans, and consumer expectations for inflation, stock prices, and interest rates.


Consumer Price Index

The Consumer Price Index (CPI) is a measure of the average change over time in the prices paid by urban consumers for a market basket of consumer goods and services.


Core Inflation

Core Inflation is a measure of economic inflation that excludes food and energy


Headline Inflation

Headline Inflation is a measure of the total economic inflation that includes food and energy prices


ISM Manufacturing Index

The ISM Manufacturing Index, also known as the purchasing managers’ index (PMI), is a monthly indicator of U.S. economic activity based on a survey of executives covering all North American Industry Classification System’s businesses in the manufacturing sector.


ISM Non-Manufacturing Index

The ISM Non-Manufacturing Index is a monthly indicator of U.S. economic activity based on a survey of executives covering all North American Industry Classification System’s businesses in the services (or non-manufacturing) sector.


Leading economic indicators (LEI)

Leading economic indicators (LEI) are statistics that precede economic events. They predict the next phase of the business cycle.


Merrill Lynch Option Vola-tility Estimate Index (MOVE Index)

The MOVE index, or Merrill Lynch Option Volatility Estimate Index, is a gauge of interest rate volatility in the U.S. Treasury market. It is calculated from options prices, which reflect the collective expectations of market participants about future volatility. The index measures the implied volatility of U.S. Treasury options across various maturities


OECD Composite leading indicators (CLIs)

The OECD Composite leading indicators (CLIs), designed to anticipate turning points in economic activity relative to trend


Personal Consumption Expenditures Price Index (PCE)

Personal Consumption Expenditures Price Index (PCE) is a measure of the prices that people living in the United States, or those buying on their behalf, pay for goods and services. The PCE price index is known for capturing inflation (or deflation) across a wide range of consumer expenses and reflecting changes in consumer behavior


The Federal Funds Rate

The Federal Funds Rate is the target interest rate range at which commercial banks borrow and lend their excess reserves to each other overnight, which is set by the Federal Open Market Committee (FOMC)


Treasury Bill (T-Bill)

A Treasury Bill (T-Bill) is a short-term U.S. government debt obligation backed by the Treasury Department with a maturity of one year or less;


U-3 unemployment rate

The U-3 unemployment rate is the most commonly reported rate in the United States, representing the number of unemployed people actively seeking a job


United States Industrial Production

United States Industrial production refers to the output of industrial establishments and covers sectors such as mining, manufacturing, electricity, gas, steam, and air-conditioning. This indicator is measured in an index based on a reference period that expresses change in the volume of production output;


Consumer Sentiment

Consumer Sentiment is represented by The University of Michigan Consumer Sentiment Index which rates the relative level of current and future economic conditions.


Building Permits

Building Permits measures the change in the number of new building permits issued by the government. Building permits are a key indicator of demand in the housing market.


Retail Sales

Retail sales are an economic metric that tracks consumer demand for finished goods. This figure is a very important data set as it is a key monthly market-moving event. Retail sales are reported each month by the U.S. Census Bureau and indicate the direction of the economy.


Industrial Production

Industrial production refers to the output of industrial establishments and covers sectors such as mining, manufacturing, electricity, gas and steam and air-conditioning. This indicator is measured in an index based on a reference period that expresses change in the volume of production output.


Initial Claims

Initial claims refers to the government report on the number of workers applying for unemployment benefits for the first time following job loss.


Bloomberg U.S. Leveraged Loan Index

The Bloomberg U.S. Leveraged Loan Index measures the performance of USD denominated, high-yield, floating-rate, institutional leveraged loan market.


U.S. Agg

Bloomberg U.S. Aggregate Bond Index

The Bloomberg U.S. Aggregate Bond Index is a broad-based flagship benchmark that measures the investment-grade, U.S. dollar-denominated, fixed-rate taxable bond market. The index includes Treasuries, government-related and corporate securities, MBS (agency fixed-rate pass-throughs), ABS, and CMBS (agency and non-agency).


Global Agg ex USD

Bloomberg Global Aggre-gate Index

The Bloomberg Global Aggregate Index is a flagship measure of global investment-grade debt from twenty-four local currency markets. This multi-currency benchmark includes Treasury, government-related, corporate, and securitized fixed-rate bonds from both developed and emerging markets issuers.


Municipal

Bloomberg Municipal Bond Index

The Bloomberg Municipal Bond Index covers the U.S. dollar-denominated long-term tax-exempt bond market. The index has four main sectors: state and local general obligation bonds, revenue bonds, insured bonds, and pre-refunded bonds.


Russell 3000

Russell 3000 Index

The Russell 3000 Index measures the performance of the largest 3,000 U.S. companies representing approximately 98% of the investable U.S. equity market. It is constructed to provide a comprehensive, unbiased, and stable barometer of the broad market and is completely reconstituted annually to ensure new and growing equities are included.


S&P 500

S&P 500 Index

The S&P 500 Index is a market capitalization-weighted index of 500 widely held stocks often used as a proxy for the stock market. It measures the movement of the largest issues. Standard and Poor’s chooses the member companies for the 500 based on market size, liquidity, and industry group representation. Included are the stocks of eleven different sectors.


MSCI EAFE (Dev)

MSCI EAFE Index

The MSCI EAFE Index (Europe, Australasia, Far East) captures large- and mid-cap representation across developed markets countries around the world, excluding the U.S. and Canada. The index covers approximately 85% of the free float-adjusted market capitalization in each country.


MSCI Emerging Markets

MSCI Emerging Markets Index

The MSCI Emerging Markets Index captures large- and mid-cap representation across emerging markets countries across the world. The index covers approximately 85% of the free float-adjusted market capitalization in each country.


HFRI FoF Comp.

HFRI Fund of Funds Composite Index

The HFRI Fund of Funds Composite Index is an equally weighted hedge fund of funds benchmark composed of global constituent funds. The underlying constituents are typically diversified among multiple managers and styles to provide a comprehensive representation of the hedge fund of funds investment space.


Nareit Developed Real Estate

FTSE EPRA/NAREIT

Developed Index

The FTSE EPRA/NAREIT Developed Index is designed to track the performance of listed real estate companies and REITS worldwide. Index constituents are free float-adjusted, subject to liquidity, size, and revenue screening for inclusion.


BBG Commodity

Bloomberg Commodity Index

The Bloomberg Commodity Index reflects commodity futures price movements and is calculated on an excess return basis. The index rebalances annually weighted 2/3 by trading volume and 1/3 by world production, and weight-caps are applied at the commodity, sector, and group level for diversification. The roll period typically occurs from the 6th-10th business day based on the roll schedule.


Developed World

MSCI World Index

The MSCI World Index captures large- and mid-cap representation across developed markets countries. The index covers approximately 85% of the free float-adjusted market capitalization in each country.


Asia Pacific

MSCI AC Asia Pacific Index

The MSCI AC Asia Pacific Index captures large and mid-cap representation across 5 Developed Markets countries and 8 Emerging Markets countries in the Asia Pacific region. With 1,537 constituents, the index covers approximately 85% of the free float-adjusted market capitalization in each country.


Asia Pacific ex Japan

MSCI AC Asia Pac ex. Japan

The MSCI AC Asia Pacific ex Japan Index captures large and mid-cap representation across 4 of 5 Developed Markets countries (excluding Japan) and 9 Emerging Markets countries in the Asia Pacific region. With 1,312 constituents, the index covers approximately 85% of the free float-adjusted market capitalization in each country.


Europe

MSCI Europe Index

The MSCI Europe Index captures large- and mid-cap representation across developed markets countries in Europe. The index covers approximately 85% of the free float-adjusted market capitalization across the European developed markets equity universe.


Comm. Services

S&P 500 Communication Services

The S&P 500® Communication Services comprises those companies included in the S&P 500 that are classified as members of the GICS® communication services sector.


Info Tech

S&P 500 Information Technology

The S&P 500® Information Technology comprises those companies included in the S&P 500 that are classified as members of the GICS® information technology sector.


Consumer Disc.

S&P 500 Consumer Discretionary

The S&P 500® Consumer Discretionary comprises those companies included in the S&P 500 that are classified as members of the GICS® Consumer Discretionary sector.


Industrials

S&P 500 Industrials

The S&P 500® Industrials comprises those companies included in the S&P 500 that are classified as members of the GICS® industrials sector.


Materials

S&P 500 Materials

The S&P 500® Materials comprises those companies included in the S&P 500 that are classified as members of the GICS® materials sector.


Energy

S&P 500 Energy

The S&P 500® Energy comprises those companies included in the S&P 500 that are classified as members of the GICS® energy sector.


Real Estate

S&P 500 Real Estate

The S&P 500® Real Estate comprises those companies included in the S&P 500 that are classified as members of the GICS® Real Estate sector.


Financials

S&P 500 Financials

The S&P 500® Financials comprises those companies included in the S&P 500 that are classified as members of the GICS® financials sector.


Consumer Staples

S&P 500 Consumer Staples

The S&P 500® Consumer Staples comprises those companies included in the S&P 500 that are classified as members of the GICS® consumer staples sector.


Health Care

S&P 500 Health Care

The S&P 500® Health Care comprises those companies included in the S&P 500 that are classified as members of the GICS® health care sector.


Utilities

S&P 500 Utilities

The S&P 500® Utilities comprises those companies included in the S&P 500 that are classified as members of the GICS® utilities sector.


ABS

Bloomberg US Asset-Backed Securities Index

The Bloomberg US ABS Index is a broad-based flagship benchmark that measures the investment-grade, US dollar-denominated, fixed-rate taxable bond market. The index only includes ABS securities.


U.S. High Yield

Bloomberg U.S. Corporate High-Yield Index

The Bloomberg U.S. Corporate High-Yield Index measures the U.S. dollar-denominated, high-yield, fixed-rate corporate bond market. Securities are classified as high yield if the middle rating of Moody’s, Fitch, and S&P is Ba1/BB+/BB+ or below. Bonds from issuers with an emerging markets country of risk, based on Barclays EM country definition, are excluded.


MBS

Bloomberg U.S. Mortgage-Backed Securities Index

The Bloomberg Mortgage-Backed Securities Index tracks fixed-rate agency mortgage-backed pass-through securities guaranteed by Ginnie Mae (GNMA), Fannie Mae (FNMA), and Freddie Mac (FHLMC). The index is constructed by grouping individual TBA-deliverable MBS pools into aggregates or generics based on program, coupon, and vintage.


TIPS

Bloomberg U.S. Treasury Inflation Notes 1-10 Year Index

The Bloomberg U.S. Treasury Inflation Notes 1-10 Year Index measures the performance of the U.S. Treasury Inflation-Protected Securities (TIPS) market with less than 10 years to maturity. TIPS are inflation-protected bonds (IPBs) that are issued by the U.S. Treasury. Their face value is pegged to the CPI and adjusted in step with changes in the rate of inflation.


Treasuries

Bloomberg U.S. Treasury Index

The Bloomberg U.S. Treasury Index measures U.S. dollar-denominated, fixed-rate, nominal debt issued by the U.S. Treasury. Treasury bills are excluded by the maturity constraint but are part of a separate Short Treasury Index. STRIPS are excluded from the index because their inclusion would result in double-counting.


EM Debt

Bloomberg Emerging Markets Tradeable Debt Index: Total Return

This index measures the performance of emerging market debt on a total return basis


Precious Metals

Bloomberg Precious Metals Subindex

Formerly known as Dow Jones-UBS Precious Metals Subindex (DJUBSPR), the index is a commodity group subindex of the Bloomberg CI. It is composed of futures contracts on gold and silver. It reflects the return of underlying commodity futures price movements only and is quoted in USD.


Industrial Metals

Bloomberg Industrial Metals Subindex

Formerly known as Dow Jones-UBS Industrial Metals Subindex (DJUBSIN), the index is composed of futures contracts on aluminum, copper, nickel and zinc. It reflects the return of underlying commodity futures price movements only. It is quoted in USD.


Energy

Bloomberg Energy Subindex

Formerly known as Dow Jones-UBS Energy Subindex (DJUBSEN), the index is a commodity group subindex of the Bloomberg CI. It is composed of futures contracts on crude oil, heating oil, unleaded gasoline and natural gas. It reflects the return of underlying commodity futures price movements only and is quoted in USD.


MLPs

Alerian MLP Index

The Alerian MLP Index is a float-adjusted, capitalization-weighted index whose constituents earn most of their cash flow from midstream activities involving energy commodities. It tracks energy infrastructure Master Limited Partnerships (MLPs).


Real Estate/REITs

FTSE EPRA/NAREIT

Developed Index

The FTSE EPRA/NAREIT Developed Index is designed to track the performance of listed real estate companies and REITS worldwide. Index constituents are free float-adjusted, subject to liquidity, size, and revenue screening for inclusion.


Infrastructure

S&P Global Infrastructure Index

The S&P Global Infrastructure Index is designed to track 75 companies from around the world chosen to represent the listed infrastructure industry while maintaining liquidity and tradability. To create diversified exposure, the index includes three distinct infrastructure clusters: energy, transportation, and utilities.


Agriculture

Bloomberg Agriculture Subindex

Formerly known as Dow Jones-UBS Agriculture Subindex (DJUBSAG), the index is a commodity group subindex of the Bloomberg CI. It is composed of futures contracts on coffee, corn, cotton, soybeans, soybean oil, soybean meal, sugar and wheat. It reflects the return of underlying commodity futures price movements only and is quoted in USD.


Fund of Funds

HFRI Fund of Funds

Composite Index

The HFRI Fund of Funds Composite Index is an equally weighted hedge fund of funds benchmark composed of global constituent funds. The underlying constituents are typically diversified among multiple managers and styles to provide a comprehensive representation of the hedge fund of funds investment space.


Equity Hedge Funds

HFRI Equity Hedge Index

The HFRI Equity Hedge Index is an equally weighted hedge fund benchmark composed of investment managers who maintain both long and short positions, primarily in equity and equity derivative securities. Equity hedge managers typically maintain at least 50% exposure to, and may in some cases be entirely invested in, equities, both long and short.


Global Macro

HFRI Macro Index

The HFRI Macro Index is an equally weighted hedge fund benchmark composed of investment managers that trade a broad range of strategies in which the investment process is predicated on movements in underlying economic variables and the impact these have on equity, fixed income, hard currency, and commodity markets. Managers employ a variety of techniques, both discretionary and systematic analysis, combinations of top-down and bottom-up theses, quantitative and fundamental approaches, and long- and short-term holding periods.


Event-Driven

HFRI Event-Driven Index

The HFRI Event-Driven Index is an equally weighted hedge fund benchmark composed of investment managers who maintain positions in companies currently or prospectively involved in corporate transactions of a wide variety, including but not limited to mergers, restructurings, financial distress, tender offers, shareholder buybacks, debt exchanges, security issuance, or other capital structure adjustments. Event-driven exposure includes a combination of sensitivities to equity markets, credit markets, and idiosyncratic, company-specific developments.


Relative Value

HFRI Relative Value Index

The HFRI Relative Value Index is an equally weighted hedge fund benchmark composed of investment managers who maintain positions in which the investment thesis is predicated on the realization of a valuation discrepancy in the relationship between multiple securities. Managers employ a variety of fundamental and quantitative techniques to establish investment theses, and security types can range broadly across equity, fixed income, derivative, or other security types.


Private Real Estate

NCREIF Property Index

The NCREIF Property Index is a quarterly, unleveraged composite total return for private commercial real estate properties held for investment purposes only. Constituents include operating apartment, hotel, industrial, office, and retail properties.


U.S. Large Cap

Russell 1000 Index

The Russell 1000 Index measures the performance of the large-cap segment of the U.S. equity universe. It is a subset of the Russell 3000 Index representing approximately 90% of the total market capitalization of that index. It includes approximately 1,000 of the largest securities based on a combination of their market cap and current index membership.


U.S. Mid Cap

Russell Midcap Index

The Russell Midcap Index measures the performance of the mid-cap segment of the U.S. equity universe. The Russell Midcap Index is a subset of the Russell 1000 Index. It includes approximately 800 of the smallest securities based on a combination of their market cap and current index membership. The Russell Midcap Index represents approximately 31% of the total market capitalization of the Russell 1000 companies.


U.S. Small Cap

Russell 2000 Index

The Russell 2000 Index measures the performance of the small-cap segment of the U.S. equity universe. It is a subset of the Russell 3000 Index representing approximately 10% of the total market capitalization of that index. It includes approximately 2,000 of the smallest securities based on a combination of their market cap and current index membership.


U.S. Core

Russell 1000 Index

The Russell 1000 Index measures the performance of the large-cap segment of the U.S. equity universe. It is a subset of the Russell 3000 Index representing approximately 90% of the total market capitalization of that index. It includes approximately 1,000 of the largest securities based on a combination of their market cap and current index membership.


U.S. Value

Russell 1000 Value Index

The Russell 1000 Value Index measures the performance of the large-cap value segment of the U.S. equity universe. It includes those Russell 1000 companies with lower price-to-book ratios and lower forecasted growth values.


U.S. Growth

Russell 1000 Growth Index

The Russell 1000 Growth Index measures the performance of the large-cap growth segment of the U.S. equity universe. It includes those Russell 1000 companies with higher price-to-book ratios and higher forecasted growth values.


International Large Cap

MSCI All Country World ex. U.S. Index

The MSCI All Country World ex U.S. Index captures large- and mid-cap representation across developed and emerging markets countries, excluding the U.S. The index covers approximately 85% of the global equity opportunity set outside the U.S.


International Mid Cap

MSCI All Country World ex. U.S. Mid Cap Index

The MSCI ACWI ex USA Mid Cap Index captures mid cap representation across 22 Developed Markets (DM) and 24 Emerging Markets (EM) countries*. With 1,208 constituents, the index covers approximately 15% of the free float-adjusted market capitalization in each country.


International Small Cap

MSCI All Country World ex. U.S. Small Cap Index

The MSCI ACWI ex USA Small Cap Index captures small cap representation across 22 of 23 Developed Markets (DM) countries (excluding the US) and 24 Emerging Markets (EM) countries*. With 4,263 constituents, the index covers approximately 14% of the global equity opportunity set outside the US.


International Core

MSCI All Country World ex. U.S. Index

The MSCI All Country World ex U.S. Index captures large- and mid-cap representation across developed and emerging markets countries, excluding the U.S. The index covers approximately 85% of the global equity opportunity set outside the U.S.


International Value

MSCI All Country World ex. U.S. Value Index

The MSCI ACWI ex USA Value Index captures large and mid-cap securities exhibiting overall value style characteristics across 22 Developed and 24 Emerging Markets countries*. The value investment style characteristics for index construction are defined using three variables: book value to price, 12-month forward earnings to price and dividend yield.


International Growth

MSCI All Country World ex. U.S. Growth Index

The MSCI ACWI ex USA Growth Index captures large and mid-cap securities exhibiting overall growth style characteristics across 22 Developed Markets (DM) countries and 24 Emerging Markets (EM) countries*. The growth investment style characteristics for index construction are defined using five variables: long-term forward EPS growth rate, short-term forward EPS growth rate, current internal growth rate and long-term historical EPS growth trend and long-term historical sales per share growth trend.


QUESTIONS?

Our Wealth Management team is ready to answer your questions and help you prepare for your future with a suite of planning solutions focused on you.

View as Webpage


LinkedIn

6135 Memorial Drive Suite 103, Dublin, OH 43017 | 614.380.3800