Third Quarter 2026 - Investment Newsletter

KEY TAKEAWAYS


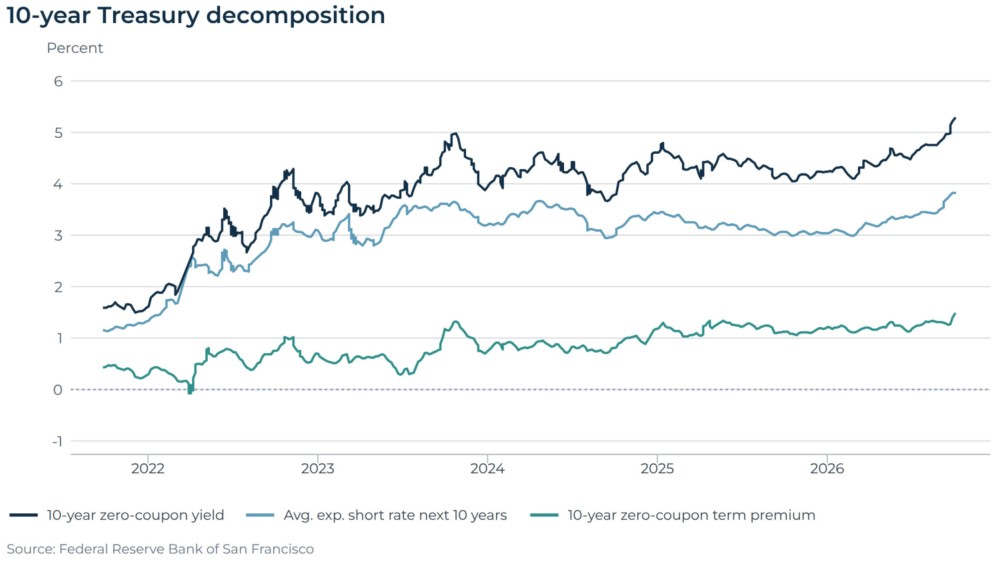
>> Resilient economic growth, persistent inflation, elevated fiscal deficits, and an uncertain monetary policy outlook prompted investors to reprice the Treasury curve, lifting the 10-year U.S. Treasury yield to its highest level in nearly two decades and reinforcing the transition toward a structurally different interest-rate environment.

>> Although rising borrowing costs created a more challenging financial backdrop, the U.S. economy continued to expand as business investment, stable employment, and household demand offset pressure in more rate-sensitive areas, while contained core inflation readings suggested that recent price increases remained concentrated in energy rather than spreading uniformly across the economy.

>> Stable employment conditions and continued, though moderating, wage growth helped sustain consumer spending, even as subdued sentiment and concerns about financing costs, energy prices, and the broader outlook led households to become more selective in their discretionary purchases.

>> Developments in the Middle East added to an already complex global environment by influencing energy supply, shipping routes, commodity prices, inflation expectations, and investor sentiment, demonstrating how geopolitical events can affect both the real economy and financial markets.

  • Strong corporate earnings and continued economic expansion helped equities advance during the quarter. Earnings growth outpaced share price gains, leading broad-market valuations to compress, although returns remained uneven across company size, sector, and geography.


  • Investment tied to artificial intelligence remained a significant driver of economic activity, supporting spending on semiconductors, cloud infrastructure, data centers, electrical equipment, and power generation. As capital continued to flow toward these areas, investors became increasingly focused on execution, competition, and the ability to translate investment into future earnings growth.


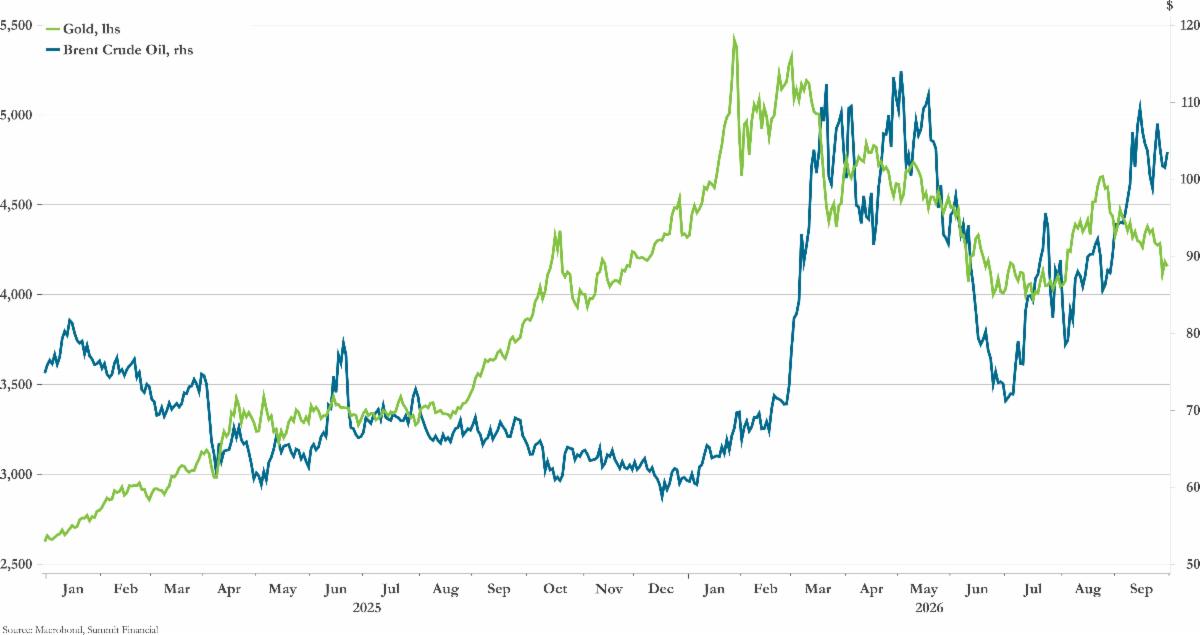
  • Comparatively high U.S. interest rates continued to support the dollar, while shifting supply expectations and geopolitical developments drove oil prices higher. Gold and other real assets also attracted investor interest as concerns about inflation, fiscal deficits, and geopolitical risk remained elevated.


  • As the Treasury curve repriced, most major investment-grade bond sectors generated negative returns, with municipal bonds suffering an especially difficult quarter. High-yield assets proved more resilient, as their higher income helped offset some of the price pressure.


  • Private-market fundamentals remained generally constructive, though opportunities and risks varied across sectors, as private equity activity recovered gradually, private real estate showed further signs of stabilization, infrastructure benefited from long-term power and digital-investment needs, and tighter credit spreads increased the importance of disciplined underwriting within private credit.


  • The quarter reinforced that investors are operating in a different environment than the one that prevailed for much of the post-Global Financial Crisis period. With higher interest rates, greater dispersion across asset classes, and a wider range of potential outcomes, diversification, disciplined security selection, and thoughtful portfolio construction remain increasingly important.


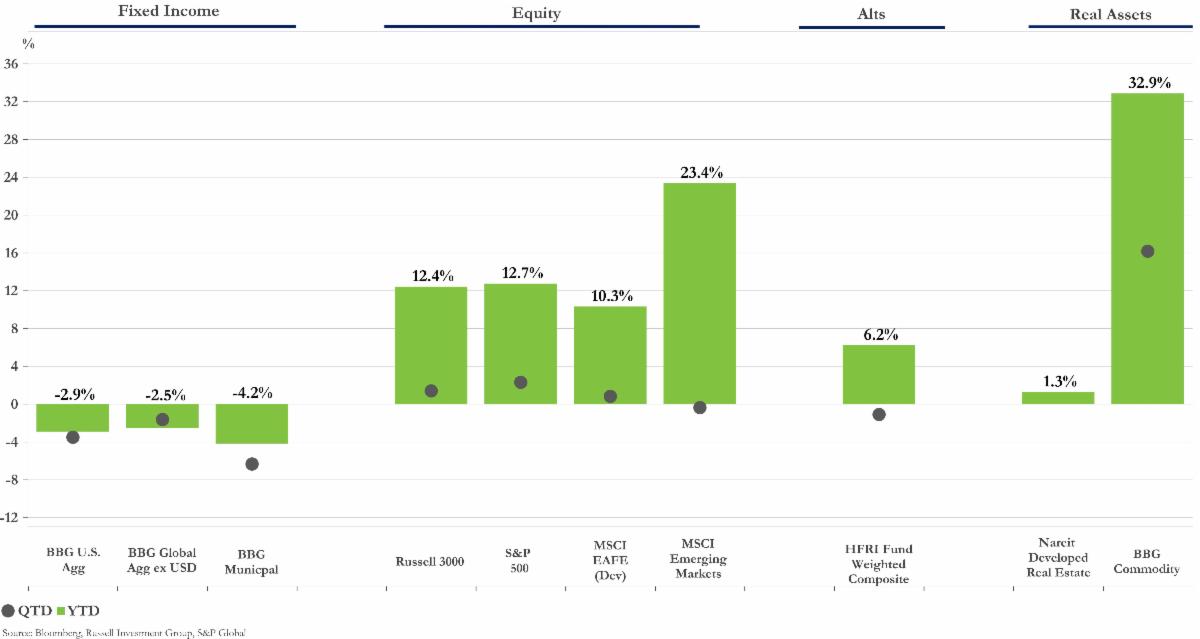
Asset Class Performance as of 9/30/2026


ECONOMY


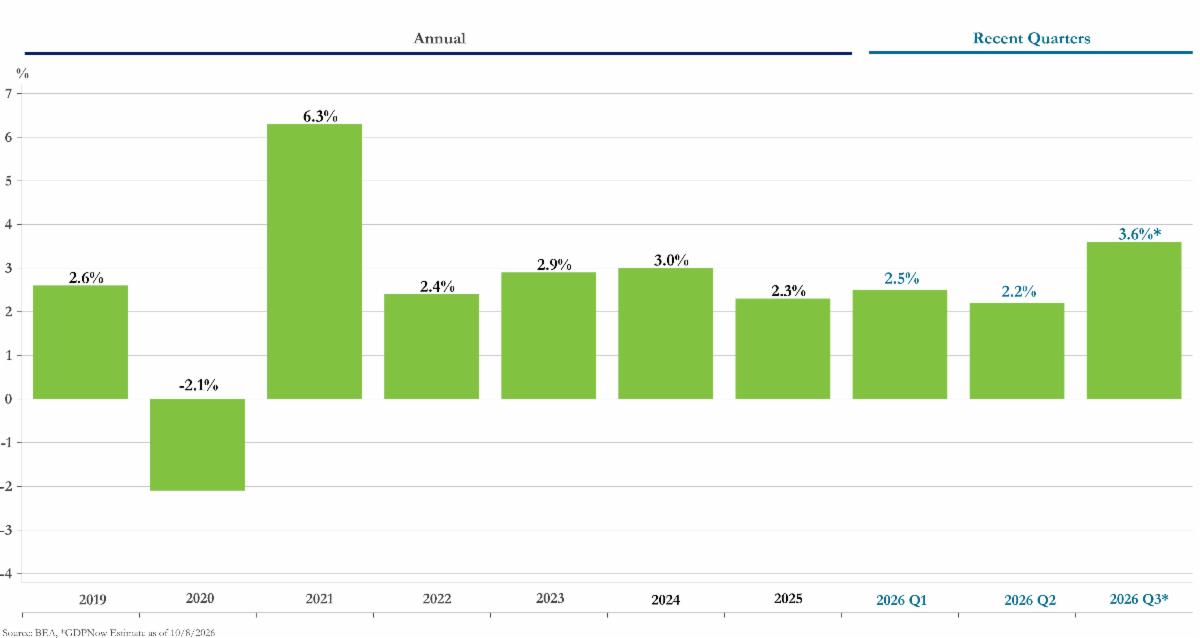
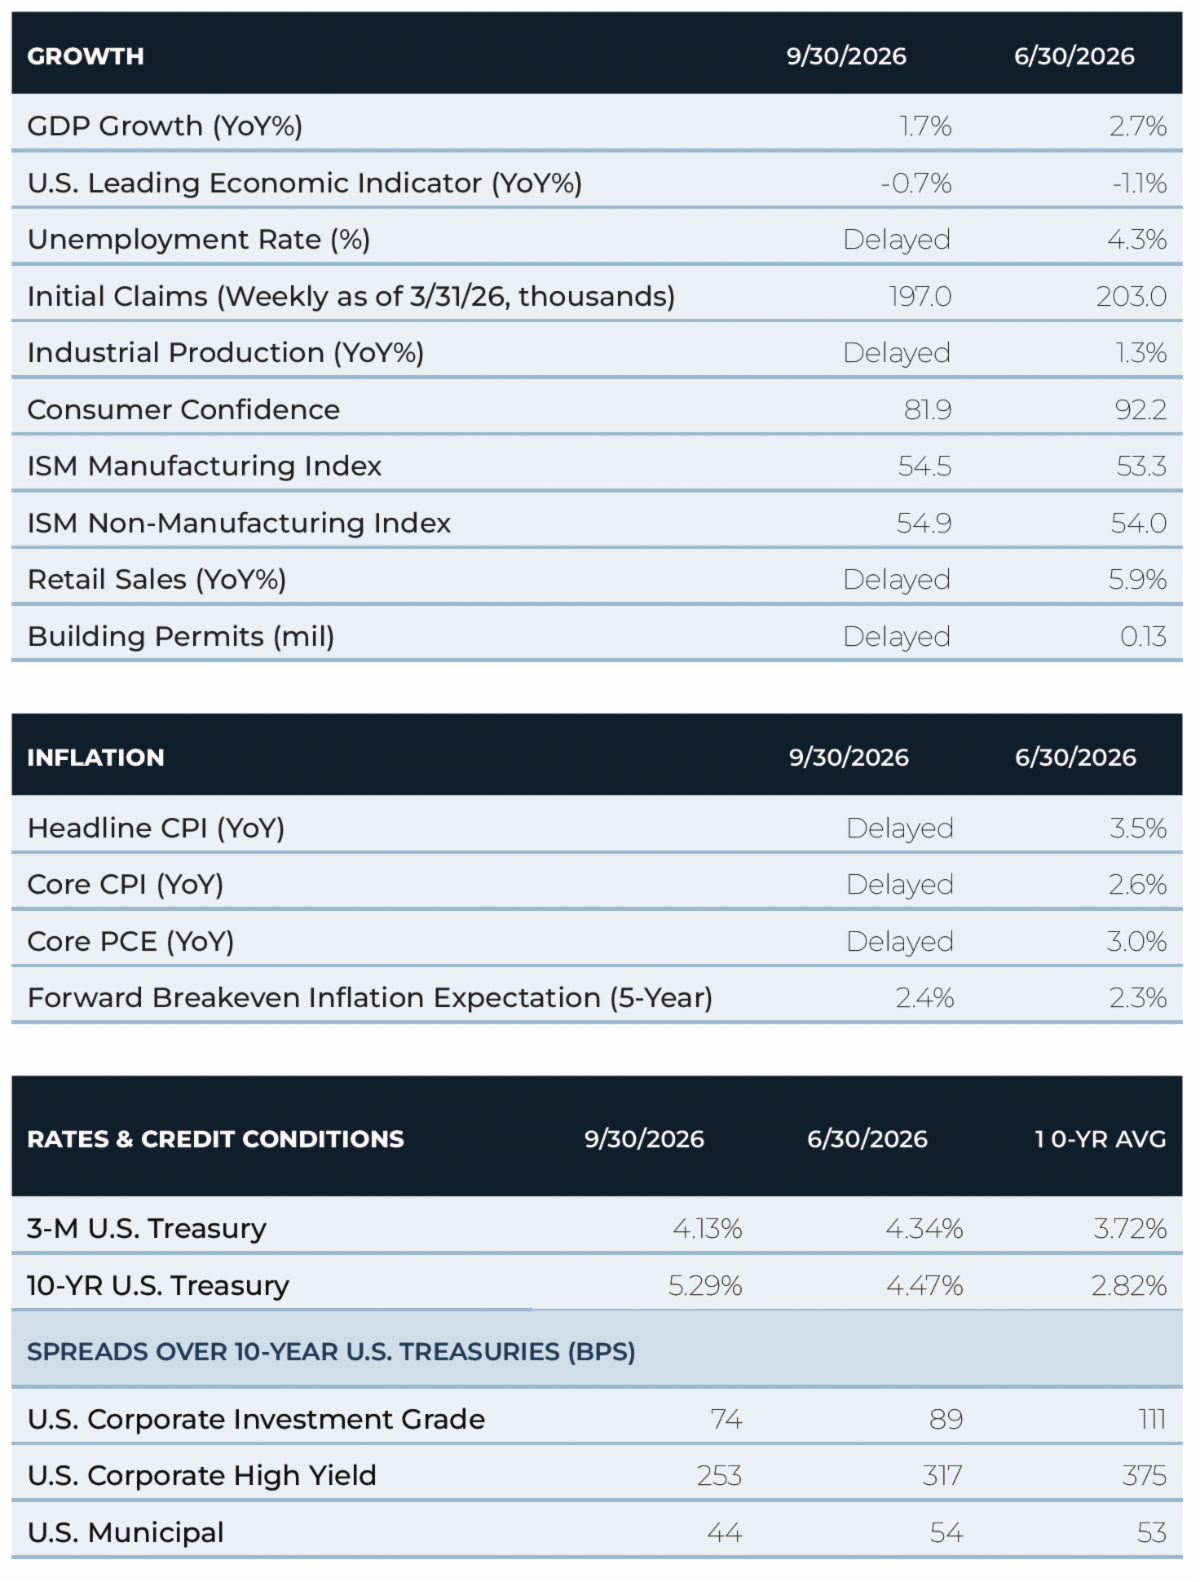
As the third quarter of 2026 came to a close, the U.S. economy continued to expand despite persistent inflation and more restrictive financial conditions. Growth moderated from the historically strong pace of the post-pandemic recovery, but recent data pointed more toward normalization than contraction as healthy corporate earnings, business investment, and consumer spending continued to support activity.


A meaningful share of business investment remained concentrated in the buildout of infrastructure supporting artificial intelligence, including semiconductors, cloud computing, data centers, electrical equipment, and power generation. Demand associated with these areas benefited manufacturers and supply chains throughout the economy, although the gains remained concentrated among a relatively narrow group of industries. Elsewhere, higher financing costs, uneven global demand, and geopolitical uncertainty created a more challenging backdrop for traditional manufacturing activity.


Consumers also continued to support economic growth as stable employment and positive income growth helped offset the effects of elevated borrowing costs and renewed inflation concerns. Labor-market conditions gradually normalized from the unusually tight environment that characterized earlier stages of the expansion, with job growth slowing, unemployment remaining comparatively stable, and wage gains moderating as supply and demand for labor became more balanced. While these developments helped ease some underlying inflation pressure, income growth remained sufficient to support household spending. Consumers nevertheless became more selective in discretionary purchases as sentiment remained subdued and concerns about energy expenses, credit costs, and the broader economic outlook weighed on confidence.


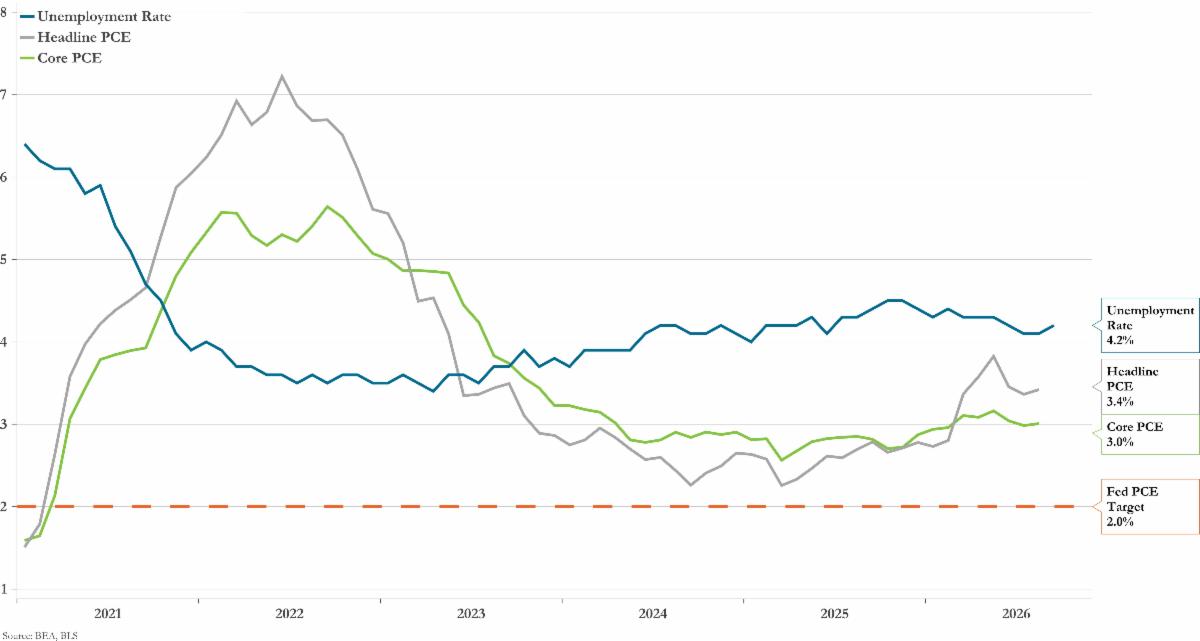
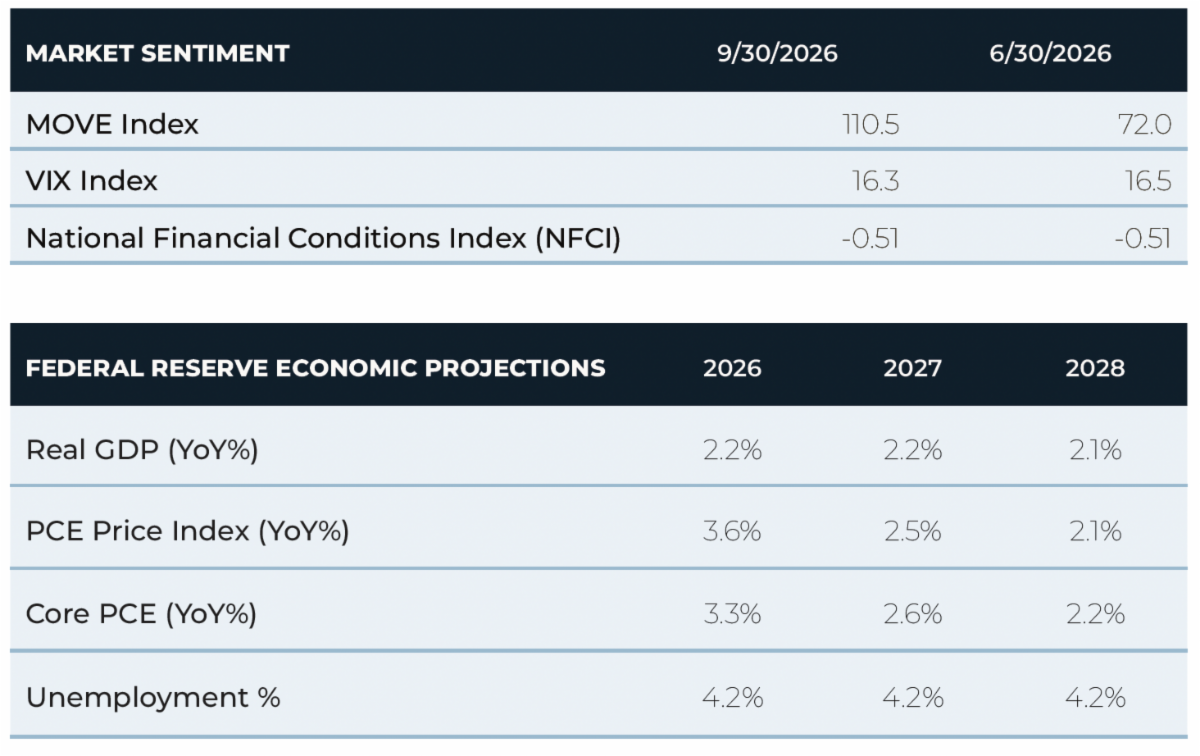
Inflation remained elevated but uneven across categories. Higher energy prices contributed to renewed pressure on headline measures and slowed progress toward central-bank targets, while more contained core readings suggested that underlying inflation was not accelerating as broadly across the economy. This divergence provided important context for the Federal Reserve's September decision to raise its policy rate by 25 basis points while maintaining a data-dependent approach toward future decisions. With economic activity remaining resilient and inflation still above target, investors entered the fourth quarter focused on whether further progress could be achieved without a more meaningful slowdown in growth.


U.S. GDP Growth


Inflation and Policy Implications


  • The gap between headline and core inflation suggested that recent price pressures remained concentrated in a handful of categories rather than broadening across the economy.


  • September's rate increase reflected the Federal Reserve's concern that resilient growth and inflation could slow progress toward its 2% target.


  • If policy becomes more restrictive, the greatest pressure would likely fall on housing, capital-intensive industries, and consumer segments most reliant on credit.


  • Elevated fiscal deficits and government borrowing may help keep long-term Treasury yields above post-Global Financial Crisis norms even if short-term rates eventually decline.


Unemployment and PCE Inflation


MARKETS


Equity Markets


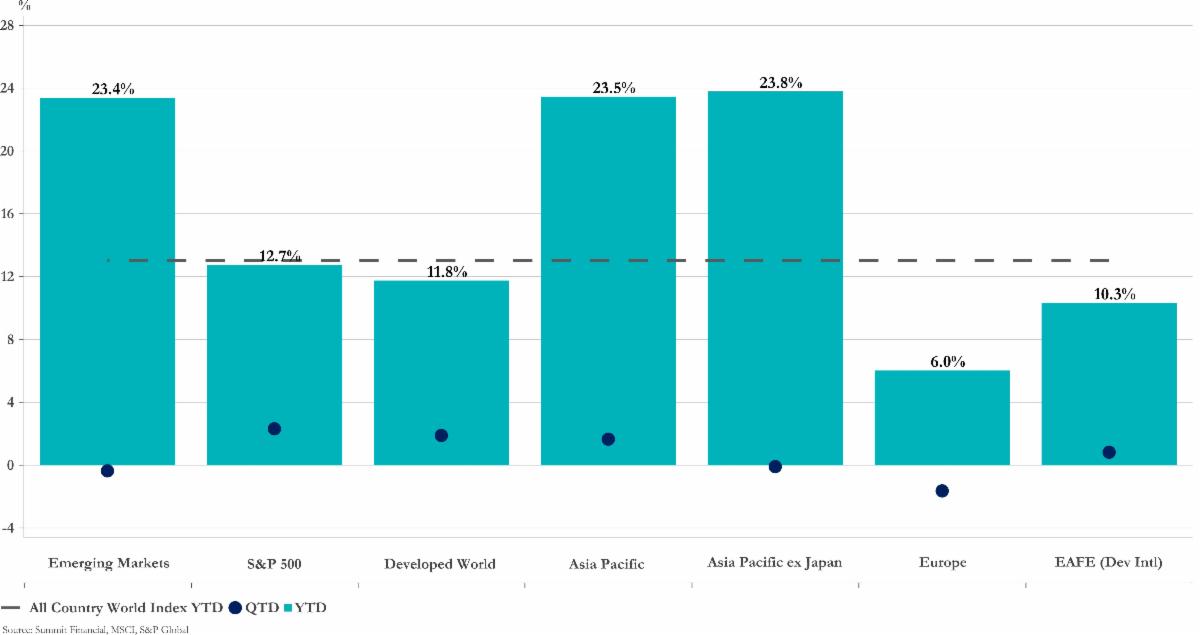
Global equities advanced during the third quarter, although gains moderated from the exceptional performance recorded in Q2 as investors placed greater emphasis on earnings visibility, valuation, and balance-sheet strength. Healthy corporate results and continued economic expansion allowed U.S. large-cap stocks to absorb the pressure created by rising bond yields, higher energy prices, and uncertainty surrounding monetary policy, helping the S&P 500 gain approximately 2.3% while broader U.S. equity performance remained more subdued.


The strength of corporate earnings was particularly important to the quality of the market’s advance because earnings growth exceeded positive price appreciation, allowing broad-market valuations to compress during the quarter. Rather than depending primarily on further multiple expansion, returns were supported by improving underlying fundamentals, although investors became less willing to overlook elevated valuations or uncertain paths to profitability.


Continued investment in semiconductors, cloud computing, data centers, and related digital infrastructure supported many of the market’s largest technology companies, but enthusiasm became more selective as attention shifted toward the timing and magnitude of future returns. Companies already converting investment into revenue, earnings, and cash flow generally received a more favorable response than businesses whose valuations remained heavily dependent on longer-term expectations.


As investors reassessed the consequences of more expensive financing, small-cap stocks surrendered part of their second-quarter outperformance because smaller businesses tend to rely more heavily on external funding and floating-rate debt. The increase in discount rates also reduced the valuation support previously available to longer-duration and rate-sensitive equities, although continued domestic growth and improving access to capital helped prevent more widespread weakness.


Outside the United States, developed-market equities generated modest gains while emerging-market stocks edged lower. A firmer dollar, higher energy-import costs, and tighter global financial conditions created headwinds for economies more dependent on external financing or imported commodities, but continued economic growth and generally resilient corporate earnings helped prevent a broader deterioration in global risk appetite.


By the end of the quarter, the market’s changing tone was more consistent with greater differentiation than with a breakdown in equity fundamentals. Companies with durable cash flows, manageable financing requirements, demonstrated earnings growth, and credible plans for converting investment into profitability generally proved more resilient, reinforcing the value of diversification across company size, sector, geography, and investment style.


Global Equity Market Performance


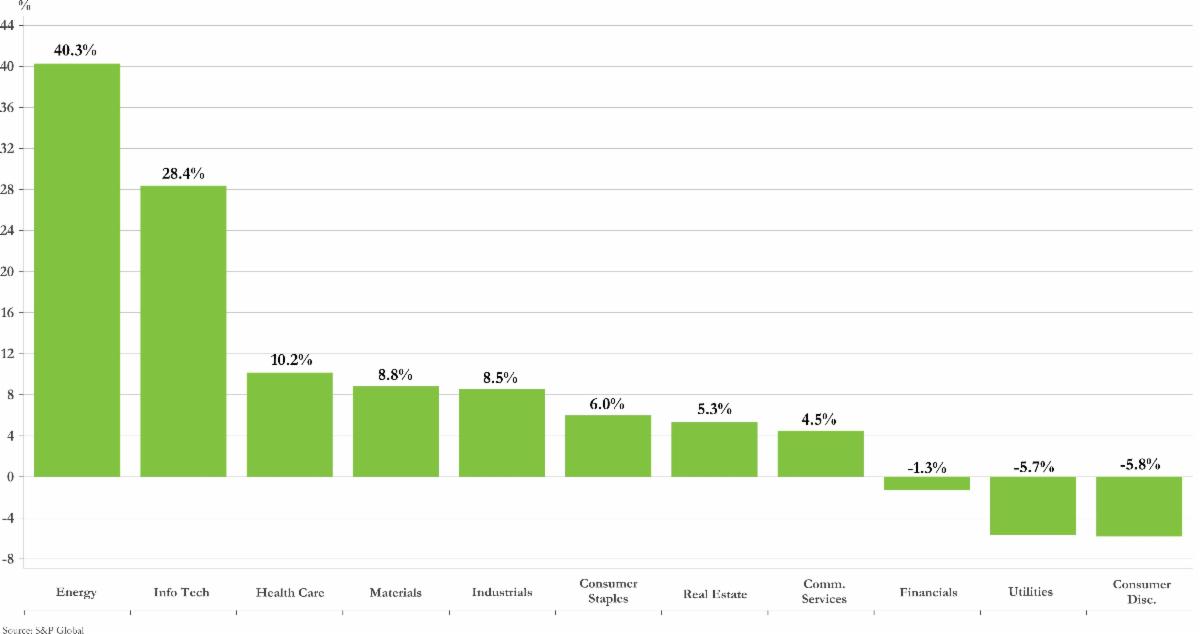
S&P 500 Sector Divergence


  • As concerns about global supply and potential disruptions returned, higher oil prices helped Energy recover sharply from the weakness it experienced during the second quarter.


  • Although continued spending on artificial intelligence and digital infrastructure supported Technology, elevated valuations and increased scrutiny of prospective returns on capital encouraged investors to distinguish more carefully among companies.


  • While defensive earnings characteristics helped Health Care, economically sensitive sectors produced more varied results as continued growth supported revenues but higher financing costs placed additional pressure on margins and valuations.


  • With Treasury securities offering more competitive income and higher discount rates weighing on asset values, Real Estate and other rate-sensitive sectors lagged the broader market during the quarter.


S&P 500 Sector Returns - YTD 2026


Fixed Income Markets


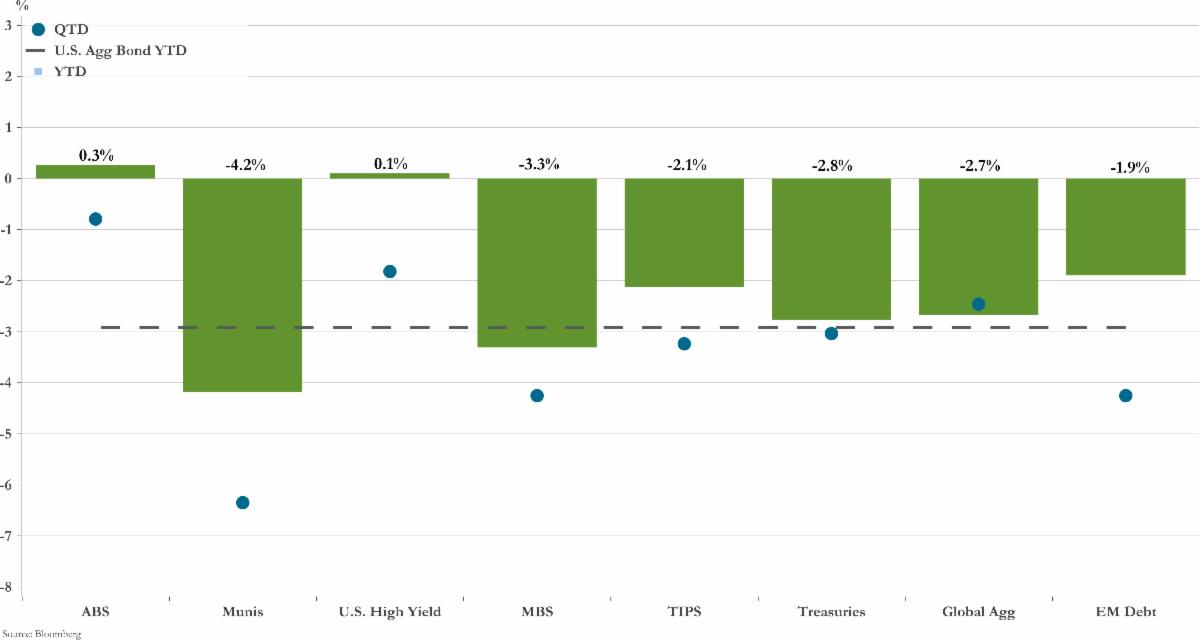
The repricing of the Treasury curve created a challenging environment for fixed-income investors during the third quarter, producing negative returns across most investment-grade sectors. The Bloomberg U.S. Aggregate Bond Index declined 3.5%, while Treasury securities fell approximately 3.0%. Mortgage-backed securities were among the weakest areas as interest-rate volatility and wider spreads weighed on performance, while high-yield bonds proved comparatively resilient because elevated coupon income offset much of the pressure from higher rates and modest spread widening.


Treasury yields moved higher as investors reassessed the outlook for economic growth, inflation, and monetary policy. Resilient economic activity and persistent inflation reinforced expectations that policy could remain restrictive for longer, while elevated fiscal deficits, increased Treasury issuance, and a changing global yield environment contributed additional upward pressure on longer-term rates. The largest adjustment occurred in the intermediate portion, or belly, of the curve, where investors revised expectations regarding the future path of Federal Reserve policy.


Rate volatility remained a defining feature of the quarter as shifting expectations for growth, inflation, and policy led to significant fluctuations in Treasury yields. Those moves affected more than bond portfolios, influencing corporate borrowing costs, mortgage rates, real-estate valuations, and the discount rates used across financial markets.


Credit performance reflected greater selectivity rather than broad deterioration. Investment-grade spreads widened only modestly, while high-yield spreads increased by a greater amount. Despite that move, high-yield bonds generated slightly positive returns as strong coupon income offset much of the impact from higher Treasury yields, suggesting investors remained willing to assume credit risk when adequately compensated.


Municipal bonds experienced an especially difficult quarter as rising Treasury yields, record issuance, and tax-loss harvesting pressured valuations. The Bloomberg Municipal Bond Index declined 6.35%, particularly affecting longer-duration securities. Although the near-term results were disappointing, the resulting increase in municipal and taxable-equivalent yields improved prospective income and return potential for long-term investors. Entering the fourth quarter, higher starting yields provided a larger income cushion and strengthened the potential for bonds to contribute meaningful income and diversification within portfolios.


Fixed Income Sector Performance


Bond Market Signals


  • Expectations for future Federal Reserve policy drove much of the repricing, with the largest increase occurring in the intermediate portion of the Treasury curve.


  • Fiscal deficits, Treasury supply, and shifting global bond-market relative value also contributed to higher long-term yields.


  • Investment-grade spreads widened modestly, while larger moves in high yield reflected greater selectivity rather than broad credit deterioration.


  • Municipal underperformance lifted municipal and taxable-equivalent yields, improving the longer-term opportunity set despite continued volatility.


REAL ASSETS


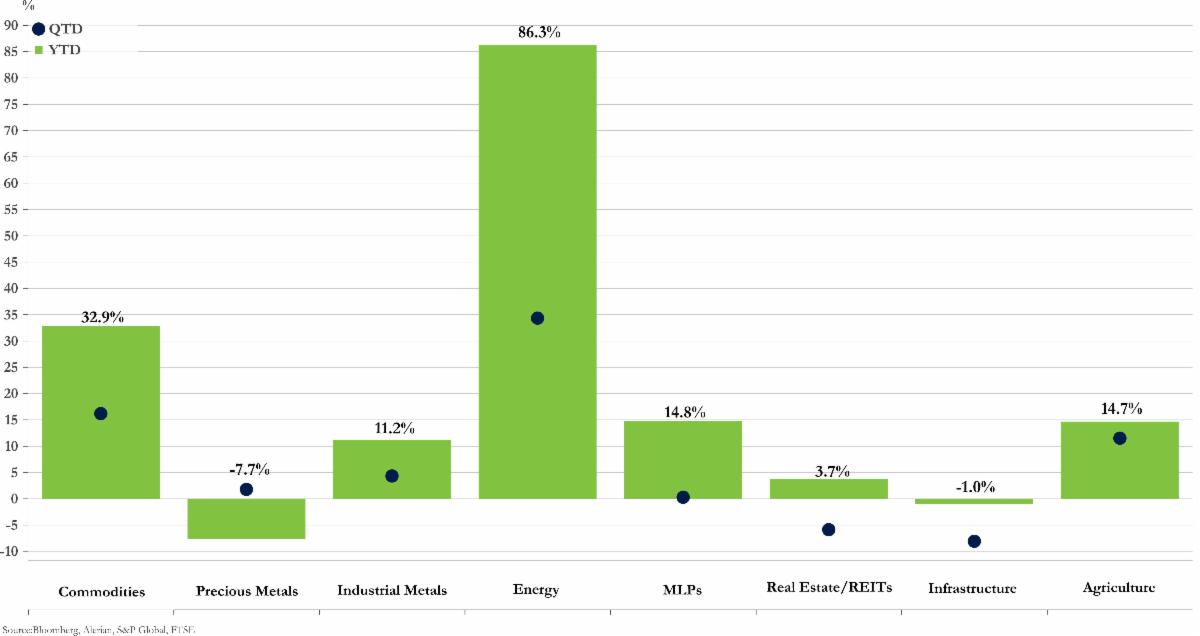
Sharp differences in performance across public real assets demonstrated that these investments do not respond uniformly to inflation, economic growth, or changing financial conditions. Commodity-oriented exposures benefited from a combination of cyclical, geopolitical, and diversification demand, while the increase in long-term bond yields placed pressure on listed real estate and portions of the infrastructure market.


After weakening during the second quarter, commodities ranked among the strongest-performing asset classes as renewed supply concerns supported energy and inflation, fiscal uncertainty, and geopolitical risk increased demand for precious metals. Industrial metals continued to benefit from longer-term spending on electrification, power infrastructure, and digital development, although their near-term results remained sensitive to changes in global growth and physical supply conditions.


Within infrastructure, performance varied according to business model and capital intensity. For the year, Midstream energy companies benefited from stronger commodity markets while continuing to generate much of their revenue through fee-based transportation, processing, and storage activities. Utilities and other capital-intensive segments of listed infrastructure were more sensitive to higher bond yields, although electricity generation, transmission, grid modernization, and digital infrastructure continued to benefit from durable investment requirements.


The increase in Treasury yields created a particularly challenging environment for listed real estate by raising the income available from bonds and placing additional pressure on the valuations of yield-oriented equities. Property-level fundamentals nevertheless remained highly differentiated, with healthy occupancy and constrained new construction supporting several property types while offices continued to face structural challenges in many markets.


Demand for artificial intelligence and cloud computing provided support for data centers, but the sector’s substantial power and capital requirements also heightened the importance of financing conditions, electrical capacity, and execution. These structural tailwinds were therefore insufficient to overcome the broader valuation pressure affecting listed real estate during the quarter.


A decline in market yields would improve the outlook for listed real estate and capital-intensive infrastructure, while persistent inflation or renewed supply disruptions could continue to favor commodity-oriented exposures. Because capital intensity, financing costs, supply dynamics, and valuation affect each segment differently, the quarter reinforced the value of diversified real-asset exposure rather than reliance on a single investment to respond consistently to inflation or economic uncertainty.


Real Assets Performance


Energy and Precious Metals Rebound


  • After weakening during the second quarter, crude oil recovered as geopolitical developments and renewed uncertainty surrounding supply restored a risk premium to energy markets.


  • Because tighter inventories left less capacity to absorb unexpected changes in production or transportation, oil prices became more sensitive to uncertainty surrounding shipping routes and potential supply disruptions.


  • While energy responded primarily to supply conditions and geopolitical developments, precious metals attracted demand related to inflation concerns, fiscal uncertainty, geopolitical risk, and the desire for portfolio diversification.


  • By responding to a different combination of economic and market forces than listed real estate and infrastructure, commodities demonstrated why diversification among real-asset categories can be as important as the size of the overall allocation.


Gold & Brent Crude Oil Spot Prices


ALTERNATIVES


A resilient economy and continued demand for data centers, power generation, and digital infrastructure provided a constructive foundation for private markets during the third quarter, although the recovery remained uneven across strategies. Constrained liquidity, elevated valuations, and expensive financing made the environment more demanding, increasing the importance of manager selection, disciplined entry prices, and the ability to create value through operating improvements rather than relying primarily on leverage or multiple expansion.


Within private equity, deal activity improved from recent lows, particularly in the small- and middle-market, but remained below the levels typically associated with more liquid financing conditions. As slower exit activity kept portfolio companies private for longer, secondary transactions and continuation vehicles continued to provide important sources of liquidity for investors and fund managers seeking to manage aging holdings and generate distributions.


Greater financing costs also changed the sources from which private equity managers could reasonably expect to create value. Revenue growth, margin improvement, and operational execution became increasingly important as leverage and multiple expansion provided less reliable support. Although technology-related companies continued to attract capital, elevated valuations increased the need to distinguish between businesses already benefiting from durable demand and those whose investment cases depended more heavily on the future adoption of artificial intelligence.


Attractive income and floating-rate structures continued to support investor demand for private credit, but tighter spreads and higher debt-service burdens created a smaller margin for underwriting error. Refinancing requirements, redemption activity in some semi-liquid vehicles, and select software-related exposures warranted attention as weaker borrowers encountered greater difficulty absorbing financing costs.


Beyond traditional direct lending, asset-based finance, real estate debt, special situations, and credit secondaries expanded the range of opportunities available to investors seeking income and complexity premiums. As private markets assume a larger role in financing companies and physical assets, asset-based strategies and private high-grade lending are expected to represent meaningful areas of growth.


Improved transaction activity and a gradual stabilization in property values provided further evidence that conditions in private real estate were becoming more balanced after a prolonged period of adjustment. Reduced construction began to create a more favorable medium-term supply backdrop, although results continued to vary considerably by property type. Multifamily, industrial, select retail, and specialized sectors benefited from structural demand, while office properties remained challenged across many markets.


Financing conditions created a meaningful separation between well-capitalized owners and borrowers facing near-term maturities. Owners with access to liquidity were better positioned to manage refinancing needs or pursue acquisitions, while highly leveraged borrowers faced a narrower set of options, potentially creating opportunities for investors able to provide flexible capital.


Long-term requirements for data centers, electrification, electricity generation, energy security, and grid modernization continued to attract substantial private-infrastructure investment. Contractual or regulated revenue models can provide stable cash flows and a degree of inflation sensitivity, but increasing competition and higher valuations made disciplined underwriting and careful project selection more important.


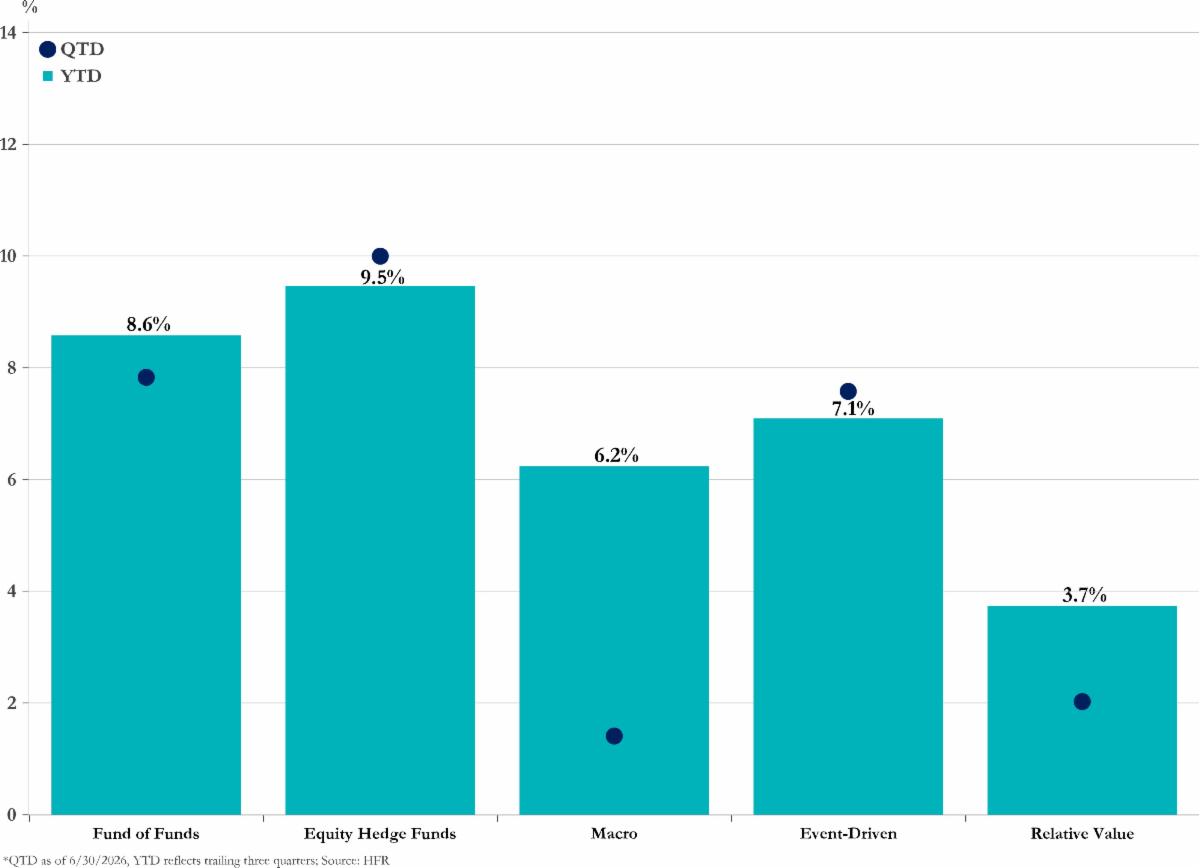
Greater dispersion across equities, credit, rates, currencies, and commodities created opportunities for macro, relative-value, and trading-oriented hedge-fund strategies as investors navigated changing monetary policy expectations and geopolitical volatility. Across the alternatives landscape, the wide range of outcomes reinforced the importance of portfolio construction, liquidity management, manager selection, and a clear understanding of the role each strategy is intended to play within a broader portfolio.


Alternatives Performance


Market Data


DISCLAIMER

Compliance Code: 9174519.1


This commentary was authored by the investment team at Summit Financial, LLC., an SEC Registered Investment Adviser (“Summit”), headquartered at 4 Campus Drive, Parsippany, NJ 07054, Tel. 973-285-3600. It is provided for your information and guidance and is not intended as specific advice and does not constitute an offer to sell securities. Summit is an investment adviser and offers asset management and financial planning services. Indices are unmanaged and cannot be invested into directly.


Data in this newsletter is obtained from sources which we, and our suppliers believe to be reliable, but we do not warrant or guarantee the timeliness or accuracy of this information. Consult your financial professional before making any investment decision. Past performance is no guarantee of future results. Diversification/asset allocation does not ensure a profit or guarantee against a loss. Economic and market forecasts presented herein reflect our judgment as of the date of this presentation and are subject to change without notice. Any forecasts are subject to high levels of uncertainty that may affect actual performance. Accordingly, forecasts should be viewed as merely representative of a broad range of possible outcomes. Forecasts are estimated, based on assumptions, and are subject to significant revision and may change materially as economic and market conditions change. Forecasts do not take into account the specific investment objectives, restrictions, tax and financial situation or other needs of any specific client.


DEFINITIONS & DESCRIPTIONS

CBOE Volatility Index (VIX)

The CBOE Volatility Index (VIX) reflects the market’s real-time expectation of 30-day forward-looking volatility. It is created by the Chicago Board of Options Exchange (CBOE).


National Financial Conditions Index (NFCI)

The Chicago Fed’s National Financial Conditions Index (NFCI) provides a comprehensive weekly update on U.S. financial conditions in money markets, debt and equity markets, and the traditional and “shadow” banking systems


Consumer Confidence Index

The Consumer Confidence Index is a measure based on a survey administered by The Conference Board that reflects prevailing business conditions and likely developments for the months ahead. This monthly report details consumer attitude, buying intentions, vacation plans, and consumer expectations for inflation, stock prices, and interest rates.


Consumer Price Index

The Consumer Price Index (CPI) is a measure of the average change over time in the prices paid by urban consumers for a market basket of consumer goods and services.


Core Inflation

Core Inflation is a measure of economic inflation that excludes food and energy


Headline Inflation

Headline Inflation is a measure of the total economic inflation that includes food and energy prices


ISM Manufacturing Index

The ISM Manufacturing Index, also known as the purchasing managers’ index (PMI), is a monthly indicator of U.S. economic activity based on a survey of executives covering all North American Industry Classification System’s businesses in the manufacturing sector.


ISM Non-Manufacturing Index

The ISM Non-Manufacturing Index is a monthly indicator of U.S. economic activity based on a survey of executives covering all North American Industry Classification System’s businesses in the services (or non-manufacturing) sector.


Leading economic indicators (LEI)

Leading economic indicators (LEI) are statistics that precede economic events. They predict the next phase of the business cycle.


Merrill Lynch Option Volatility Estimate Index (MOVE Index)

The MOVE index, or Merrill Lynch Option Volatility Estimate Index, is a gauge of interest rate volatility in the U.S. Treasury market. It is calculated from options prices, which reflect the collective expectations of market participants about future volatility. The index measures the implied volatility of U.S. Treasury options across various maturities


OECD Composite leading indicators (CLIs)

The OECD Composite leading indicators (CLIs), designed to anticipate turning points in economic activity relative to trend


Personal Consumption Expenditures Price Index (PCE)

Personal Consumption Expenditures Price Index (PCE) is a measure of the prices that people living in the United States, or those buying on their behalf, pay for goods and services. The PCE price index is known for capturing inflation (or deflation) across a wide range of consumer expenses and reflecting changes in consumer behavior


The Federal Funds Rate

The Federal Funds Rate is the target interest rate range at which commercial banks borrow and lend their excess reserves to each other overnight, which is set by the Federal Open Market Committee (FOMC)


Treasury Bill (T-Bill)

A Treasury Bill (T-Bill) is a short-term U.S. government debt obligation backed by the Treasury Department with a maturity of one year or less;


U-3 unemployment rate

The U-3 unemployment rate is the most commonly reported rate in the United States, representing the number of unemployed people actively seeking a job


United States Industrial Production

United States Industrial production refers to the output of industrial establishments and covers sectors such as mining, manufacturing, electricity, gas, steam, and air-conditioning. This indicator is measured in an index based on a reference period that expresses change in the volume of production output;


Consumer Sentiment

Consumer Sentiment is represented by The University of Michigan Consumer Sentiment Index which rates the relative level of current and future economic conditions.


Building Permits

Building Permits measures the change in the number of new building permits issued by the government. Building permits are a key indicator of demand in the housing market.


Retail Sales

Retail sales are an economic metric that tracks consumer demand for finished goods. This figure is a very important data set as it is a key monthly market-moving event. Retail sales are reported each month by the U.S. Census Bureau and indicate the direction of the economy.


Industrial Production

Industrial production refers to the output of industrial establishments and covers sectors such as mining, manufacturing, electricity, gas and steam and air-conditioning. This indicator is measured in an index based on a reference period that expresses change in the volume of production output.


Initial Claims

Initial claims refers to the government report on the number of workers applying for unemployment benefits for the first time following job loss.


Bloomberg U.S. Leveraged Loan Index

The Bloomberg U.S. Leveraged Loan Index measures the performance of USD denominated, high-yield, floating-rate, institutional leveraged loan market.

U.S. Agg

Bloomberg U.S. Aggregate Bond Index

The Bloomberg U.S. Aggregate Bond Index is a broad-based flagship benchmark that measures the investment-grade, U.S. dollar-denominated, fixed-rate taxable bond market. The index includes Treasuries, government-related and corporate securities, MBS (agency fixed-rate pass-throughs), ABS, and CMBS (agency and non-agency).


Global Agg ex USD

Bloomberg Global Aggregate Index

The Bloomberg Global Aggregate Index is a flagship measure of global investment-grade debt from twenty-four local currency markets. This multi-currency benchmark includes Treasury, government-related, corporate, and securitized fixed-rate bonds from both developed and emerging markets issuers.


Municipal

Bloomberg Municipal Bond Index

The Bloomberg Municipal Bond Index covers the U.S. dollar-denominated long-term tax-exempt bond market. The index has four main sectors: state and local general obligation bonds, revenue bonds, insured bonds, and pre-refunded bonds.


Russell 3000

Russell 3000 Index

The Russell 3000 Index measures the performance of the largest 3,000 U.S. companies representing approximately 98% of the investable U.S. equity market. It is constructed to provide a comprehensive, unbiased, and stable barometer of the broad market and is completely reconstituted annually to ensure new and growing equities are included.


S&P 500

S&P 500 Index

The S&P 500 Index is a market capitalization-weighted index of 500 widely held stocks often used as a proxy for the stock market. It measures the movement of the largest issues. Standard and Poor’s chooses the member companies for the 500 based on market size, liquidity, and industry group representation. Included are the stocks of eleven different sectors.


MSCI EAFE (Dev)

MSCI EAFE Index

The MSCI EAFE Index (Europe, Australasia, Far East) captures large- and mid-cap representation across developed markets countries around the world, excluding the U.S. and Canada. The index covers approximately 85% of the free float-adjusted market capitalization in each country.


MSCI Emerging Markets

MSCI Emerging Markets Index

The MSCI Emerging Markets Index captures large- and mid-cap representation across emerging markets countries across the world. The index covers approximately 85% of the free float-adjusted market capitalization in each country.


HFRI FoF Comp.

HFRI Fund of Funds Composite Index

The HFRI Fund of Funds Composite Index is an equally weighted hedge fund of funds benchmark composed of global constituent funds. The underlying constituents are typically diversified among multiple managers and styles to provide a comprehensive representation of the hedge fund of funds investment space.


Nareit Developed Real Estate

FTSE EPRA/NAREIT

Developed Index

The FTSE EPRA/NAREIT Developed Index is designed to track the performance of listed real estate companies and REITS worldwide. Index constituents are free float-adjusted, subject to liquidity, size, and revenue screening for inclusion.


BBG Commodity

Bloomberg Commodity Index

The Bloomberg Commodity Index reflects commodity futures price movements and is calculated on an excess return basis. The index rebalances annually weighted 2/3 by trading volume and 1/3 by world production, and weight-caps are applied at the commodity, sector, and group level for diversification. The roll period typically occurs from the 6th-10th business day based on the roll schedule.


Developed World

MSCI World Index

The MSCI World Index captures large- and mid-cap representation across developed markets countries. The index covers approximately 85% of the free float-adjusted market capitalization in each country.


Asia Pacific

MSCI AC Asia Pacific Index

The MSCI AC Asia Pacific Index captures large and mid-cap representation across 5 Developed Markets countries and 8 Emerging Markets countries in the Asia Pacific region. With 1,537 constituents, the index covers approximately 85% of the free float-adjusted market capitalization in each country.


Asia Pacific ex Japan

MSCI AC Asia Pac ex. Japan

The MSCI AC Asia Pacific ex Japan Index captures large and mid-cap representation across 4 of 5 Developed Markets countries (excluding Japan) and 9 Emerging Markets countries in the Asia Pacific region. With 1,312 constituents, the index covers approximately 85% of the free float-adjusted market capitalization in each country.


Europe

MSCI Europe Index

The MSCI Europe Index captures large- and mid-cap representation across developed markets countries in Europe. The index covers approximately 85% of the free float-adjusted market capitalization across the European developed markets equity universe.


Comm. Services

S&P 500 Communication Services

The S&P 500® Communication Services comprises those companies included in the S&P 500 that are classified as members of the GICS® communication services sector.


Info Tech

S&P 500 Information Technology

The S&P 500® Information Technology comprises those companies included in the S&P 500 that are classified as members of the GICS® information technology sector.


Consumer Disc.

S&P 500 Consumer Discretionary

The S&P 500® Consumer Discretionary comprises those companies included in the S&P 500 that are classified as members of the GICS® Consumer Discretionary sector.


Industrials

S&P 500 Industrials

The S&P 500® Industrials comprises those companies included in the S&P 500 that are classified as members of the GICS® industrials sector.


Materials

S&P 500 Materials

The S&P 500® Materials comprises those companies included in the S&P 500 that are classified as members of the GICS® materials sector.


Energy

S&P 500 Energy

The S&P 500® Energy comprises those companies included in the S&P 500 that are classified as members of the GICS® energy sector.


Real Estate

S&P 500 Real Estate

The S&P 500® Real Estate comprises those companies included in the S&P 500 that are classified as members of the GICS® Real Estate sector.


Financials

S&P 500 Financials

The S&P 500® Financials comprises those companies included in the S&P 500 that are classified as members of the GICS® financials sector.


Consumer Staples

S&P 500 Consumer Staples

The S&P 500® Consumer Staples comprises those companies included in the S&P 500 that are classified as members of the GICS® consumer staples sector.


Health Care

S&P 500 Health Care

The S&P 500® Health Care comprises those companies included in the S&P 500 that are classified as members of the GICS® health care sector.


Utilities

S&P 500 Utilities

The S&P 500® Utilities comprises those companies included in the S&P 500 that are classified as members of the GICS® utilities sector.


ABS

Bloomberg US Asset-Backed Securities Index

The Bloomberg US ABS Index is a broad-based flagship benchmark that measures the investment-grade, US dollar-denominated, fixed-rate taxable bond market. The index only includes ABS securities.


U.S. High Yield

Bloomberg U.S. Corporate High-Yield Index

The Bloomberg U.S. Corporate High-Yield Index measures the U.S. dollar-denominated, high-yield, fixed-rate corporate bond market. Securities are classified as high yield if the middle rating of Moody’s, Fitch, and S&P is Ba1/BB+/BB+ or below. Bonds from issuers with an emerging markets country of risk, based on Barclays EM country definition, are excluded.


MBS

Bloomberg U.S. Mortgage-Backed Securities Index

The Bloomberg Mortgage-Backed Securities Index tracks fixed-rate agency mortgage-backed pass-through securities guaranteed by Ginnie Mae (GNMA), Fannie Mae (FNMA), and Freddie Mac (FHLMC). The index is constructed by grouping individual TBA-deliverable MBS pools into aggregates or generics based on program, coupon, and vintage.


TIPS

Bloomberg U.S. Treasury Inflation Notes 1-10 Year Index

The Bloomberg U.S. Treasury Inflation Notes 1-10 Year Index measures the performance of the U.S. Treasury Inflation-Protected Securities (TIPS) market with less than 10 years to maturity. TIPS are inflation-protected bonds (IPBs) that are issued by the U.S. Treasury. Their face value is pegged to the CPI and adjusted in step with changes in the rate of inflation.


Treasuries

Bloomberg U.S. Treasury Index

The Bloomberg U.S. Treasury Index measures U.S. dollar-denominated, fixed-rate, nominal debt issued by the U.S. Treasury. Treasury bills are excluded by the maturity constraint but are part of a separate Short Treasury Index. STRIPS are excluded from the index because their inclusion would result in double-counting.


EM Debt

Bloomberg Emerging Markets Tradeable Debt Index: Total Return

This index measures the performance of emerging market debt on a total return basis


Precious Metals

Bloomberg Precious Metals Subindex

Formerly known as Dow Jones-UBS Precious Metals Subindex (DJUBSPR), the index is a commodity group subindex of the Bloomberg CI. It is composed of futures contracts on gold and silver. It reflects the return of underlying commodity futures price movements only and is quoted in USD.


Industrial Metals

Bloomberg Industrial Metals Subindex

Formerly known as Dow Jones-UBS Industrial Metals Subindex (DJUBSIN), the index is composed of futures contracts on aluminum, copper, nickel and zinc. It reflects the return of underlying commodity futures price movements only. It is quoted in USD.


Energy

Bloomberg Energy Subindex

Formerly known as Dow Jones-UBS Energy Subindex (DJUBSEN), the index is a commodity group subindex of the Bloomberg CI. It is composed of futures contracts on crude oil, heating oil, unleaded gasoline and natural gas. It reflects the return of underlying commodity futures price movements only and is quoted in USD.


MLPs

Alerian MLP Index

The Alerian MLP Index is a float-adjusted, capitalization-weighted index whose constituents earn most of their cash flow from midstream activities involving energy commodities. It tracks energy infrastructure Master Limited Partnerships (MLPs).


Real Estate/REITs

FTSE EPRA/NAREIT

Developed Index

The FTSE EPRA/NAREIT Developed Index is designed to track the performance of listed real estate companies and REITS worldwide. Index constituents are free float-adjusted, subject to liquidity, size, and revenue screening for inclusion.


Infrastructure

S&P Global Infrastructure Index

The S&P Global Infrastructure Index is designed to track 75 companies from around the world chosen to represent the listed infrastructure industry while maintaining liquidity and tradability. To create diversified exposure, the index includes three distinct infrastructure clusters: energy, transportation, and utilities.


Agriculture

Bloomberg Agriculture Subindex

Formerly known as Dow Jones-UBS Agriculture Subindex (DJUBSAG), the index is a commodity group subindex of the Bloomberg CI. It is composed of futures contracts on coffee, corn, cotton, soybeans, soybean oil, soybean meal, sugar and wheat. It reflects the return of underlying commodity futures price movements only and is quoted in USD.


Fund of Funds

HFRI Fund of Funds

Composite Index

The HFRI Fund of Funds Composite Index is an equally weighted hedge fund of funds benchmark composed of global constituent funds. The underlying constituents are typically diversified among multiple managers and styles to provide a comprehensive representation of the hedge fund of funds investment space.


Equity Hedge Funds

HFRI Equity Hedge Index

The HFRI Equity Hedge Index is an equally weighted hedge fund benchmark composed of investment managers who maintain both long and short positions, primarily in equity and equity derivative securities. Equity hedge managers typically maintain at least 50% exposure to, and may in some cases be entirely invested in, equities, both long and short.


Global Macro

HFRI Macro Index

The HFRI Macro Index is an equally weighted hedge fund benchmark composed of investment managers that trade a broad range of strategies in which the investment process is predicated on movements in underlying economic variables and the impact these have on equity, fixed income, hard currency, and commodity markets. Managers employ a variety of techniques, both discretionary and systematic analysis, combinations of top-down and bottom-up theses, quantitative and fundamental approaches, and long- and short-term holding periods.


Event-Driven

HFRI Event-Driven Index

The HFRI Event-Driven Index is an equally weighted hedge fund benchmark composed of investment managers who maintain positions in companies currently or prospectively involved in corporate transactions of a wide variety, including but not limited to mergers, restructurings, financial distress, tender offers, shareholder buybacks, debt exchanges, security issuance, or other capital structure adjustments. Event-driven exposure includes a combination of sensitivities to equity markets, credit markets, and idiosyncratic, company-specific developments.


Relative Value

HFRI Relative Value Index

The HFRI Relative Value Index is an equally weighted hedge fund benchmark composed of investment managers who maintain positions in which the investment thesis is predicated on the realization of a valuation discrepancy in the relationship between multiple securities. Managers employ a variety of fundamental and quantitative techniques to establish investment theses, and security types can range broadly across equity, fixed income, derivative, or other security types.


Private Real Estate

NCREIF Property Index

The NCREIF Property Index is a quarterly, unleveraged composite total return for private commercial real estate properties held for investment purposes only. Constituents include operating apartment, hotel, industrial, office, and retail properties.


U.S. Large Cap

Russell 1000 Index

The Russell 1000 Index measures the performance of the large-cap segment of the U.S. equity universe. It is a subset of the Russell 3000 Index representing approximately 90% of the total market capitalization of that index. It includes approximately 1,000 of the largest securities based on a combination of their market cap and current index membership.


U.S. Mid Cap

Russell Midcap Index

The Russell Midcap Index measures the performance of the mid-cap segment of the U.S. equity universe. The Russell Midcap Index is a subset of the Russell 1000 Index. It includes approximately 800 of the smallest securities based on a combination of their market cap and current index membership. The Russell Midcap Index represents approximately 31% of the total market capitalization of the Russell 1000 companies.


U.S. Small Cap

Russell 2000 Index

The Russell 2000 Index measures the performance of the small-cap segment of the U.S. equity universe. It is a subset of the Russell 3000 Index representing approximately 10% of the total market capitalization of that index. It includes approximately 2,000 of the smallest securities based on a combination of their market cap and current index membership.


U.S. Core

Russell 1000 Index

The Russell 1000 Index measures the performance of the large-cap segment of the U.S. equity universe. It is a subset of the Russell 3000 Index representing approximately 90% of the total market capitalization of that index. It includes approximately 1,000 of the largest securities based on a combination of their market cap and current index membership.


U.S. Value

Russell 1000 Value Index

The Russell 1000 Value Index measures the performance of the large-cap value segment of the U.S. equity universe. It includes those Russell 1000 companies with lower price-to-book ratios and lower forecasted growth values.


U.S. Growth

Russell 1000 Growth Index

The Russell 1000 Growth Index measures the performance of the large-cap growth segment of the U.S. equity universe. It includes those Russell 1000 companies with higher price-to-book ratios and higher forecasted growth values.


International Large Cap

MSCI All Country World ex. U.S. Index

The MSCI All Country World ex U.S. Index captures large- and mid-cap representation across developed and emerging markets countries, excluding the U.S. The index covers approximately 85% of the global equity opportunity set outside the U.S.


International Mid Cap

MSCI All Country World ex. U.S. Mid Cap Index

The MSCI ACWI ex USA Mid Cap Index captures mid cap representation across 22 Developed Markets (DM) and 24 Emerging Markets (EM) countries*. With 1,208 constituents, the index covers approximately 15% of the free float-adjusted market capitalization in each country.


International Small Cap

MSCI All Country World ex. U.S. Small Cap Index

The MSCI ACWI ex USA Small Cap Index captures small cap representation across 22 of 23 Developed Markets (DM) countries (excluding the US) and 24 Emerging Markets (EM) countries*. With 4,263 constituents, the index covers approximately 14% of the global equity opportunity set outside the US.


International Core

MSCI All Country World ex. U.S. Index

The MSCI All Country World ex U.S. Index captures large- and mid-cap representation across developed and emerging markets countries, excluding the U.S. The index covers approximately 85% of the global equity opportunity set outside the U.S.


International Value

MSCI All Country World ex. U.S. Value Index

The MSCI ACWI ex USA Value Index captures large and mid-cap securities exhibiting overall value style characteristics across 22 Developed and 24 Emerging Markets countries*. The value investment style characteristics for index construction are defined using three variables: book value to price, 12-month forward earnings to price and dividend yield.


International Growth

MSCI All Country World ex. U.S. Growth Index

The MSCI ACWI ex USA Growth Index captures large and mid-cap securities exhibiting overall growth style characteristics across 22 Developed Markets (DM) countries and 24 Emerging Markets (EM) countries*. The growth investment style characteristics for index construction are defined using five variables: long-term forward EPS growth rate, short-term forward EPS growth rate, current internal growth rate and long-term historical EPS growth trend and long-term historical sales per share growth trend.


QUESTIONS?

Our Wealth Management team is ready to answer your questions and help you prepare for your future with a suite of planning solutions focused on you.


View as Webpage


LinkedIn

6135 Memorial Drive Suite 103, Dublin, OH 43017 | 614.380.3800