|
Morning Coffee & Ag Markets
Monday, September 9, 2024
| | |
|
Review of the September 2024 USDA Farm Sector Income Forecast
Author: Riley Smith, Program Associate, University of Arkansas
| |
With the release of the new USDA Net Farm Income Outlook we wanted to share with our followers updates to the forecasted farm income for 2024. In 2024, farm sector income in the U.S. is forecast to decline from the record highs achieved in 2022, although at a slower rate compared to 2023. Net farm income is projected to fall by 4.4 percent to $140.0 billion, while net cash farm income is expected to decrease by 7.2 percent to $154.1 billion. In inflation-adjusted terms, net farm income is anticipated to drop by 6.8 percent and net cash farm income by 9.6 percent, though both measures will remain above their averages from 2004 to 2023.
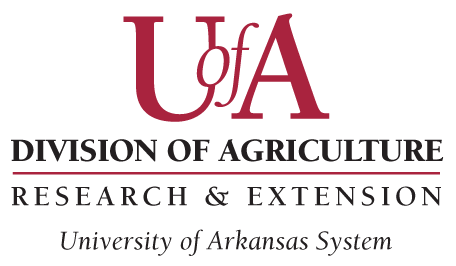
Total cash receipts for 2024 are forecast to decrease by $9.8 billion (1.9 percent) to $516.5 billion in nominal (non inflation adjusted) dollars, primarily due to a significant drop in crop receipts. Crop cash receipts are expected to fall by $27.7 billion (10.0 percent), driven by lower prices for key commodities like corn, soybeans, and cotton. Conversely, animal and animal product receipts are forecast to increase by $17.8 billion (7.1 percent), with notable gains in milk, cattle, and eggs (Figure 1).
| |
Figure 1. U.S. Cash Receipts for Selected Crops, 2023-24F, USDA Net Farm Income Outlook. | |
Production expenses are predicted to decline slightly by 1 percent to $457.5 billion, with substantial decreases in feed, fertilizer, and pesticide costs (Figure 2). Labor expenses are expected to rise by 6.9 percent, and livestock and poultry purchases are projected to grow by 12.0 percent. Total direct government farm payments are forecast to decrease by 15.1 percent to $10.4 billion, largely due to lower payments from the Dairy Margin Coverage Program and reduced supplemental disaster assistance. | |
Figure 2. Nominal and Inflation - Adjusted U.S. Farm Production Expenses 1970-2024F, USDA Net Farm Income Outlook. | |
Takeaways on Government Assistance | |
|
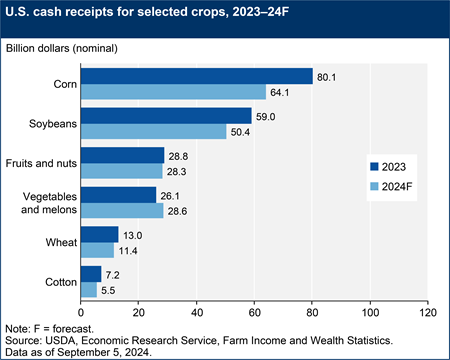
Since 2015, total government assistance has accounted for 5% of total cash income measured by the sum of crop receipts, livestock receipts, and government assistance. The only years with more than this 10-year-average are 2019, 2020, and 2021 in which total government assistance accounted for 7%, 13%, and 5% of cash income, respectively. Notably, these years saw supplemental and ad hoc disaster assistance in the form of the Market Facilitation Program (MFP) in 2019, USDA Pandemic Assistance programs in 2020, and a mix of USDA and non-USDA Pandemic Assistance in 2021. Most of the government assistance for the years 2022-2024F are the Emergency Relief Program (ERP) and conservation programs. ERP assistance for the 2020-2021 crop years was delivered in two phases in 2022 and 2023. In 2024, another round of phase one payments are projected to be released due to a rule which limited ERP assistance to producers received federal crop insurance indemnities (USDA-FSA, 2024).
The proportion of government assistance has shifted from primarily from market-based programs (i.e., Agricultural Risk Coverage and Price Loss Coverage) to supplemental and ad hoc disaster assistance across this same period. In the years funded by the 2014 farm bill, the percentage of total government assistance from market-based programs was 48% followed by conservation programs at 31% and supplemental assistance at 18%. In the years funded by the 2018 farm bill, the percentage of government assistance from market-based programs fell 42 percentage points to 7%. The proportion of conservation funding fell 9 percentage points to 22%. The proportion of supplemental and ad hoc assistance increased by 51 percentage points to 69%. This shift from market-based assistance to supplemental and ad hoc assistance underscores the need for a safety net with stronger risk management tools which could possibly eliminate the need for supplemental and ad hoc disaster assistance.
| |
Figure 4. Government Assistance as a Percentage of Total Cash Income (Inflation Adjusted $) We note that total cash income is measured by the sum of government assistance, crop receipts, and livestock receipts. We use this measure rather than net cash income because net cash income provides returns above expenses. Producers use government assistance to pay production expenses, land rental expense, and debt obligations and is not accurately reflected in net farm income which is returns above production expenses (i.e. profit). | |
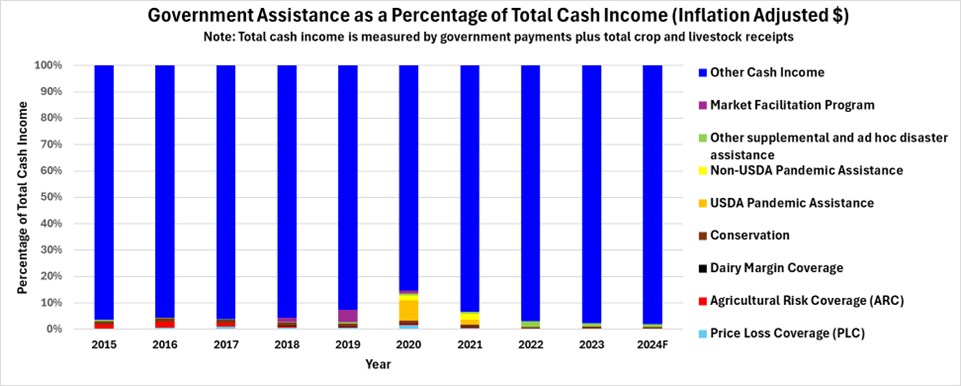
Arkansas Market Update
(as of September 6, 2024)
| |
*SOURCE: Peanut Prices, Runner-type, USDA, National Agricultural Statistics Service, September 9,2024. | |
NOTE: Each state average price is taken across multiple input suppliers across Arkansas. For a price more local to you, please contact Mr. Riley Smith at rsmith@uada.edu. | |
|
Mississippi River Level at Memphis, TN
(as of September 6, 2024)
| |
| Current Level (ft) | -6.68 | | Year Ago (ft) | -9.09 | | Critical Low Water Level (ft) | -5.00 | | Action Flood Stage Level (ft) | 28.00 | | |
|
NOAA 7-Day Weather Forecast
(as of 9/09/2024)
| | | | |