|
Morning Coffee & Ag Markets
Monday, August 12, 2024
| | |
|
Measuring the Influence of Economic Indicators on Farm Income
Author: Ryan Loy, Assistant Professor, University of Arkansas
| |
Since the 2020 pandemic, the United States has been in economic recovery, with the U.S. Federal Reserve (Fed) playing a pivotal role. The pandemic, which began with low interest rates and allowed for inexpensive financing, with the Federal Funds rate at 0% (FRED, 2024), spurred economic growth early on. However, as the pandemic continued and global crises such as the Russia-Ukraine war, Israel-Hamas Conflict, and Panama/Suez Canal continued to put pressure on already strained supply chains, the Fed was forced to change course to prevent a recession. The last few years have seen an increase in the global price for goods, and now the U.S. is at a crossroads with how best to slow the economy and return to normal pre-pandemic levels of economic activity. One of the main issues facing the economy is decreasing and stabilizing inflation
Inflation, or the rise in prices and the decline in money's purchasing power, is not a new phenomenon. However, since COVID, the Federal Reserve has found the task of adjusting the economy and preventing a hard-landing recession challenging due to pent-up demand following pandemic lockdowns. The Fed employs two indexes, The Consumer Price Index (CPI) and the Core Personal Consumption Expenditure Index (PCE), as a proxy to gauge inflation in U.S. markets (see Figure 1). These indexes measure the market price of a bundle of goods, and the percentage change between the indexes is plotted in Figure 1. Consider the CPI of 9.1 in June 2022; this measure indicates the bundle of goods has increased by 9.1% since June 2021 (Figure 1). However, the Fed favors the use of the Core PCE to measure inflation as it excludes food and energy expenses. Food and energy are volatile, and their exclusion provides a more accurate measure of inflation. The core PCE is 2.6% as of June 2024 (the latest release) and the Fed's target for confidence in reducing interest rates is 2%. This is the formidable task facing the Fed as they strive to strike a balance between slowing the economy and avoiding a hard-landing recession akin to the 2008 housing crisis.
| |
|
Figure 1. CPI and Core PCE (2020 - Q3 2024)
| |
The effective federal funds rate (Figure 2), also known as the central U.S. interest rate, represents the cost of borrowing money between financial institutions (FRED, 2024). This rate indirectly affects other interest rates, such as the Prime Rate and agricultural loan rates. The Federal Open Market Committee (FOMC) convenes eight times a year to update the target federal funds rate, which the Fed aims for the effective federal funds rate to reach based on the prevailing economic conditions (FRB, 2023). The FOMC influences the effective rate by managing available liquidity in the financial sector. In this context, liquidity refers to a bank’s cash surplus (FRED, 2023). In terms of supply and demand, if excess cash is scarce, the cost of borrowing available cash increases, discouraging borrowing – a situation that mirrors the current U.S. economy. The Fed employs these tools to either slow down the economy during periods of rising inflation or to stimulate economic activity by lowering interest rates. Since 2022, the Fed has instituted 11 federal funds rate hikes – seven in 2022 and four in 2023 – to quell the economic growth spurred by COVID-era interest rate reductions. The Fed decided to maintain the same target rate at their July 2024 meeting, with an outlook to begin cutting the target rate in September 2024
Figure 2 also shows the prime rate. The prime rate is the interest rate that banks use to set various interest rates in the market. It is usually 3% higher than the target fed funds rate, giving banks a cushion to profit from interest payments. The current 2024 prime rate is 8.50%, and the effective federal funds rate is 5.33% (5.25-5.50 target federal funds rate), the highest since the 2008 financial crisis, which peaked at an effective rate of 5.41% (Figure 3). Jerome Powell, the chairman of the Federal Reserve, remarked at the April 2024 FOMC meeting that higher-than-expected inflation metrics (CPI & PCE) have complicated the Fed’s monetary policy strategy. Three rate cuts were expected to occur before the end of 2024. However, prevailing sticky inflation has forced the Fed to push chances of rate cuts later into 2024 and 2025. It does seem that the Fed has completed this cycle of rate increases, and now it’s a matter of how long these high rates will persist
|  | |
Figure 2. Comparing Crop Price to Phosphate Price in Arkansas Over Time | |
The important takeaway for an agricultural producer is understanding how the Fed funds and Prime rate influence interest rates in agricultural lending. Recall that the Fed funds rate is the cost of borrowing dollars between banks, and the Prime rate sets the base for the interest rates on dollars lent out to borrowers. Operating, intermediate, and real estate farm loans are then determined based on the prevailing Prime rate at a given time. These rates are also subject to a borrower’s merit and vary nationwide. Every quarter, the Federal Reserve Bank of Kansas City issues a Survey of Agricultural Credit Conditions in the 10th district (KC-FED, 2024). The survey is distributed to agricultural lenders within the district and provides indicators about the current financial performance of farms involved in the debt market. The main aspect of this survey is lenders reporting the fixed or variable interest rate on agricultural loans. The interest reported for one quarter is the average of interest rates from all survey respondents, so what is reported in the survey data may undervalue the actual interest rate in an individual’s lending terms. Still, the interest rates are useful in understanding, on average, how the increase in interest rates over the last four years has impacted production costs per acre.
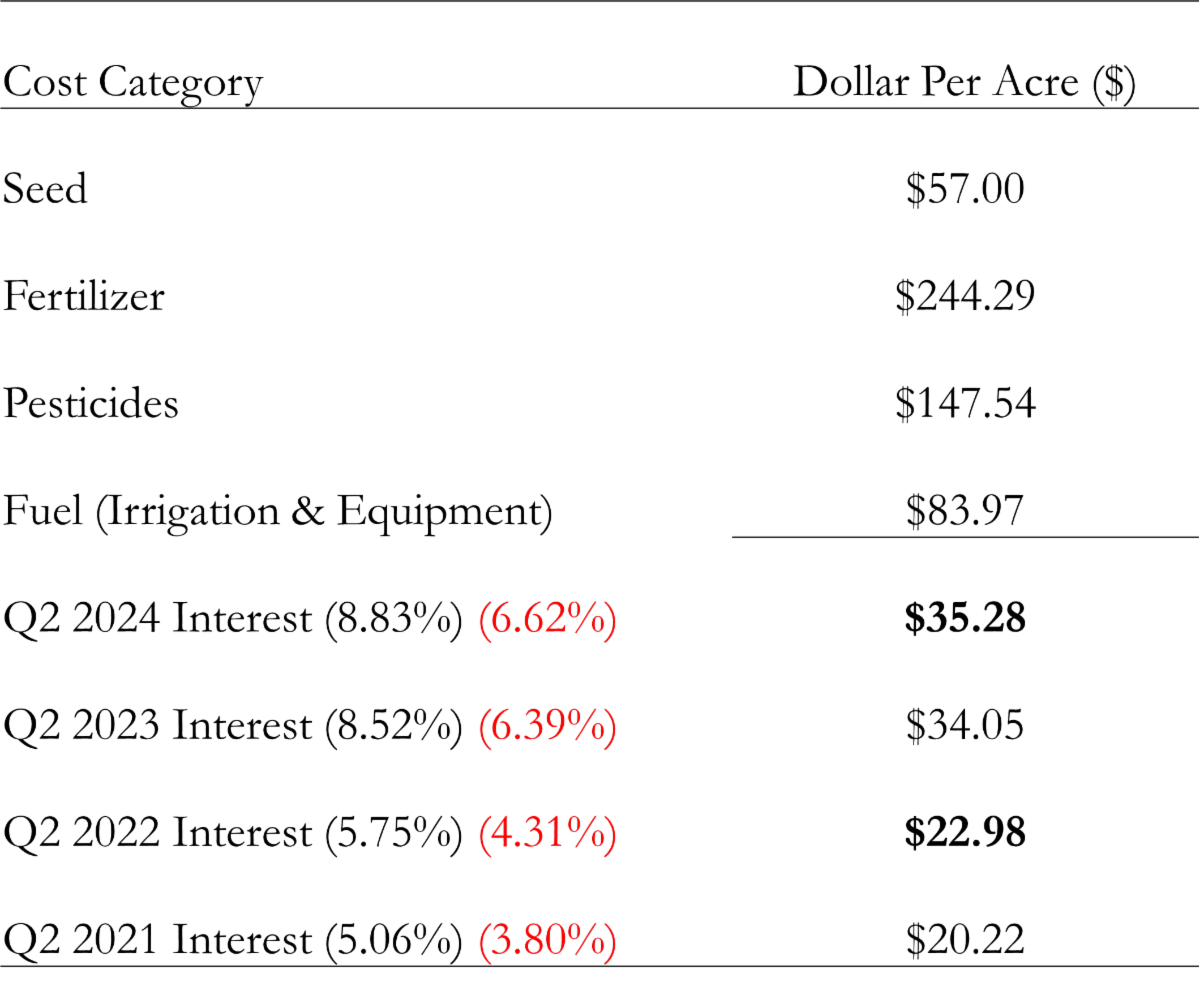
Table 1 contains a simplistic 2024 pre-harvest budget for a conventional soybean producer in Arkansas (UADA-CES, 2024). The interest rates reported for each quarter are derived from the Ag lender survey. Assume this producer acquires an operating loan each year and pays back the lender at the end of harvest (9 months). Since the lending term is less than a year, an effective interest rate, or the true interest percentage paid, is calculated for each year. For example, Q1 2024 effective interest is 8.83% * (9/12) = 6.62%, the true interest rate based on a 9-month operating loan. This rate is then multiplied by the total estimated pre-harvest expenses to calculate the interest on operating capital expense ($532.80 * 6.62% = $35.28). Referring to Figure 1, pre-harvest interest expenses have increased ~$15 per acre since 2021 and ~$3 per acre since 2023. This increase in interest has put a strain on profitability, which is already strained by low commodity prices
| Table 1. Example 2024 Arkansas Conventional Soybeans Pre-Harvest Expenses | |
Arkansas Market Update
(as of August 12, 2024)
| |
*SOURCE: Peanut Prices, Runner-type, USDA, National Agricultural Statistics Service, August ,2024. | |
NOTE: Each state average price is taken across multiple input suppliers across Arkansas. For a price more local to you, please contact Mr. Riley Smith at rsmith@uada.edu. | |
|
Mississippi River Level at Memphis, TN
(as of August 12, 2024)
| |
| Current Level (ft) | 3.6 | | Year Ago (ft) | 4.0 | | Critical Low Water Level (ft) | -5.00 | | Action Flood Stage Level (ft) | 28.00 | | |
|
NOAA 7-Day Weather Forecast
(as of August 12, 2024)
| | | | |