|
Comparing Fertilizer Costs to Row Crop Prices
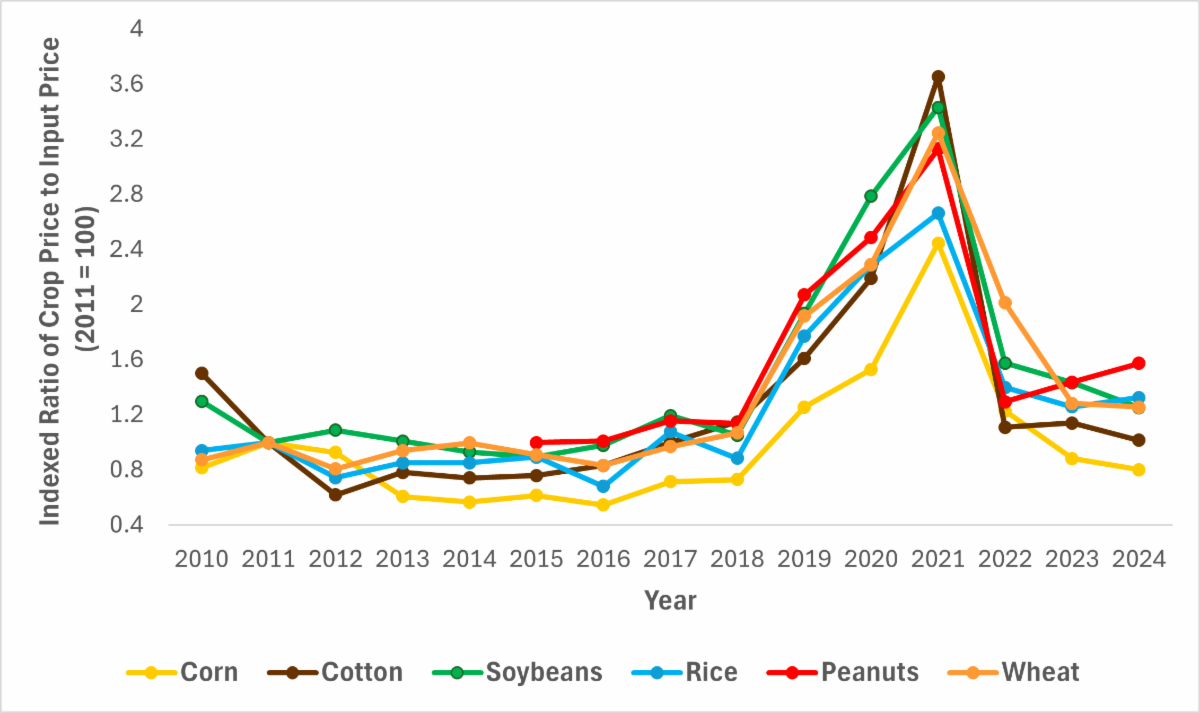
We provide context for these fertilizer price changes by comparing fertilizer prices against the historical futures prices for principal row crops in the state. We do so by constructing a ratio by first taking the ratio of the crop futures price, which in this case is the USDA-RMA Harvest Price (HP), to the price of each fertilizer. This measure provides an interpretation indicating how much greater the crop price is than the input price. For instance, the 2023 HP for corn was $4.84/bushel while the 2023 state average price for Urea was $0.40/lb resulting in a ratio of 12.1 which means the corn price was 12 times greater than the price of Urea. However, this ratio takes several different values across a wide range given the differences in the magnitudes of various crop prices. Therefore, we index the ratio for each crop to the year 2011 to provide a standardized means of comparison. We index to 2011 following the rationale for the construction of crop price received and input price paid indices by USDA-NASS and described by Dr. Ryan Loy in the July 29, 2024 newsletter.
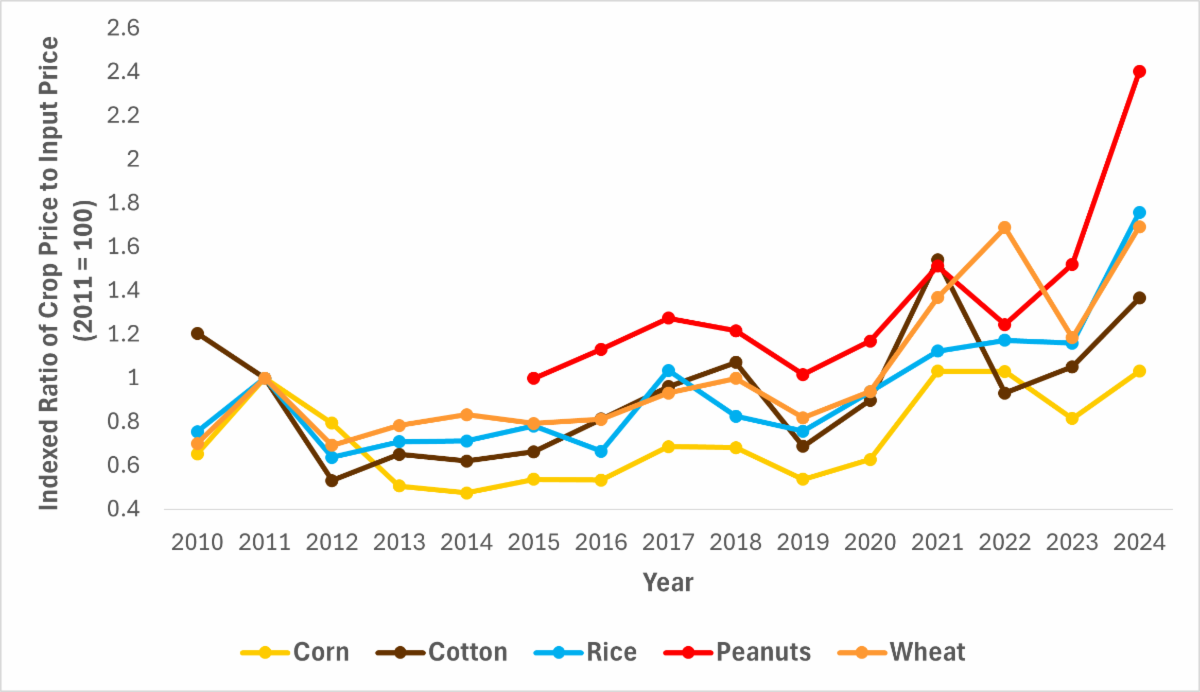
The observed patterns in ratios are best understood as the strengthening of crop prices to input prices with higher ratios indicating stronger crop prices to input prices and lower ratios indicating the opposite. One may also consider these ratios as the buying power of crop prices with higher ratios exhibiting more buying power and lower ratios exhibiting less buying power. From these interpretations, we observe a sharp increase in 2021 followed by a sharp decrease in 2022. This is largely driven by increased demand for food products resulting from the relaxing of COVID-19 restrictions followed by the Russian invasion of Ukraine in February 2022. Since 2021, the buying power of crop prices for Phosphate (Figure 2) and Potash (Figure 3) across the board have fallen while Urea (Figure 4) has actually experienced an increase in buying power with corn and cotton has notably exceptions. The differences in crop price buying power is driven by the sharp rise in Phosphate and Potash prices relative to the relatively smaller year-over-year increase in Urea.
In addition to the broad observations above, we note some crop-specific comparisons. The 2023-2024 corn and cotton ratios consistently report the lowest buying power measured by ratios ranging from 0.70 to 1.37 indicating current buying power reflects either lower than or slightly higher than buying power in 2011. The 2023 corn ratios for Urea, Phosphate, and Potash are 0.82, 0.88, 0.70, respectively while the 2024 corn ratios are 1.03, 0.80, and 0.97, respectively. The 2023 cotton ratios for Urea, Phosphate, and Potash are 1.05, 1.14, 0.90 respectively while the 2024 cotton ratios are 1.37, 1.02, and 1.23, respectively. These lower ratios can be explained by the lowest crop prices since 2020 with an unlikely increase in crop price prior to harvest as USDA predicts record corn and cotton production.
We note this analysis includes only on the cost of macronutrients and excludes any interest expense for purchasing these inputs and for storing grain to potentially market in a post-harvest window. A future newsletter will focus on the relationship between interest rates on operating loans and crop prices.
|