|
Port Strikes on the Gulf and East Coast
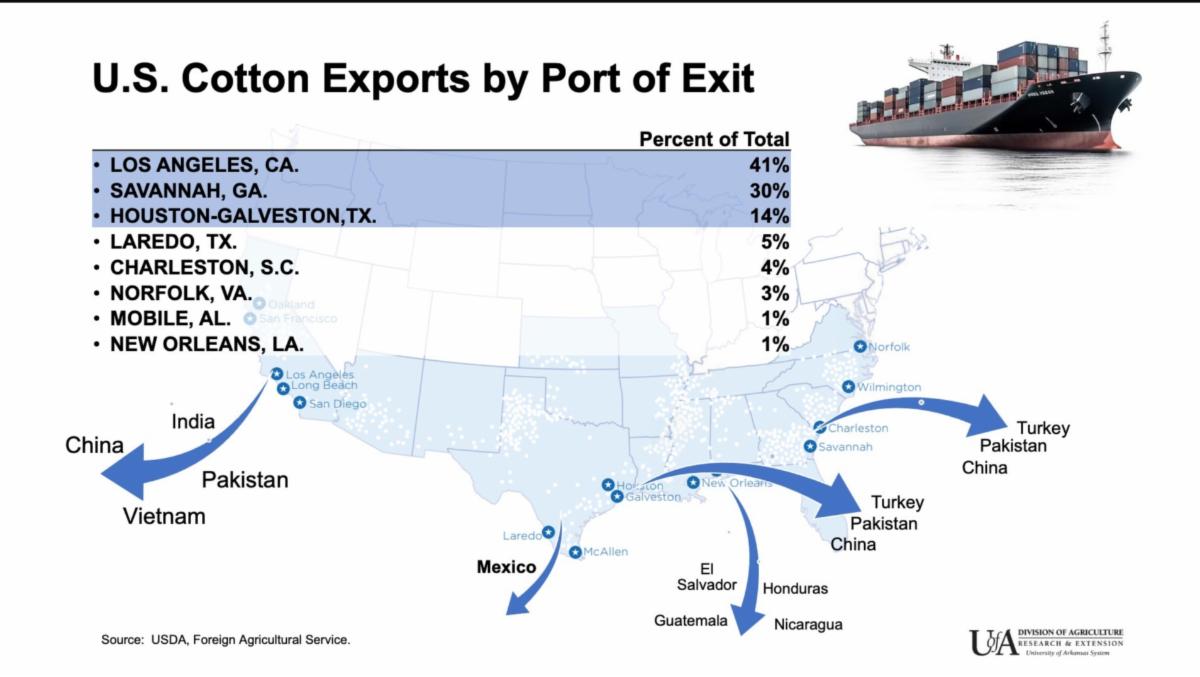
The United States is the world’s fourth largest cotton producer (behind China, India, and Brazil) and the world’s second largest cotton exporter, supplying 12 percent of global cotton production in 2024 and accounting for 27 percent of the world export market. The five principal export markets, marketing year- to-date (August 1 – July 31) for US cotton are: Pakistan, Vietnam, Mexico, China, and Turkey, respectively.
Over the last three decades, the US cotton industry has faced a number of challenges as domestic mill demand has continually declined; recently falling to the lowest levels since 1885. During the 1990s, domestic mill use accounted for 60 percent of total US cotton demand. Due to increased competition from imported textile and apparel products, US mill use is expected to drop to 14 percent of total demand for 2024/25. As a result, US cotton production has become largely dependent on overseas markets with exports thus now accounting for 86 percent of total demand.
Considering the recent labor strike by the International Longshoremen’s Association, what impact does this have on the US cotton industry? Most importantly, the strike shuts down containerized shipments, which account for all waterborne cotton exports leaving East and Gulf Coast ports. When examining concentration of US cotton exports by port, the top locations are Los Angeles-Long Beach (41% of total exports in 2023/24), Savannah (30%) and Houston (14%). Other major ports for cotton exports include Charleston (4%), Norfolk (3%), Mobile (1%) and New Orleans (1%). Los Angeles-Long Beach is the largest port involved in shipping cotton to the Southeast Asian region, while Savannah is second. US cotton exports to Pakistan are also important, with Pakistan thus far being the largest buyer of US cotton in the 24/25 marketing year. Los Angeles-Long Beach is the main port involved in exporting to Pakistan, with the Savannah, Charleston, and Houston sharing the second largest volumes over the last five years. Houston is the leading port for cotton going to Turkey, followed by Savannah and New Orleans. Of particular interest to ports in the Southeast and US Gulf are the Latin American markets, which include all countries in Central America and South America.
Because the US cotton industry is highly dependent on foreign markets, the US transportation system plays a key part in keeping US cotton flowing and competitive with other foreign suppliers, such as Brazil and Australia. A quick resolution to the East and Gulf Coast port strike is of crucial importance as constraints in US transportation will ultimately influence producer prices, cotton exports, shipping patterns, and world trade through the US Gulf and Atlantic ports.
|