|
Morning Coffee & Ag Markets
Monday, August 26, 2024
| | |
|
Low Water Levels on the Mississippi River: Not the Three-peat We Want
Authors: Hunter D. Biram, James L. Mitchell, H. Scott Stiles & Ryan Loy, University of Arkansas
| |
The Mississippi River level measured at Memphis, Tennessee, looks to drop to severely low levels for the third year in a row. In the past ten years, the Mississippi River has fallen seven times below the agreed-upon zero level during harvest (i.e., August 1 through November 30). However, the level has only dropped to the “low” stage, defined by the National Weather Service as -5 feet, four times (2015, 2017, 2022, and 2023). The river level has serious implications for cash basis, or the local cash price offered by a grain elevator less the futures price traded on a global market.
When water levels drop in the marine highway system, barge drafts are reduced (U.S. Army Engineer Institute for Water Resources, 2022). A barge draft is the distance between the waterline and the boat, or the barge hull structure, and increases with the amount of weight present on the barge. The average barge with a draft of 9 feet can hold 1,500 tons of grain, which equates to about 55,000 bushels of soybeans. Each reduced foot of draft results in 150-200 fewer tons, or anywhere between 5,000 to 6,700 bushels of soybean capacity on a barge (Hutton, 2022). If barge drafts decrease for vessels carrying grain, the cost to transport grain downriver, or the grain barge rate, increases since it takes more barges to move the same amount of grain. In extreme cases like record-low water levels, barge traffic may stop entirely for safety reasons.
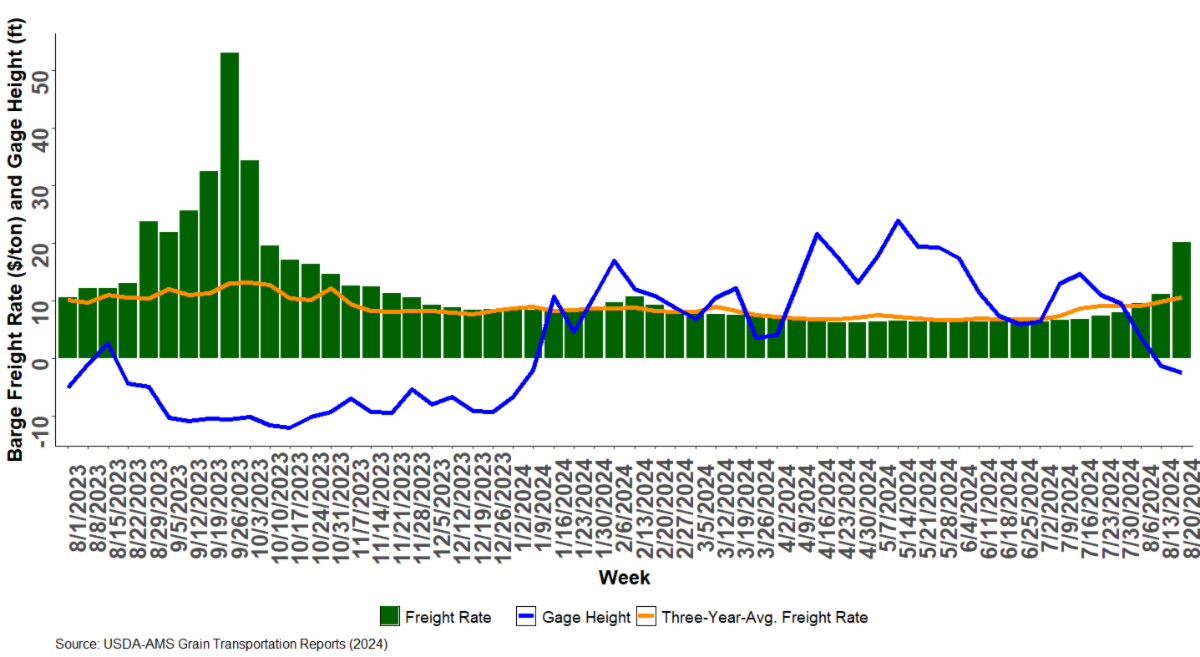
Barge freight rates are established by the U.S. Inland Waterway System using a “percent of tariff” system. Benchmark rates are based on the tariff rates from the Bulk Grain and Grain Products Freight Tariff No. 7, which today is no longer applicable (USDA-AMS, 2022). However, calculating the percent of tariff consists of taking the ratio of today's tariff rate to the 1976 tariff rate. The 3-year average percent of tariff rate indicates that the weekly barge freight rate tends to be near 360 percent of tariff, or about $11.23/ton[1] (USDA-AMS, 2022). Low Mississippi River levels have a negative relationship to corn and soybean basis through the barge freight rate (Figure 1). For example, on the week of September 26, 2023, the barge freight rate was 1689 percent of tariff, or $53.03/ton, which means the cost to transport grain from Cairo, IL, to the port of Memphis was four times higher than the three-year average for the same week.
[1] This figure is found by multiplying the percent of tariff, which in this example is 3.60, by the benchmark rate for the Cairo-Memphis ports which is $3.14.
| |
|
Figure 1. The relationship between the Mississippi River level and barge freight rates for moving cargo from Cairo, IL, to Memphis, TN. This figure plots the Mississippi River level measured at Memphis, Tennessee, from August 2, 2023, through August 22, 2024. It also provides the weekly average freight and the expected barge freight rate measured by the three-year average freight rate. As the gage height falls, barge freight rates increase, and vice versa.
| |
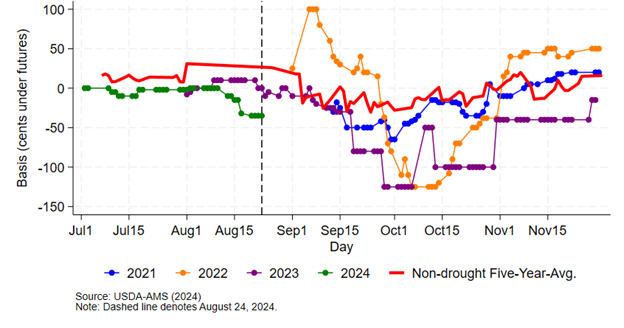
Basis is the relationship between a local cash market and the futures market. It is defined as the local cash market price minus the price of a specific futures contract for the same commodity at a given time. Across the country, cash prices at most locations are below futures, resulting in a negative basis. When the cash price increases more than the futures price, the basis is said to narrow or strengthen. When the futures price increases more than the cash market price, the basis widens or weakens. The relationship between the futures price and the price at local cash markets can change abruptly due to economic or environmental events, such as low river levels. Figure 2 shows the soybean basis response to low river levels in Helena, Arkansas in 2022 and 2023 with another downward trajectory for 2024 as of August 22, 2024. | |
Figure 2. Daily Soybean Basis at Helena, AR in Harvest Window This figure shows the historical daily basis for soybeans during the months of July through November. The blue, orange, purple, and green lines denote the 2021, 2022, 2023, and 2024 crop years, respectively. The solid red line denotes the non-drought five-year average basis for a grain elevator in Helena, Arkansas. The five-year average provides the “normal,” or “expected,” basis. The dashed vertical line denotes the basis most recently reported (-35) on August 22, 2024, and is 61 cents below the five-year-average basis of +26 cents. | |
|
The local grain markets are incentivizing storage with a basis that is 45 cents below the five-year-average basis of +26 cents. One option farmers have is to store grain in the bin and market grain in the post-harvest window. Futures, and basis, tend to recover in the months when there is little domestic production to buy and within-season stocks are drawn down. We note that the USDA Marketing Assistance Loan program may be an additional tool to add to a post-harvest marketing strategy since MALs have interest rates below the market average. Since grain sitting in the bin is not paying off the operating loan taken at the beginning of the crop year, interest accrues on the operating loan, creating the opportunity cost of storage in addition to the explicit costs of handling and drying costs. A future article will take a deeper dive into this strategy.
Additional Resources:
1) UADA press article (Scott Stiles and Mary Hightower, 2024)
2) Fryar Center Technical Report (Biram, Stiles, McKenzie, and Anderson, 2022)
3) Southern Ag Today (Gardner, Biram, and Mitchell, 2023)
4) Southern Ag Today (Biram, 2023)
5) Southern Ag Today (Biram, Anderson, Stiles, and McKenzie, 2022)
| |
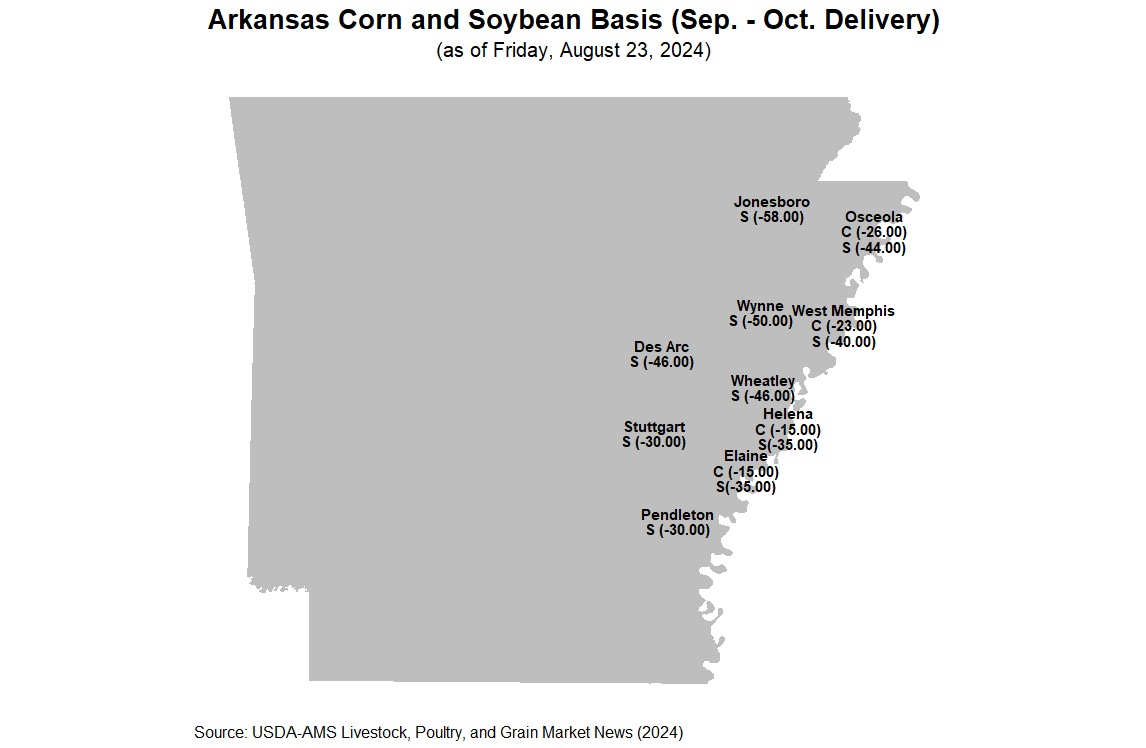
Arkansas Market Update
(as of August 23, 2024)
| |
*SOURCE: Peanut Prices, Runner-type, USDA, National Agricultural Statistics Service, August 23,2024. | |
NOTE: Each state average price is taken across multiple input suppliers across Arkansas. For a price more local to you, please contact Mr. Riley Smith at rsmith@uada.edu. | |
|
Mississippi River Level at Memphis, TN
(as of August 23, 2024)
| |
| Current Level (ft) | -1.56 | | Year Ago (ft) | -0.84 | | Critical Low Water Level (ft) | -5.00 | | Action Flood Stage Level (ft) | 28.00 | | |
|
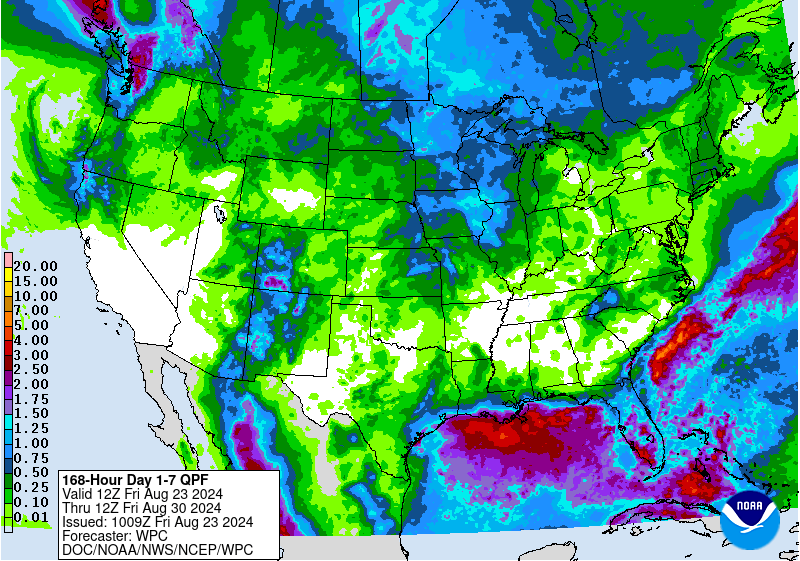
NOAA 7-Day Weather Forecast
(as of 8/23/2024)
| | | | |