Morning Coffee & Ag Markets

Monday, October 28, 2024

Arkansas Net Farm Income to Decline for Second Straight Year

Author: Hunter D. Biram, Assistant Professor and Extension Ag Economist, University of Arkansas

Faculty at the University of Arkansas, Cooperative Extension Service (UA-CES) in collaboration with the Rural and Farm Finance Policy Analysis Center (RaFF) at the University of Missouri released a report on the drivers of the projected 2024 net farm income for Arkansas in April 2024. On October 16, 2024, about a month after the USDA 2024 fall revision, UA-CES and RaFF released a revision to reflect the changes in prices and production relative to the projection given in the spring. The fall 2024 report, published by RaFF, provides an outlook for Arkansas farm income for calendar years 2024 and 2025. The intention is to inform policymakers, industry analysts, and agricultural practitioners about the expected financial conditions of the state’s agricultural sector and the indicators behind said conditions.


Arkansas net farm income is expected to decline by $328 million (or 10%) from $3.28 billion to $2.96 billion in the 2024 calendar year (Figure 1). This results in a $1.06 billion drop from the record set in 2022 and is the second year in a row of decline in net farm income. The year-over-year decline of 10% in Arkansas net farm income is more than the 6.2% national decline. Key production expenses for fertilizer, pesticides, and fuel are expected to decline 9% year-over-year (Figure 2). Total value of cash receipts for crops are projected to decline over half a billion dollars (or 10%) year-over-year. Livestock receipts are projected to rise $97 million (or 12%) along with a $74 million (or 6%) increase in purchased livestock expenses and a $574 million (or 18%) decline in feed expenses.

Figure 1. Year-over-year change to Arkansas net farm income and associated drivers This waterfall graph depicts the year-over-year change in Arkansas net farm income for the 2024 calendar year. The graph shows the magnitude to which the primary drivers of net farm income result in a 10% drop in 2024 net farm income relative to the 2023 calendar year.

Figure 2. Arkansas agricultural production expenses (2022-2025) This graph shows the change in key expenses for Arkansas agricultural producers over the years 2022 – 2025. Notably, the highest expense is consistently feed primarily for poultry production. 

Pivoting to impacts to commodity markets (Figure 3), Arkansas corn acres are projected to have the fewest acres since 2015 with a near record yield and the lowest price in 5 years. This equates to a $169 million (or 21%) year-over-year decline in corn receipts. Arkansas soybean acres are about in line with expectation at 3 million, the top crop in the state in terms of production area. The state average is projected to be a record at 55 bushels per acre but at a marketing year average price of $10.15/bushel, the lowest since 2019. Despite record yields, this results in a $375 million (or 17%) decline in soybean receipts.


Arkansas cotton acres are the most since 2011 despite the lowest season-average price ($0.66/lb) since 2020. The projected yield of 1,238 lbs/acre is the third highest yield in ten years. This results in a $67 million (or 10%) decline in cotton receipts. Arkansas rice acres are projected to come in at nearly 1.5 million, the most since 2020 making it the crop with the second-most acres in the state. The state-average yield is projected to be 7,600 lbs/acre (or 168.9 bu/acre) near the record set in 2021 (7,633 lbs/acre and 169.6 bu/acre). The season-average price is projected to come in at $14.10/cwt (or $6.35/bu) which is the lowest since 2021 when it came in at $13.88/cwt. Rice receipts are expected to increase 9% year-over-year driven by record yields and a relatively smaller price decline compared to the other major crops grown in the state. The increase in rice receipts for 2023 and 2024 are also driven by a 30% increase in planted acreage since 2022.

Figure 3. Arkansas agricultural commodity receipts for major crops (2022-2025) This graph shows the change in receipts for principal commodities produced in Arkansas over the years 2022 - 2025. Soybeans and rice comprise the greatest portion of 2024 crop receipts at 36% and 32% of total receipts, respectively. Corn and cotton make up the next highest portions with both comprising 13% of total cash receipts. Together, these four commodities consist of 94% of all cash receipts for commodities produced in Arkansas.

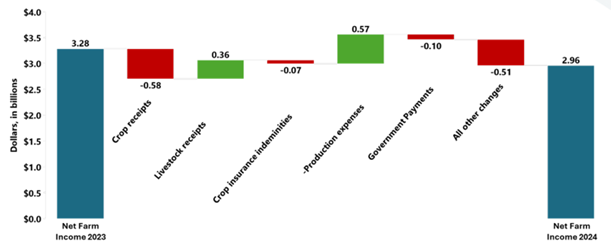
In the April 2024 report, the change in government assistance was projected to increase by $100 million. Given the relatively high yields across all major commodities, the fall 2024 report revised government assistance downward by $200 million. This may also be attributed to marketing year average prices coming in above the Price Loss Coverage statutory reference prices for most major crops except cotton. Notably, government assistance has shifted from primarily market-based programs (i.e., ARC/PLC) to supplemental and ad hoc disaster assistance since the enactment of the 2014 farm bill. Assistance from market-based and ad hoc programs accounted for 48% and 17% of total government payments, respectively, over the 2014-2018 period. Conversely, the breakdown for market-based and ad hoc assistance accounted for 18% and 63%, respectively, over the 2019-2024 time period.


The full report may be found at this link.


References


Plastina, A., Chinn, D., Biram, H., Mitchell, J., & R. Loy. Fall 2024 Arkansas Farm Income Outlook. RaFF Report #11-2024, Division of Applied Social Sciences, University of Missouri – Columbia. October 15th, 2024. (Link)

Arkansas Market Update

(as of October 23, 2024)


Exchange


Crop


Futures Month


Unit


Date (10/23/24)


Month Ago

(9/23/24)


Year Ago (10/23/23)

CME

Corn

DEC24

$/bu

$4.17

$4.14

$4.84

CME

Rice

NOV24

$/cwt

$15.13

$15.55

$16.12

CME

Soybeans

NOV24

$/bu

$9.92

$10.39

$12.95

CME

Wheat

JUL25

$/bu

$6.13

$6.17

$6.38

ICE

Cotton

DEC24

$/lb

$0.72

$0.73

$0.83

USDA-NASS


Peanuts*

Weekly U.S. Avg.


$/ton


$506


$532


$512

*SOURCE: Peanut Prices, Runner-type, USDA, National Agricultural Statistics Service, October 23,2024.

Fertilizer

State Average Cash Price

Urea ($/ton)

$480.00

34-0-0 ($/ton)

$465.00

Ammonium Sulfate ($/ton)

$520.00

DAP ($/ton)

$789.00

Triple Super Phosphate ($/ton)

$687.00

Potash ($/ton)

$455.00

Pellet Lime ($/ton)

$225.00

Off Road Diesel ($/gal)

$2.54

Highway Diesel ($/gal)

$3.30

NOTE: Each state average price is taken across multiple input suppliers across Arkansas. For a price more local to you, please contact Mr. Riley Smith at rsmith@uada.edu.

Mississippi River Level at Memphis, TN

(as of October 23, 2024)

Current Level (ft)

-8.69

Year Ago (ft)

-9.90

Critical Low Water Level (ft)

-5.00

Action Flood Stage Level (ft)

28.00

SOURCE: NOAA National Water Prediction Service

NOAA 7-Day Weather Forecast

(as of 10/23/2024)

SOURCE: NOAA National Weather Service Weather Prediction Center

Was this email forwarded to you? Subscribe here!
Accompanying Podcast on Fryar Center Webpage

University of Arkansas System Division of Agriculture | https://fryar-risk-center.uada.edu/