|
Good Wednesday morning!
Hard to believe it's been 23 years since 9-11 so just a thought and prayer to all those lives lost that fateful day.
Markets were extremely volatile yesterday and top line figures were mixed. I continue to say we are in a tricky environment right now and there doesn't seem to be an edge (that lasts for more than a few hours) for either side....bullish or bearish!
Ever since the Friday flush the markets have at least recovered those losses yet the bulls seem to be a bit hesitant to take it higher and keep it going. Bears tried to get it lower yesterday, however, at the lows of the day @ 12 Noon EST, buyers came back in and took the markets to new highs really putting a damper on the sellers enthusiasm. Basically we are stuck in a range in the /ES between 5507-5445 so until these levels get taken out, either higher or lower, consider this area a balance or congestion area.
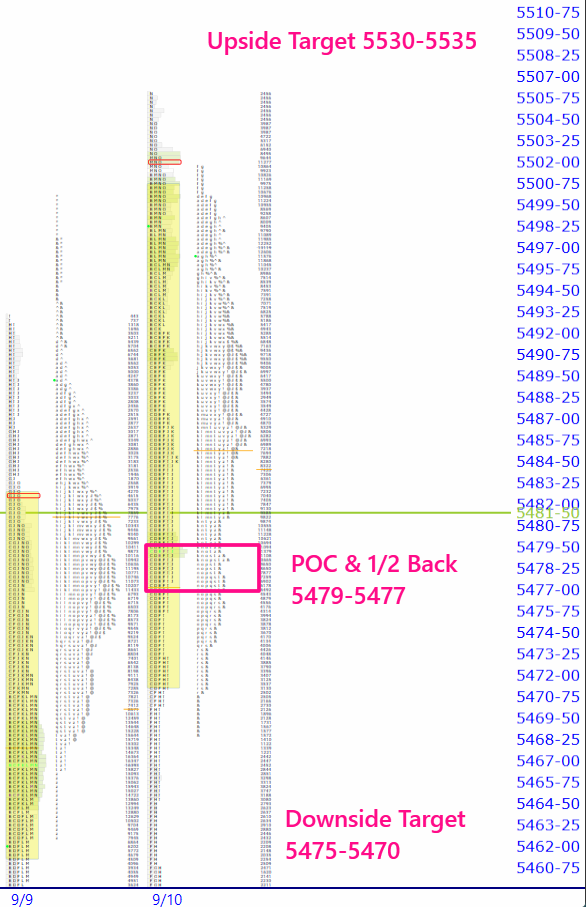
We just had some important economic data released, the CPI, Consumer Price Index, and the markets initially dropped sharply yet have recovered and are now bouncing back and forth within prior days range and even trying to make new overnight highs as we speak. Please notice in the profile pic below, the overnight range it basically the same and the Value Area from yesterday, and remember the VA is the range where 70% of prior day's volume occurred. This is important because traders and investors perceive "value" in this ares so until one side or the other believes either: 1.) Price is cheap and they put more money to work and buy, or 2.) Price is too expensive and they sell and look for lower prices! So until one side or the other breaks out of "value" then it is going to be a responsive day back and forth!
Some key levels that will help determine the strength or weakness are evident in the profile pic and key levels....use the 5479-5477 range as your "long or short" signals, then overnight highs or lows and value area highs or lows and then look for upper, or lower, targets!
VPOC Update: No new VPOC's yesterday so we still having 2 above and again 21 untested points of control below current prices.
TARGETS AND KEY LEVELS TO WATCH:
/ES upside target is: 5530 - 5535
Key Levels: 5479 -5477 POC and 1/2 Back
downside target is: 5475 - 5470
/NQ upside target is: 19,020 - 19,050
Key Level: 18,758 POC
downside target is : 18,740 - 18,700
/RTY upside target is: 2115 - 2125
downside target is: 2085 - 2075
Economic Data:
CPI @ 8:30 AM EST
Crude Inventories @ 10:30 AM EST
Treasury Buyback Announcement @11:00 AM ET
4-Month Bill Auction @11:30 AM ET
10-Yr Note Auction @1:00 PM ET
More Color....... By Analyst Rich Rickus
/ES - Demand $5470-78 then below at $5430 with Supply at $5510-5500
Bearish
Buyers trapped below $5477 and holding below after a pullback below $5470 looking to play SHORT targeting $5442 then $5431
Bullish
Sellers trapped above $5470 after a break and retest from $5472-75 playing long targeting Supply $5500
SPY - Demand at $545-546 w / Supply at $549 -550
Bullish
Sellers trapped above $545 looking to play LONG after a break and retest from $546 targeting $548 then $550
Bearish
Buyers trapped below $545 after a retest from $544 targeting $543 then $542s
/NQ - Key Demand at $18705- with Supply at $18745-20
Bullish
Sellers trapped above $18705 looking to play long targeting $18755 then
Bearish
Buyers trapped below $18640 and holding , looking to play short targeting $18600 then new LOD
QQQ - Key Demand at $455 with Supply above at $460
Bullish
Sellers trapped above $455 looking to play long from a break and retest at $456 targeting $458 then $460
Bearish
Buyers trapped below $455 after a break and retest below $454 looking to play short targeting $453
Have a great day!
|