Volume 216 | February 14, 2025


Guardian Asset Management

Weekly Newsletter

Guardian endeavors to provide you with the latest in housing, industry and market news from Washington D.C. and around the country. It is our goal as your industry partner to be informative, relative and topical.

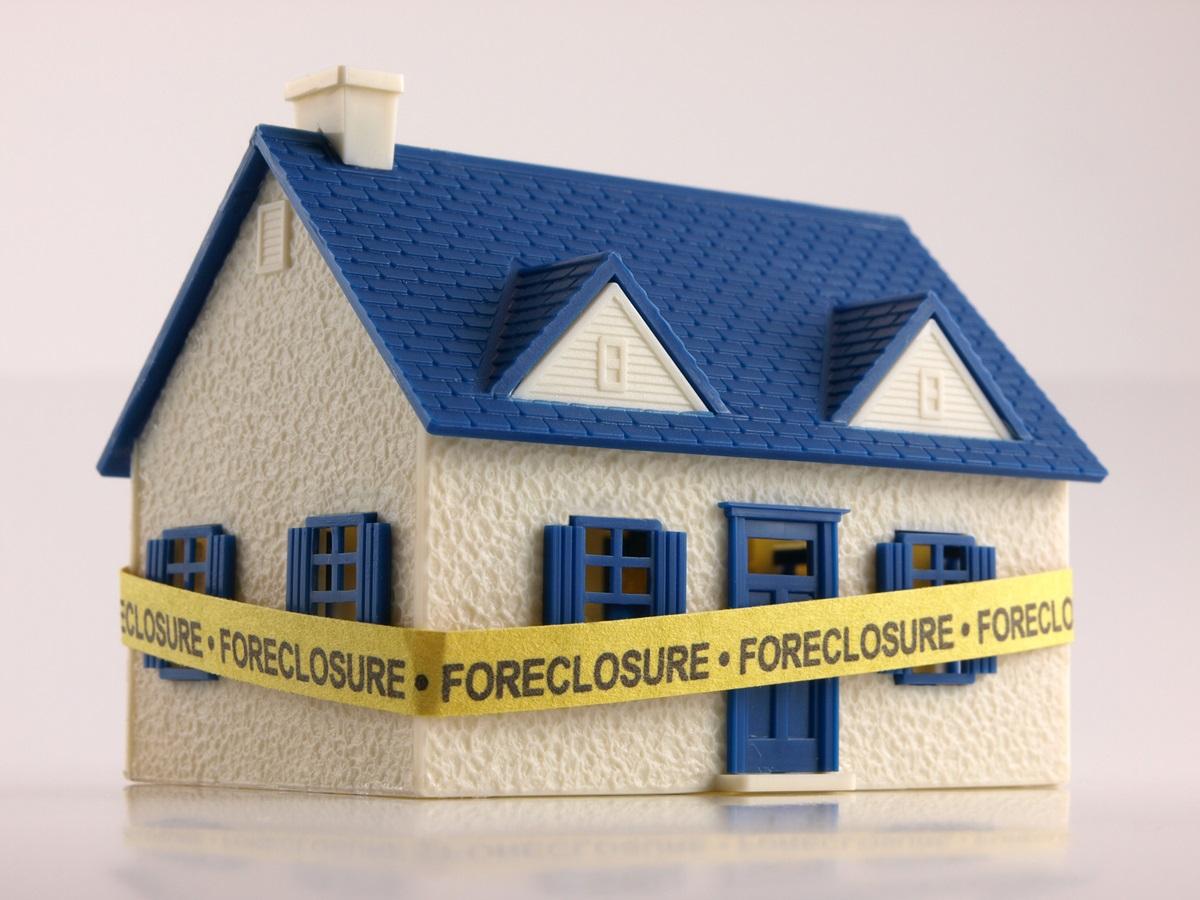
Foreclosure filings rise in January, but is it just seasonality?

Foreclosure filings started the year higher on a month-to-month basis, but the jury is still out on whether it is normal seasonality or signs of larger trend, Attom Data Solutions said.


In January, a total of 30,816 U.S. properties with foreclosure filings — default notices, scheduled auctions or bank repossessions – were recorded, up 8% from the prior month's 28,632 but down 7% from a year ago, when this totaled 33,270.


The monthly increase in foreclosure filings may be partially the result of what Rob Barber, Attom's CEO, called a normal post-holiday catch up for such activity. But it might be a precursor for a market that is on the downswing.

 
More Information

Q4 FHA and VA Delinquencies on the Rise


According to the latest Mortgage Bankers Association’s (MBA) National Delinquency Survey, the delinquency rate for mortgage loans on one- to four-unit residential properties increased to a seasonally adjusted rate of 3.98% of all loans outstanding at the end of Q4 2024.


The delinquency rate was up six basis points from Q3 of 2024, and up 10 basis points from one year ago. The percentage of loans on which foreclosure actions were started in Q4 rose by one basis point to 0.15%.


“Although mortgage delinquencies rose only 10 basis points in the fourth quarter of 2024 compared to one year ago, the composition of the delinquencies changed,” said Marina Walsh, CMB, MBA’s VP of Industry Analysis. “Conventional delinquencies remain near historical lows, but FHA and VA delinquencies are increasing at a faster pace. By the end of the fourth quarter, the spread between the FHA and conventional delinquency rates reached 841 basis points, while the VA and conventional spread was 208 basis points.”

More Information

January Foreclosure Activity Snapshot 


According to ATTOM’s January 2025 U.S. Foreclosure Market Report, 30,816 U.S. homes had foreclosure filings, such as default notifications, scheduled auctions, or bank repossessions. This is a 7% decrease from a year ago but an 8% increase over the previous month.


“January showed a monthly increase in foreclosure filings that may in some part be the result of a normal post-holiday catch up of filings,” said Rob Barber, CEO at ATTOM. “It’s too early to know if 2025 will shift from the general 2024 trends of a continued decline in foreclosure activity. We will keep a close eye on the market to see how interest rates, inflation, employment shifts, and other market dynamics impact foreclosures in 2025.”


In January 2025, 2,973 U.S. houses were seized by lenders through completed foreclosures (REOs), up less than 1% from the previous month but down 25% from the previous year. This continued the downward trend of yearly REO numbers that has been observed in 11 of the previous 12 months.

More Information

Monthly U.S. Foreclosure Activity increases in January


 ATTOM, a leading curator of land, property data, and real estate analytics, today released its January 2025 U.S. Foreclosure Market Report, which shows there were a total of 30,816 U.S. properties with foreclosure filings — default notices, scheduled auctions or bank repossessions – up 8 percent from the prior month but down 7 percent from a year ago.


"January showed a monthly increase in foreclosure filings that may in some part be the result of a normal post-holiday catch up of filings," said Rob Barber, CEO at ATTOM. "It's too early to know if 2025 will shift from the general 2024 trends of a continued decline in foreclosure activity. We will keep a close eye on the market to see how interest rates, inflation, employment shifts, and other market dynamics impact foreclosures in 2025."

 
More Information

Average Recovery Rate on Defaulted Commercial Mortgages Is Nearly 60%, RCA Study Shows

When commercial property loans go into default, how much can lenders reasonably expect to recoup from asset dispositions or the sale of mortgage notes? A new study from Real Capital Analytics (RCA) reveals that recovery rates on defaulted commercial mortgages vary by property type, location and loan-to-value ratios.


The New York-based researcher analyzed 145 defaulted commercial mortgages that have been liquidated this year. Of the $3.2 billion outstanding balance on those mortgages, lenders recovered $1.9 billion, equating to a recovery rate of nearly 60% before costs and fees.


Among RCA’s key findings:

• Development-oriented loans such as land and construction, condo conversion and redevelopment loans have a far lower average recovery rate (48%) than acquisition or refinancing loans (66%).

• Loans on developments not yet complete have the lowest average recovery rate of any loan type, just 32% of the outstanding balance.

• Among major income-producing property types, office buildings have the lowest average recovery rate (53%), but suburban properties have achieved a higher rate than CBD properties.

• Mortgages on retail properties have experienced the highest average recovery rate (72%) so far in 2009, but the sector has seen relatively few resolutions compared with the huge number of properties in default.

• Assets located in Phoenix, Tampa and Detroit have the lowest average recovery rate, while those in New York and Los Angeles metro areas have the highest recovery rate.

• The higher the loan-to-value at the time the loan was originated, the lower the recovery rate. Mortgages that were originally 50% loan-to-value experienced a 75% recovery rate, while those that were 100% or more at origination averaged a recovery rate of 57%.

• Of all loans originated for the acquisition or refinancing of properties, CMBS loans liquidated this year have the lowest average recovery rate (60%) among all lenders.

• Regional and local banks have experienced the lowest overall recovery rate, but that is largely due to a heavier concentration of development and redevelopment-oriented loans.

What’s the takeaway for commercial real estate borrowers and lenders from this study? “They need to think more carefully about the structure of their funding commitments and the impact of that structure on their investments in this notoriously cyclical industry,” emphasizes Ben Thypin, senior market analyst with Real Capital Analytics.

More Information

What Three Indicators Say About Where the U.S. Commercial Real Estate Market Ended 2024


Two of the three leading indicators for U.S. commercial real estate ended 2024 on an upbeat note, particularly on the lending and construction phase.


The commercial real estate lending market saw significant growth in Q4, as capital reallocation and improving fundamentals fueled a spike in loan originations, according to CBRE. The firm’s

Lending Momentum Index closed the quarter at 259, rising 37 percent year over year for Q4 and 21 percent for Q3, far exceeding the pre-pandemic five-year average of 229. According to James Millon, U.S. President of Debt and Structured Finance at CBRE, lenders should remain active in 2025 as maturing debt fuels refinancing and investment sales.

More Information