Happy Thursday!


We hope you're enjoying the more than welcomed rain this week, providing some much-needed relief to our lakes and landscapes. Fall is right around the corner, bringing pumpkins, Octoberfest brews, and hopefully, cooler, and wetter days.


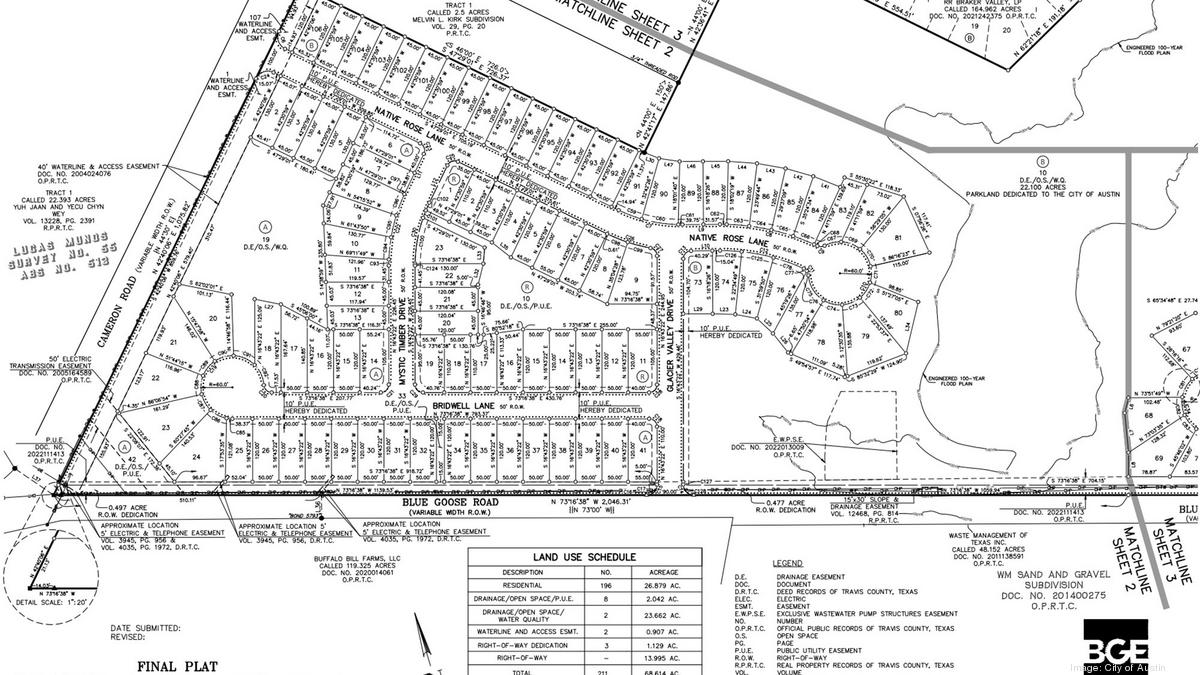
In this week's report, we dive into year-to-date stats for August, spotlight the Texas International Buyers report, and introduce an exciting 68-acre, community with 200 homes coming to North East Austin. For those in the industry and our investor community, we have a Bigger Pockets article we think does a great job of shedding light on why the housing market remains robust despite economic uncertainties, high rates, and shifting demand. Stick around for Central Texas' Octoberfest calendar, pumpkin patches, and fall fun!


As always, we're here to help you navigate the complex real estate market and greatly appreciate your referrals. We trust you'll find this update informative, so feel free to share it with others!

Community Update

Final plat approved for 200-home subdivision in Northeast Austin

Braker Valley, a new subdivision in NE Austin, is making progress towards construction. On September 5th, the Austin Zoning Commission recommended approval for the final plat of phase one. That includes 196 single-family lots and 12 green space lots, spread across 68 acres. This development is located just three miles south of Samsung Electronics Co. Ltd.'s Austin campus.

Read More

Texas is the 3rd hottest state for international homebuyers.

The trend of international buyers acquiring homes in Texas remains strong. The recently released Texas International Homebuyers Report ranks Texas third, following California and Florida. Foreign buyers accounted for 11.7% of all Texas Realtors transactions.

Read More

This Weeks New Listings

Local Market Update

AUSTIN MARKET YTD STATS BY ZIP CODE

Now, let's breakdown the ZIP Code report, courtesy of Independence Title. ITC Official statistics show that the Austin MSA's median sales price year over year is only down by 6.3% from last August. When considering year-to-date numbers from January 1st, 2023, to August 31st, we have a much bigger gap -11.2% decrease from 2022. Keep in mind, these figures represent averages for the entire MSA, and include the spring of 2022 which was the tip-top of the market.


However, when you break down the areas you can get a better picture , this report dissects each Austin MSA ZIP code with its set of year-over-year and year-to-date statistics. The Visual heat maps should also help provide a quick overview of appreciating areas, inventory levels, and sales trends.

Get the Zip Code Report

If you're in ZIP codes 78736, 78751, or 78722, you're in luck with positive appreciation ranging from 1% to 4% year to date. ZIP code 78612 in Cedar Creek was over 5%, and the standout performers are 78742 in SE Austin and 78616 with the highest positive appreciation rates. Most of the Austin area is experiencing appreciation between -1% and -4%.

In terms of inventory, the 78742 Zip Code stands out with the least amount of inventory in the city. NW Austin extending to Cedar Park and the SW ZIP codes 78748, 78739, and 78749 are also experiencing lower inventory levels than the rest of the city on Ave. On the flip side, Spicewood, Lakeway, BeeCave, Oak Hills 78736 and Driftwood had the highest inventory levels in August.

When it comes to number of sales Liberty Hill, Granger and Lockhart lead the way, with over 25% more sales, Due to all the new construction development. Manor is close behind in with 18% more sales YTD than in 2022. Elgin, Kyle and San Marcos all getting lots of Activity, as well (over 5%) including Austin Zip codes 78733, 46, 31, tha's Beecaves, Weslake/Rollingwood.

New Listing Activity

Investor Insights & Fall Activities

Seriously-Why Hasn't the Market Crashed Yet?

With soaring property prices, mortgage rates the highest they’ve been in decades, 2023 seemed ripe for a housing market correction. However, that hasn't been the case on a national level overall. Instead, property prices have remained largely stable throughout the year, and in some cases, they've even increased. Despite the challenges facing the residential housing market. This Bigger Pockets article really does a good job explaining how and why prices have displayed such resilience.

Read More

See our Weekly Market Report Archive Here

Mike & Steve Cossette 

(512) 299 5904

[email protected]


Do you know anyone who may need our services? Feel free to pass this email along and we can chat with them about their real estate needs!

Facebook  Instagram  Twitter  YouTube
LinkedIn Share This Email