| |
|
Most information reflected in this report is through December 2025
By Karr Ingham
InghamEcon, LLC
| | |
The Texas Workforce Commission released its revised Texas metro area employment data for 2025, and to a lesser degree, 2024 with minor impacts to prior years as well. The revisions are a part of TWC’s annual updating and rebenchmarking process in which monthly employment estimates are reconciled to more complete employer reports. The process establishes more accurate monthly employment estimates for the previous year and sets the benchmarks for monthly reporting in the year ahead.
The revisions added jobs to the monthly total employment estimates in 2024 but then lowered the estimates for 2025. On average, the original estimates were lowered by about 250 jobs per month in 2025, though by year-end the estimates had been lowered by about 800 jobs.
The results raised the Odessa Economic Index in 2024, especially in the final quarter of the year, but the index was lower compared to its original estimates in 2025, especially in the second half of the year.
The Odessa Economic Index finished the year on the rise, however, with monthly increases in both November and December.
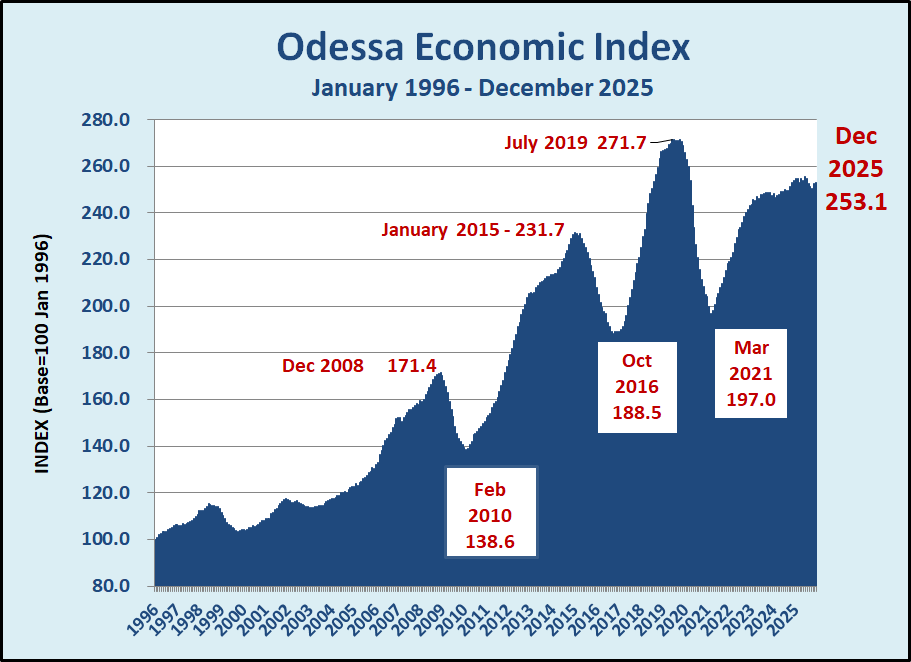
The December Odessa Economic Index improved to 253.1 up from the revised November index of 252.6, but down by 0.3% compared to the December 2024 revised (upward) OEI of 253.8. After reaching a multi-year high in February 2025 the index flattened for the balance of the year and fell slightly below its year-ago level in November and December.
The Odessa Economic Index achieved its all-time high of 271.7 in July and October 2019 before falling victim to a slowing oil and gas economy in 2019, followed by COVID in 2020. As of December 2025, the OEI remains 6.8% below the 2019 record levels.
With the increases in November and December, the OEI increased at an annualized rate of 2.6% in the fourth quarter of the year.
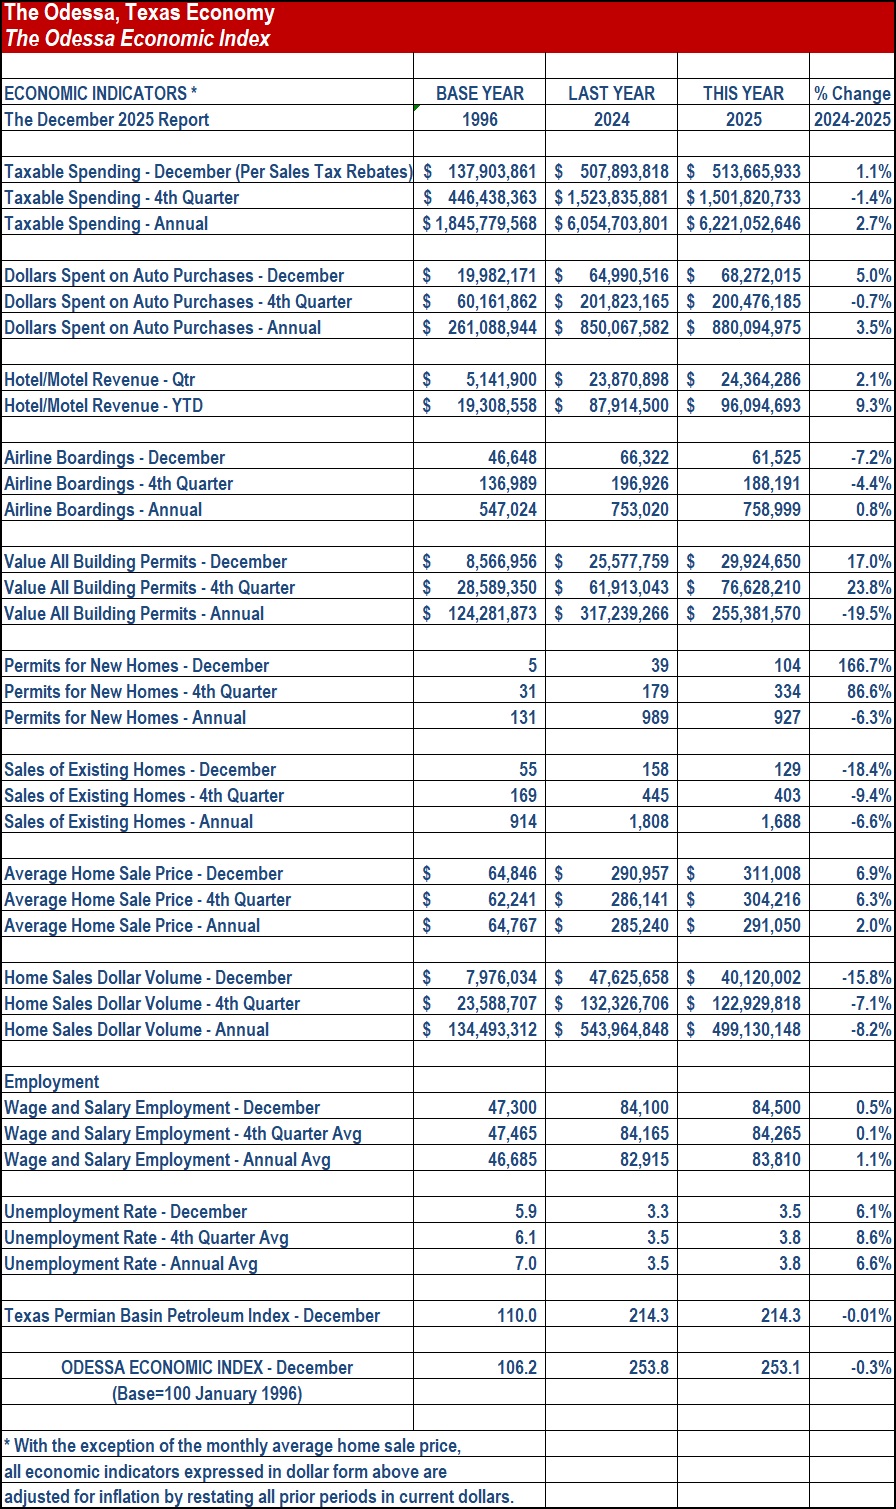
On balance, the various Odessa economic indicators were a bit anemic in 2025, with annual increases in some, and annual decreases in others. The spending indicators were modestly higher for the year, and employment continued to register growth, though at a slow pace. The unemployment rate was higher for the year, and the construction sector was lower for the year though activity turned upward in the fourth quarter and December.
Home sales were lower across the board in 2025, though the average price of those sales was higher. The real dollar volume of existing home sales fell significantly in 2025, including December and the fourth quarter.
| |
The Texas Permian Basin Regional
Oil and Gas Economy
| | |
Prior to the market events of 2026, crude oil prices continued to decline through year-end 2025, natural gas prices had once again gone negative, and the rig count continued its year-long decline. The number of drilling permits issued was sharply lower for the year, and crude oil well completions were down in 2025 as well.
Crude oil production on the Texas side of the Permian Basin was slightly lower in 2025 as a result, though the Permian Basin continued to climb and set a new record for the year.
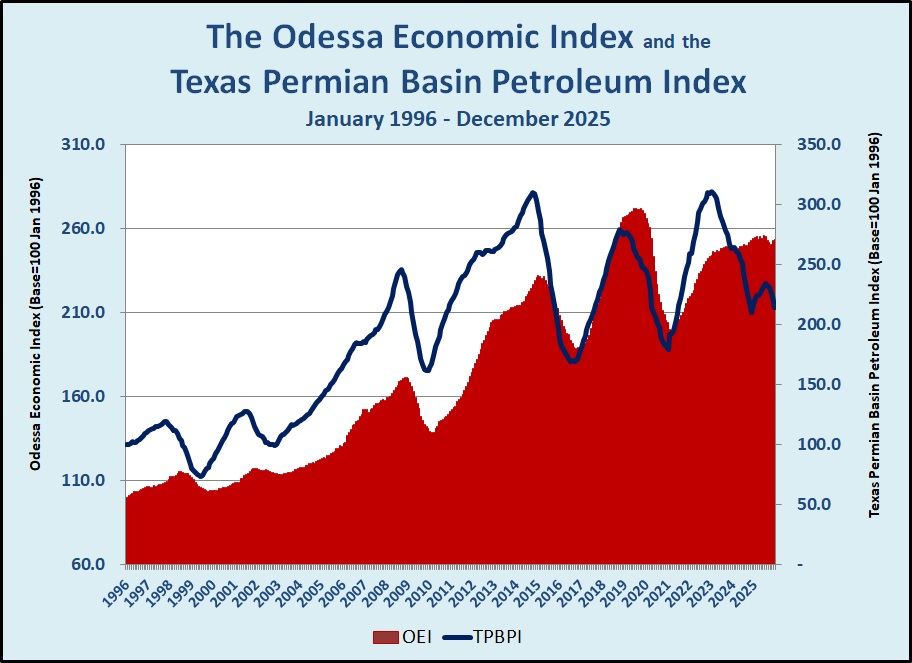
The Texas Permian Basin Petroleum Index had reversed course and increased for several months in 2025 because of natural gas price increases and the resulting impact on production values but then turned downward again to finish the year with five straight monthly declines. The December 2025 Texas Permian Basin Petroleum Index of 214.3 was down sharply from the November index of 222.8, and was flat compared to the December 2024 TPBPI, also at 214.3.
Crude oil prices averaged $53.86 in December (WTI posted), an 18% decline compared to the December 2024 monthly average of 65.62. In real terms the December crude oil price decline was 20%, and the annual average was over 17% lower compared to the prior year.
Natural gas prices at the Waha Hub, the price point for Permian-produced natural gas, remained negative on average in December at -$0.92/mmbtu. Lower natural gas prices result in effectively lower crude oil prices as well, as producers must pay to have their gas taken away.
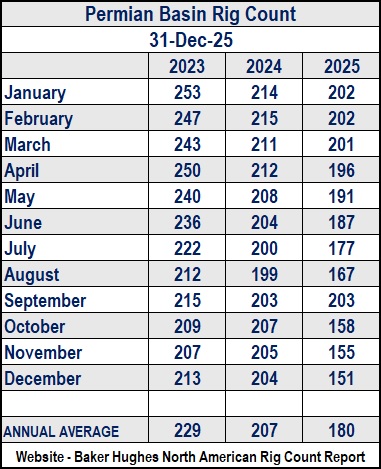
The regional rig count (RRC districts 7C, 8, and 8A) fell to its lowest levels since COVID in 2025, ending the year at 151, with three straight years of decline.
The number of drilling permits issued in 2025 was the lowest since the COVID year of 2020 at 4,727 original permits, a year-over-year decline of 18%.
Even after the employment data revisions of 2025, amazingly direct upstream oil and gas employment continued to add jobs, albeit at a slower rate, at about 1.0%. Oil and gas employment in the Midland and Odessa metro areas reached a record 45,900 in August 2025.
Crude oil production in RRC districts 7C, 8, and 8A posted several year-over-year declines according to current estimates early in the year 2025, and finished the year slightly lower compared to a record year (and 8% growth) in 2024. A new daily record was set in November 2025, however, averaging 4.47 million barrels per day for the month.
| | |
The Odessa General Economy
Following the downward revision in Odessa employment data for 2025, total employment in the Odessa metro area finished the year with a slight 0.5% increase over 2024. That is according to the non-seasonally adjusted estimates shown on the table of economic indicators. The seasonally adjusted estimates suggest monthly employment in Odessa peaked at 84,000 in March, April, and June before ultimately losing about 300 jobs by year-end.
The Odessa unemployment rate increased in 2025, however, finishing the year at a still respectable 3.5% in December compared to 3.3% in December 2024.
General real (inflation-adjusted) spending per the Odessa monthly sales tax rebate returned to growth in 2025 after declining in 2024, increasing by 2.7% for the year. Fourth quarter spending was lower by about 1.4% year-over-year, though spending per December rebate was up slightly at 1.1%. Even with that improvement, however, general real spending remains significantly lower compared to the record years of 2018 and 2019.
Auto spending also recovered in 2025 after declining in 2024, with inflation-adjusted spending on new and used motor vehicles up by 3.5% for the year. Fourth quarter auto spending was down slightly, but the December monthly total was up by a solid 5.0% year-over-year. Similarly, auto spending also remains lower than in the record years of 2018 and 2019.
Hotel/motel activity improved in 2025, though slowing later in the year. For the year, real spending on lodging in the city was up by over 9% for the year compared to 2024. Airline passenger activity at Midland International Airport slowed considerably later in the year, down by over 7% in December and over 4% in the fourth quarter but managed to finish barely higher for the year as a whole.
| | |
Construction activity came on stronger toward the end of the year with a fourth quarter increase of nearly 24% in terms of the real valuation of building permits issued, including a 17% increase in the month of December. Activity was sharply lower in the first three quarters of the year, however, and finished the year down by nearly 20% compared to the 2024 annual total.
Included in those valuations are new housing construction, and the 334 permits issued in the fourth quarter is a new fourth quarter record and is the second-highest total for any quarter behind only the 375 permits issued in the third quarter of 2024. Still, new housing construction permits were over 6% lower for the year.
Existing home sales were down across the board, however, posting year-over-year declines in December, the fourth quarter, and the year. The number of closed sales fell by 6.6% in 2025 compared to 2024, including declines of 9.4% in the fourth quarter and a sharp 18.4% in December. The average price of those sales increased, however, adding 2.0% for the year, and 6.3% in the fourth quarter including a 6.9% increase in December.
| | |
The real total dollar volume of home sales activity was down by over 8% in 2025, however, owing to the lower sales totals and the inflation-adjustment. Fourth quarter home sales activity by this measure was off by over 7% in the fourth quarter, and by nearly 16% in December.
Given the pressure imposed by lower crude oil and natural gas pricing, along with rig count decline in 2025, the Odessa general economy performed admirably well in 2025, managing to avoid a sharp decline in aggregate activity as represented by the Odessa Economic Index, and posting gains in spending and employment.
Crude oil markets and pricing have obviously been upended since year-end 2025 with the war in Iran and the resulting sharp increases in prices. What does this mean for the regional oil and gas economy and the Odessa general economy in 2026? This ongoing analysis will answer those questions, so stay tuned!
| | Follow the Odessa Development Corporation: | | | | |
Tom Manskey, CCE, IOM
Director of Economic Development
Odessa Chamber of Commerce
700 North Grant, Suite 200
Odessa, Texas 79761
(432) 332-9111
tom@odessaecodev.com
| | Our Company | Contact Us | FAQs | Privacy Policy | | | | |