Market Update - July 2023 | |
After the 1-month recession of 2020, many investors expect shorter bear markets and economic recessions in the future. While we can all hope that bear markets will be short, it has not always been so. For example, 22-years ago we had a 3-year long bear market straddling an eight month recession (March-November 2001). Waiting for a bottom can require patience for the Fed's bitter medicine to work its way through the system. | |
- Many leading indicators are predicting an immiment recession, although there are some data points that show the economy is still growing.
- Equity markets rose across the board as the optimism on technology stocks leaked over to the broad indexes.
- Our view is that stock market is about to finish a bear market rally. The Fed is still raising rates, core inflation is high, employment is weakening, and the side effects of higher rates and bank failures is in front of us.
| |
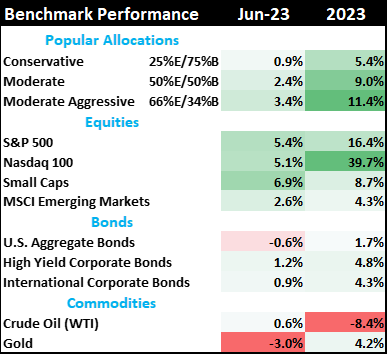
Table 1: Market performance estimate as of 6/30/2023 (LIMW) | |
|
During June, most equity markets moved significantly higher on news that the economy was still growing while the Federal Reserve declined to raise interest rates at their most recent meeting. Small caps rallied the most, while large caps and emerging markets performed similarly. Gold lost ~3% as headline inflation readings in the US continue to fall.
Bond markets were broadly unchanged in June, but weakened after the 1Q2023 GDP was revised up to 2%. Clearly, the bond market has a different view of how policy and economy growth are going to play out over the next few years. Bond investors are worried about inflation.
| |
Manufacturing in recession, while Service economy chugs along (so far) | |
|
There is a lot of conflicting data reported on the US economy.
To correctly analyze whether the news is useful, you must consider whether the data points are Leading, Coincident, or Lagging indicators. We tend to focus on the Leading indicators because that is what drives the market.
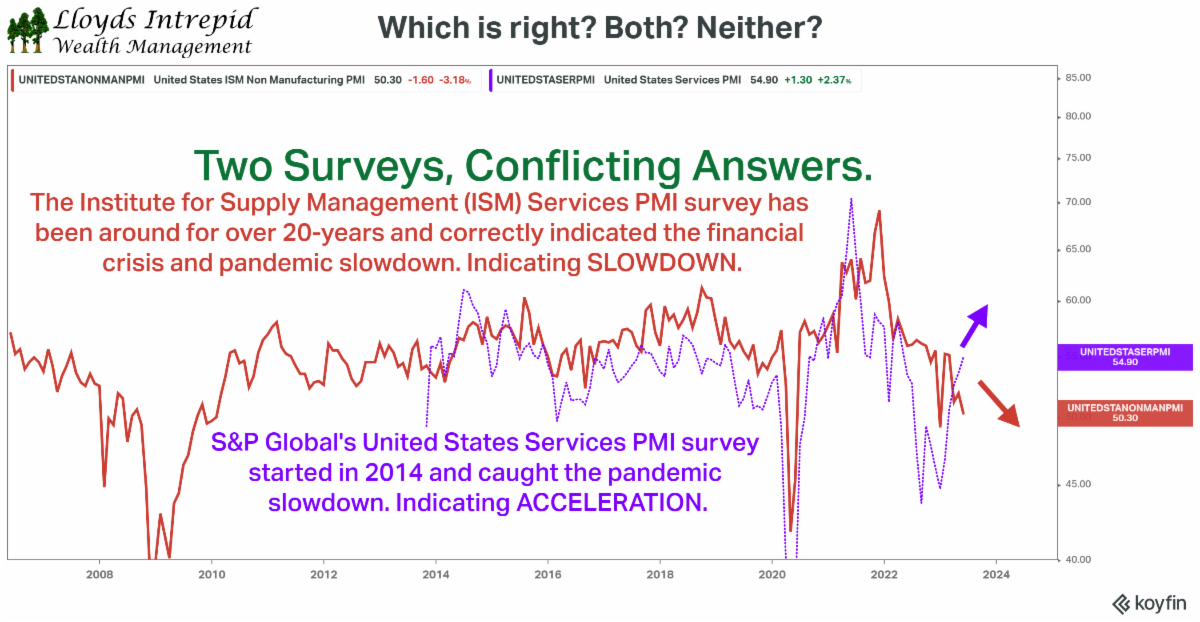
Sometimes the leading indicators can be in conflict. The chart below shows one of those discrepancies. We follow the Service sector Purchasing Manager Index (PMI) data very closely to see when the US economy finally tips over into a serious recession. Here in the US, we have two companies reporting the same metric using similar methodologies, but different survey populations. Naturally, they are pointing in different directions.
S&P Global reports PMI surveys for many major countries, including the US. Because of its global nature, the survey participants in the US are fewer than those of their competitors at the Institute for Supply Management (ISM). The ISM folks have a much deeper survey with more participants and a focus on the US economy.
S&P Global is indicating the US Service economy is expanding; ISM is stating the US Service economy is contracting.
Incidentally, most of the manufacturing PMI readings are saying we are in recession already.
Figure 1: Most Manufacturing ISM readings indicate recession, but the Service ISM readings conflict (LIWM)
| |
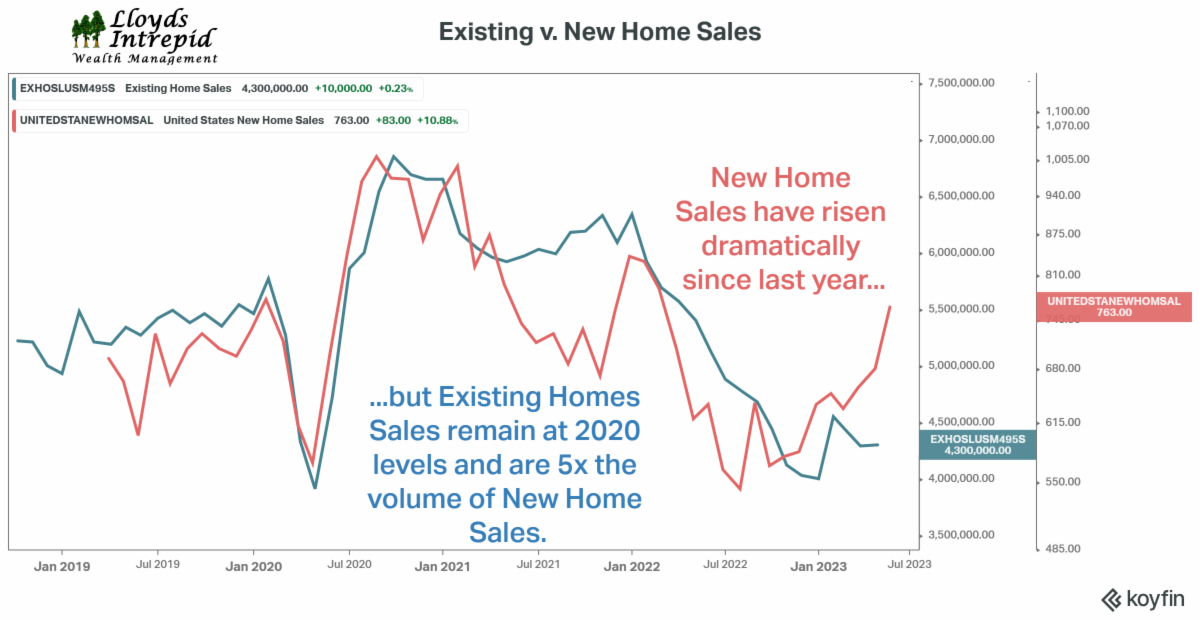
Housing is great; housing is lousy
Another sector with a combination of good and bad news is the housing sector. Existing home sales have fallen to 2020 levels. If you have a low interest rate mortgage on your house, you aren't moving anywhere.
Conversely, robust new homes sales may indicate a resurgence in economic growth, but the real reason is more nuanced. Because so many people are locked into low-mortgage homes, the supply of homes is much lower than demand. In addition, new home prices have fallen about 16% from their highs in 2022. Both of the factors help explain the jump in new home sales.
Figure 2: Existing Home Sales versus New Home Sales (LIWM)
| |
Figure 3: Median Price of New Home Sales (Wolfstreet.com, Commerce dept) | |
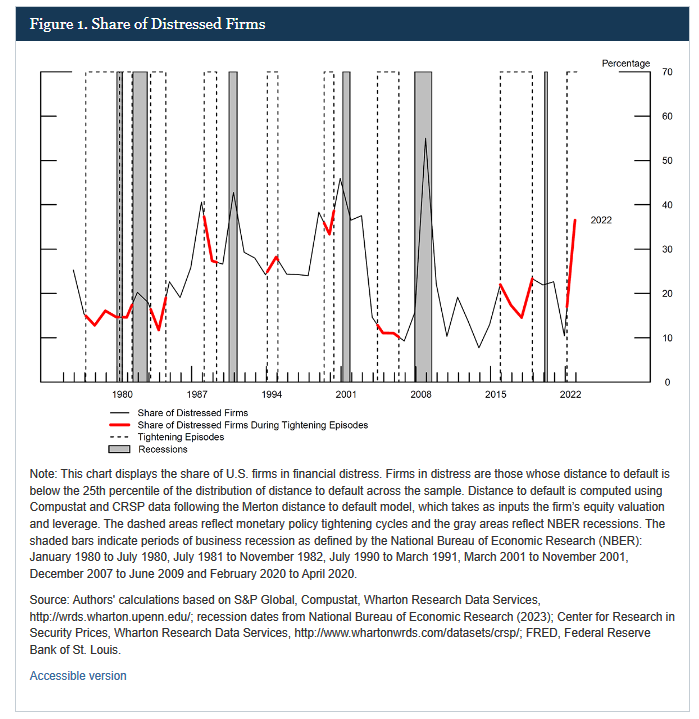
Many firms are falling into distress | |
|
The Federal Reserve recently came out with a study looking at the proportion of firms in financial distress using standardized accounting measures and the Merton distance-to-default measurement. It is not encouraging.
Their key conclusion was that 37% of non-financial firms are at risk of default. Since the financial crisis in 2008, firms have been encouraged to take on debt to facilitate business expansion or stock buy-backs.
As long as revenue grows and debt can be refinanced at low interest rates, no problem. Obviously, interest rates are the highest in fifteen years and new debt will create significant amounts of interest expense. The result is higher risk of default due to worsening net cash flow. The bill for all that stimulus in the 2010s is coming due.
| |
Figure 4: Number of distressed firms skyrocketing (Federal Reserve) | |
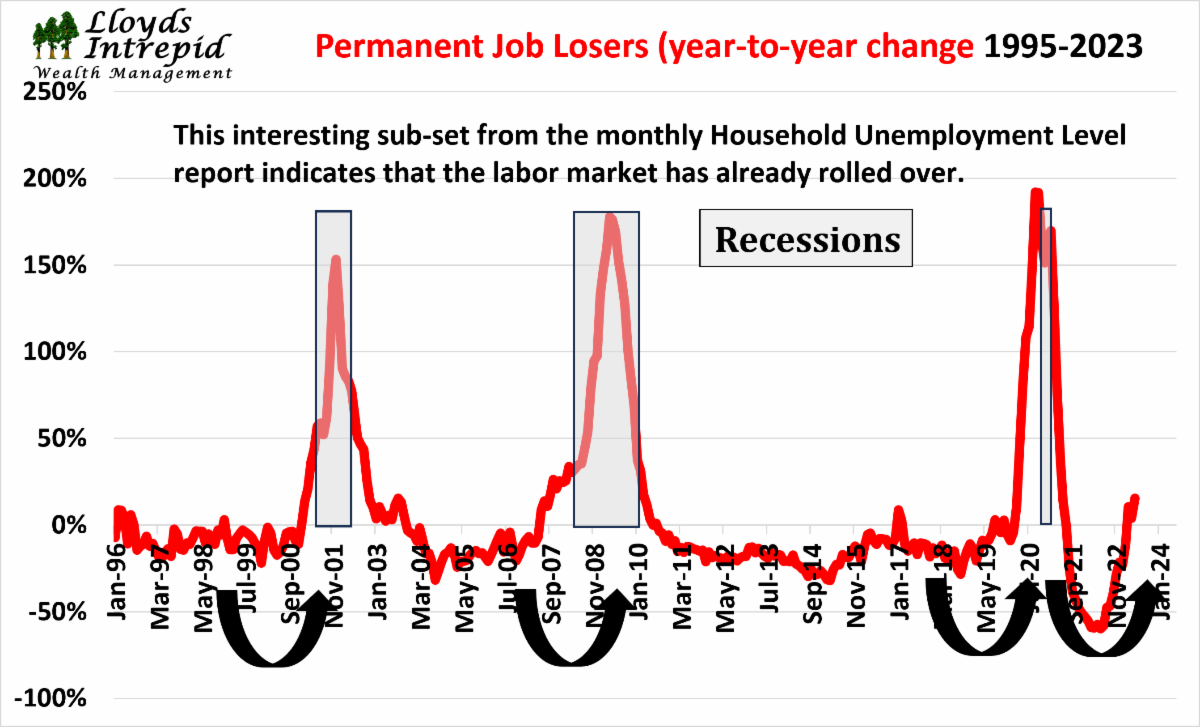
Employment continues to weaken | |
|
Each month we get two key snapshots of the labor market: the Payrolls Survey of corporations and the Household Survey unemployment rate from individuals.
Inside the Household Survey is a measurement of permanent job losers. These are people who had full time jobs with benefits and are now getting laid off. Remember, labor is a major cost for any business operation. When times get tight, companies naturally shrink their payrolls to compensate. Full-time employees with benefits are the most expensive workers, so letting them go is frequently a significant cost savings.
Labor data is typically a Lagging indicator and confirms that the US economy has already slowed dramatically.
| |
Figure 5: Permanent Job Losers from the Household Survey increases dramatically (LIWM) | |
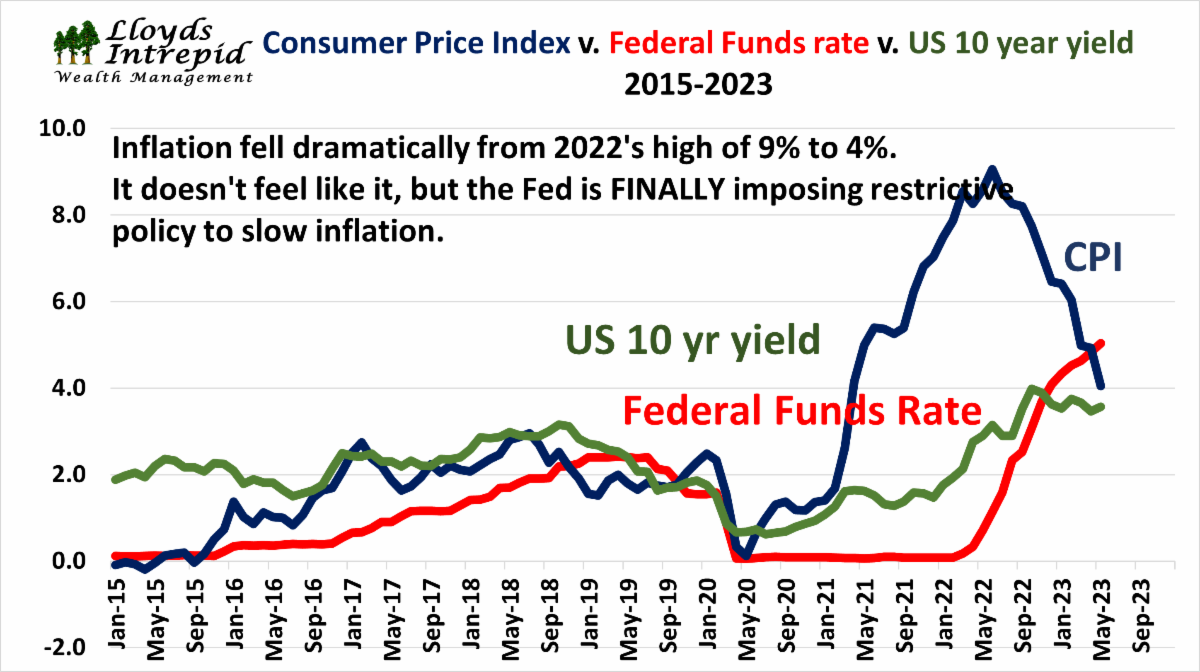
Headline inflation falls below 5%... | |
|
Headline inflation continues to fall as weak commondity prices flow through the data. This is encouraging because it implies that our high inflation may be temporary, even if the likelihood of price declines are small.
Figure 6: Headline Inflation, 10-year Treasury yields, and Federal Funds rate (LIWM)
| |
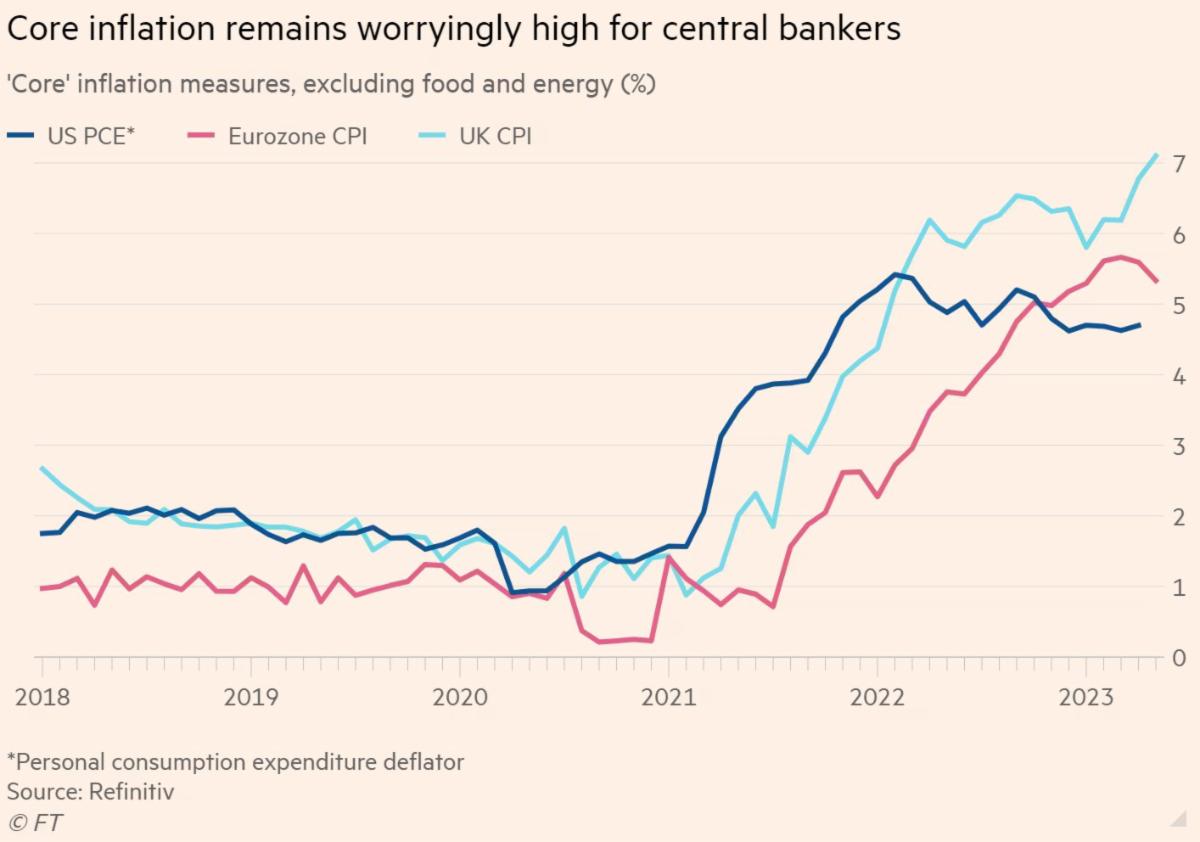
...while Core inflation remains stubbornly high | |
|
While headline inflation is falling, core inflation rates in the West are holding up at very high levels. The reason Core Inflation rates are important is because the central bankers are focusing on bringing these metrics down. So far, Core Inflation rates have not cooperated.
Core inflation is strongly affected by wages and housing costs. Sadly, it is unlikely these expense categories will fall as we see with the commodity markets. Prices go up, but rarely go down in this part of the economy.
Figure 7: Core inflation metrics from the US, UK, and EU (Financial Times)
| |
 |
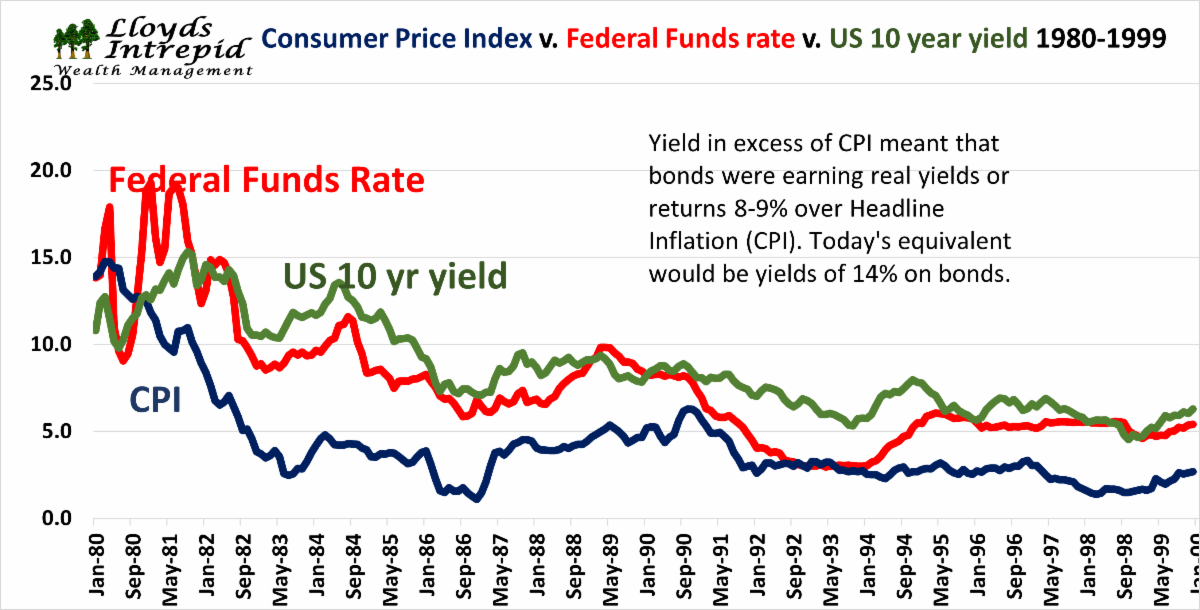
Is the Fed even trying to slow inflation?
There are some concerning parallels between the 1970s and today's economic environment. In the late 1960s, we had the Vietnam War and the Great Society programs pumping money into the economy. Today, we have the Pandemic Stimulus spending and some permanently higher federal budget items. Check.
In the 1960s, the Federal Reserve under Arthur Burns dealt with rising inflation from higher spending by raising interest rates and triggering a recession. Today, the Federal Reserve under Jerome Powell is doing the same thing. Check.
But was Burns as incompetent as history makes him out to be? Probably not as he aggressively raised rates causing two major recessions (1970 and 1975). Is Powell following in his steps? The answer sadly seems to be a weak "maybe". If we compare the intensity of the rate increases under Burns, Powell is not really coming close, so far.
The following chart is a comparison of 10-year Treasury yields and Federal Funds policy rates over time. In red, you see the 1960-1980 time frame; in purple you see our current experience beginning in 2015. The Powell Fed is not imposing the anti-inflationary policies as strongly as Burns employed in the the 1960s and 1970s.
This perspective is important because as investors, we do not want to relive the 1970s again. What was needed in the early 1970s were much higher interest rates to slow the economy and ease inflation. Burns was not willing to do so and so far Powell is following in his steps.
Figure 8: Comparison of yield curve inversions 1970 and today (LIWM)
|  | |
What Volcker did to kill inflation | |
|
A key reason we want to avoid a long period of rising inflation like the 1970s is because the medicine to correct inflation is quite painful.
Paul Volcker is remembered as the Fed Chairman that raised interest rates to 20% to break the back of inflation in 1980. What many forget is that he kept the Federal Funds rate well above headline CPI for nearly 10 years. That was a long time of mildly restrictive monetary policy. In many ways, this solution to inflation is the opposite of what most investors have experienced over the last 20 years.
If the Fed imitates Volcker, the markets are in for a series of shocks. Based on our work, the Fed under Jerome Powell isn't coming anywhere close to the policies of Paul Volcker.
There are several writers commenting that falling inflation is good for stocks based on the 1980-2000 experience. What they don't mention is that the stock market performed poorly while inflation was rising.
Figure 9: Fed Chairman Volcker policies that killed inflation (LIWM)
| |
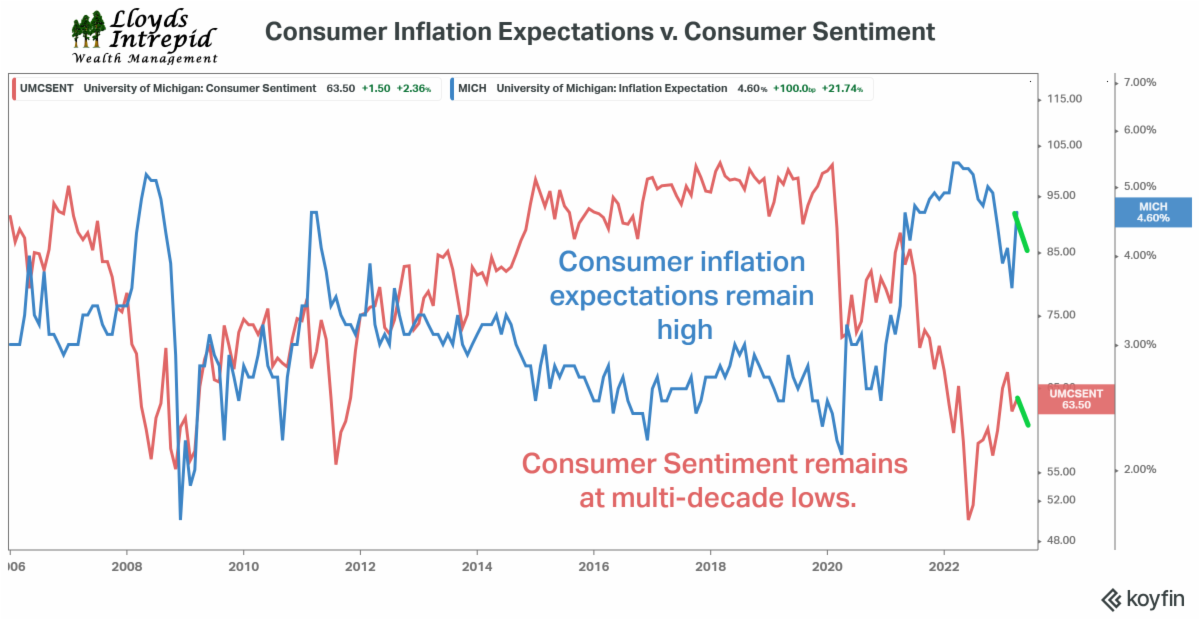
Consumers are worried about inflation and depressed about the future
Some of the recent Consumer Confidence surveys have come back positive. Our preferred metric is the University of Michigan survey. It shows the consumer is still expecting high inflation and is upset about the future.
Consumer expectations play a big role in Fed policy, so it is possible that the Fed will continue to raise rates if inflation expectations are high and actual headline inflation is falling. There is no easy way to forecast this. (The green bars are the latest May 2023 data points).
Figure 10: Consumer Inflation Expectations versus Consumer Sentiment (LIWM, University of Michigan)
| |
Mortgage rates and earnings | |
|
We know higher interest rates have a negative effect on corporate earnings. This comparison of 15-year mortgage rates and S&P 500 earnings is an attempt to estimate the size of the potential earnings downside potential caused by the sudden rise in interest rates.
Because mortgage rates approximate the cost of money in the private sector, it is not a surprise that there is a negative relationship with earnings. What is most interesting is the lead time of over 3 years! In the last 2 recessions (2008 and 2020), mortgage rates provided an extremely long lead on the future trajectory of earnings.
Do you see today's peak in S&P 500 earnings? Where were interest rates 3 years ago (hint: almost zero.)
This is important because stocks will follow earnings. If they fall, the markets will fall.
Figure 11: 15-year Fixed Mortgage rates (Inverse %, forward by 3.5 years) compared to S&P 500 earnings (LIWM)
| |
LIWM bear market indicator
Our bear market indicator is based on the top five Leading indicators of stock market performance: 1) 10-year and 2-year Treasury bond yields, 2) Inflation, 3) Institute for Supply Management Purchasing Manager Index for manufacturing activity, 4) Stock market valuations, and 5) Unemployment.
This indicator is off the cycle high, but still indicates a 75% probability of bear market in the future. Of the five indicators, only the ISM manufacturing PMI is in recession territory. All the others are still at bull market high levels.
Our indicator is recommending caution in the current market.
Figure 12: LIWM Bear Market Indicator through May 2023 (LIWM)
| |
Current market commentary | |
|
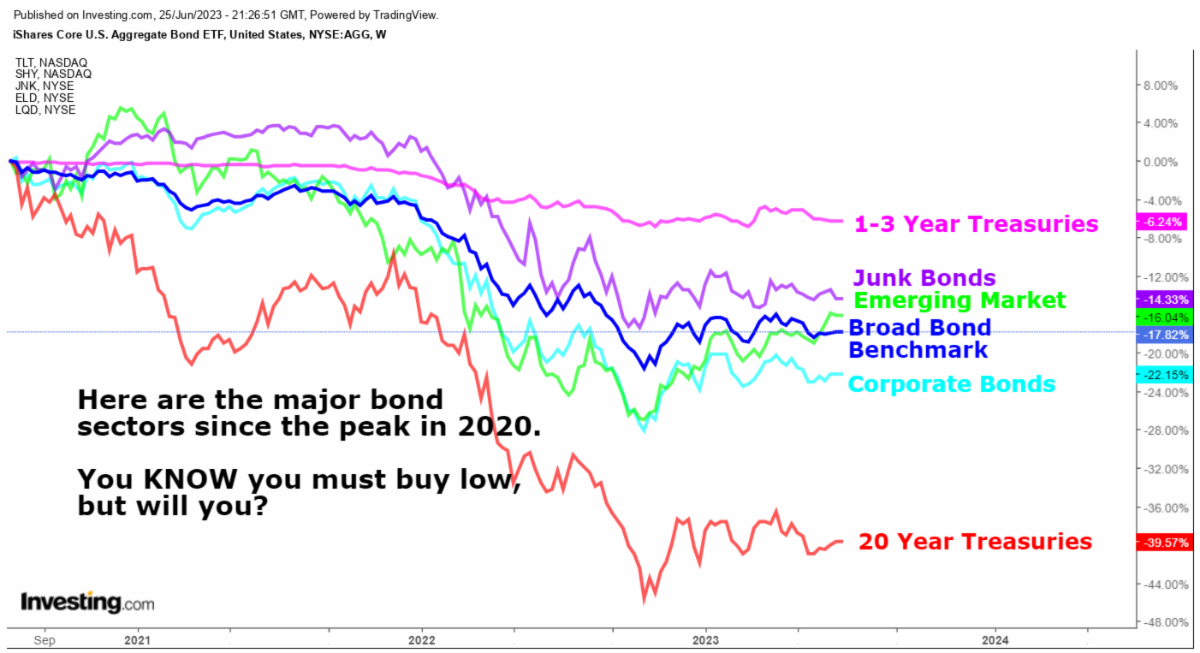
The bond market is torn between the opposing forces of inflation and recession.
On the one hand, core inflation readings are not falling hinting that inflationary pressures may get anchored in the economy. This implies that the current interest rate policy from the Federal Reserve is not strong enough to overcome inflation and that we will replay the 1970's inflation experience. This is the bond market's bear case.
On the other hand, many leading indicators of economic growth are showing we are either in or on the verge of a recession. In most recessions, inflation falls dramatically as economic activity declines. As inflation falls, bond yields fall. Remember for bonds, the rule is "yield down, price up." This is the bond market's bull case.
You can see this dynamic play out in the following chart showing the performance of key bond sectors. Longer-duration bonds are more sensitive to changes in interest rates, which is why the 20-year Treasuries have performed so poorly since 2020. In our view, this is where the opportunity exists in the bond markets at this time.
Figure 13: Key bond market sector performance from the 2020 top (LIWM)
| |
|
The equity market has broken through key resistance and is making new 1-year highs. How can this be with the slew of bad news coming down the pike?
There are many different types of investors. Most of you reading this are long-term investors saving for retirement or some other long term goal. Your investing strategies mirror those of insurance companies, mutual funds and pension funds. However, there is a small army of short-term traders: hedge funds, algorithmic (computer) traders, commodity trading advisers, and options traders.
Of all the short-term traders, it is probably the hedge funds and options traders driving the market up. Hedge funds can "short" the market. That means they make trades hoping the market will decline. When the market goes up, they frequently close their bearish positions. This is called a "short squeeze".
Options trading volume recently reached a new all time high. The most popular options are extremely short duration options of 1-day or 1-week. With each option trade there is a need to hedge the position and typically the hedging party must "buy" equities to offset the risk in the option "sale". This creates a mechanical bid under the market that tends to run for a period of time.
These trading strategies magnify the movements up and down. As they become more popular, we expect them to push the market down, just as they pushed the market up.
While it is understandable to hope that October 2022 was the equity market bottom, our research indicates that there are still some tough times ahead. Of course, this will create great investing opportunities for those who are prepared.
Figure 14: Current equity market situation (LIWM)
| |
Final Thoughts: It's never different this time | |
|
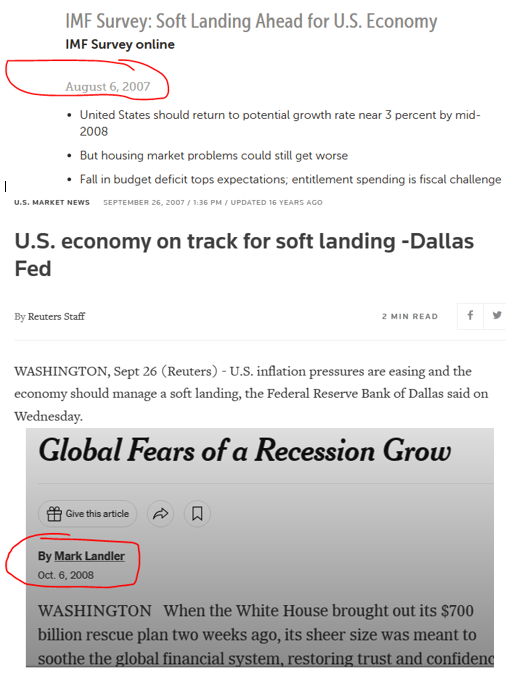
In recent weeks, many financial news reporters have been commenting on the resiliancy of the economy and markets in the face of 5% Federal Funds rates and higher interest rates in all other bond categories. It is astounding how the consumer continues to spend, spend, spend.
These comments are eerily familiar and echo similar commentary from 2007. Back then the Fed had gradually raised interest rates to 5.5%, but the economy refused to slow down. The bullish argument was that if the economy could handle 5.5% rates, it must have really strong fundamentals.
Of course, we know how that all turned out. Today, we are already into a banking crisis that exceeds 2008 in dollar terms. Yet, incredibly, most equity investors have shrugged their shoulders and moved on. Let me assure you that all monetary policy changes (i.e. Fed policy changes) happen with long lags that are anywhere from 6-18 months long. The real pain is coming, we just haven't seen it all yet.
So, let me introduce you to the most dangerous phrase in finance: It is different this time. Historically, it's never different and while each cycle is unique, there are important commonalities. It is highly likely these higher interest rates are going to create serious economic problems with unforeseen consequences.
Figure 15: 2007 Headlines discussing the anticipated "soft" landing for the economy (New York Times, Reuters, IMF)
| |
|
If you are concerned about your situation and would like to speak with us, please reach out to us at the phone numbers below.
We look forward to hearing from you!
| |
|
Rob 281-402-8284
Chris 281-547-7542
| |
|
Christopher Lloyd, CFP ®
Vice President and Senior Wealth Planner
Lloyds Intrepid Wealth Management
1330 Lake Robbins Dr., Suite 560
The Woodlands, TX 77380
281-547-7542
Chris.Lloyd@lloydsintrepid.com
www.lloydsintrepid.com
| Lloyds Intrepid LLC is an Investment Advisor registered with the State of Texas, where it is doing business as Lloyds Intrepid Wealth Management. All views, expressions, and opinions included in this communication are subject to change. This communication is not intended as an offer or solicitation to buy, hold or sell any financial instrument or investment advisory services. Any information provided has been obtained from sources considered reliable, but we do not guarantee the accuracy, or the completeness of, any description of securities, markets or developments mentioned. We may, from time to time, have a position in the securities mentioned and may execute transactions that may not be consistent with this communication's conclusions. Please contact us at 281.886.3039 if there is any change in your financial situation, needs, goals or objectives, or if you wish to initiate any restrictions on the management of the account or modify existing restrictions. Additionally, we recommend you compare any account reports from Lloyds Intrepid LLC with the account statements from your Custodian. Please notify us if you do not receive statements from your Custodian on at least a quarterly basis. Our current disclosure brochure, Form ADV Part 2, is available for your review upon request, and on our website, www.LloydsIntrepid.com. This disclosure brochure, or a summary of material changes made, is also provided to our clients on an annual basis. | | | | |