|
October 2026 Newsletter
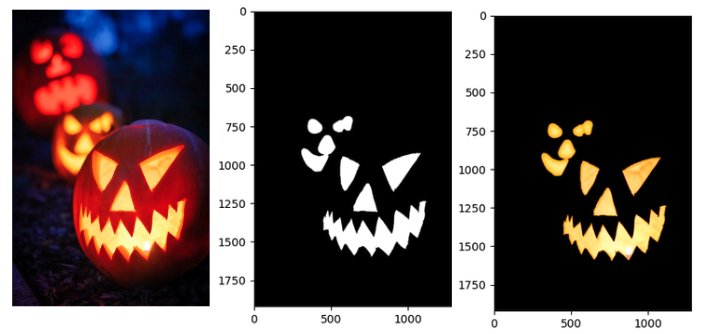
Happy Halloween from PlantCV! Below is a pumpkin segmentation. Left to right: original image, mask, and overlay of mask on the original image.
| | |
PlantCV v5.0 Release Candidates Now Available
Last newsletter, we described the PlantCV v4 release and publication. We have been hard at work on PlantCV v5.0, now available on GitHub and PyPI! v5.0 is a significant internal refactor: simplified and renamed parameters, a leaner utils module, and lazy-loading across several modules that noticeably speeds up import time. It also brings new analysis features, described below. If PlantCV is part of your pipeline, now is a good time to test your workflows against the release candidate and let us know if anything breaks before the final v5.0 ships by posting issues on GitHub. Make sure you have switched (bottom right) to v5.0 in the documentation to see the recent updates.
| | Updated and Featured Functions | |
| |
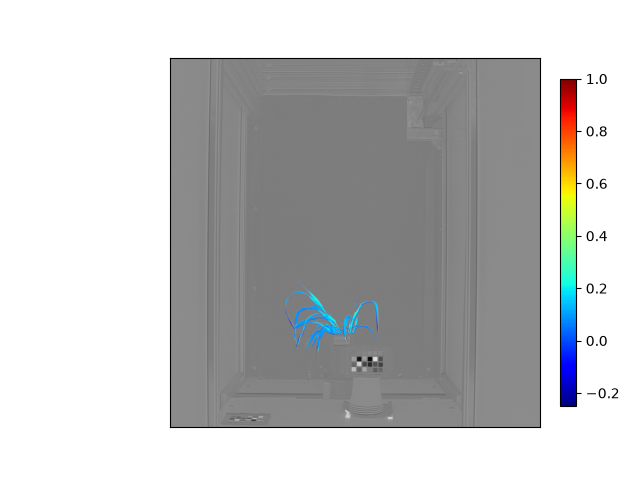
New functions allow you to calculate additional indices including: Green Normalized Difference Vegetation Index (GNDVI), Green Leaf Index (GLI), Soil Color Index (SCI), Blue Green Ratio (BGR), Blue Green Index (BGI). These new spectral indices give users another option for assessing vegetation health from RGB, multispectral, or hyperspectral imagery.
Contributors: Josh Sumner and Marcus Griffiths
| | |
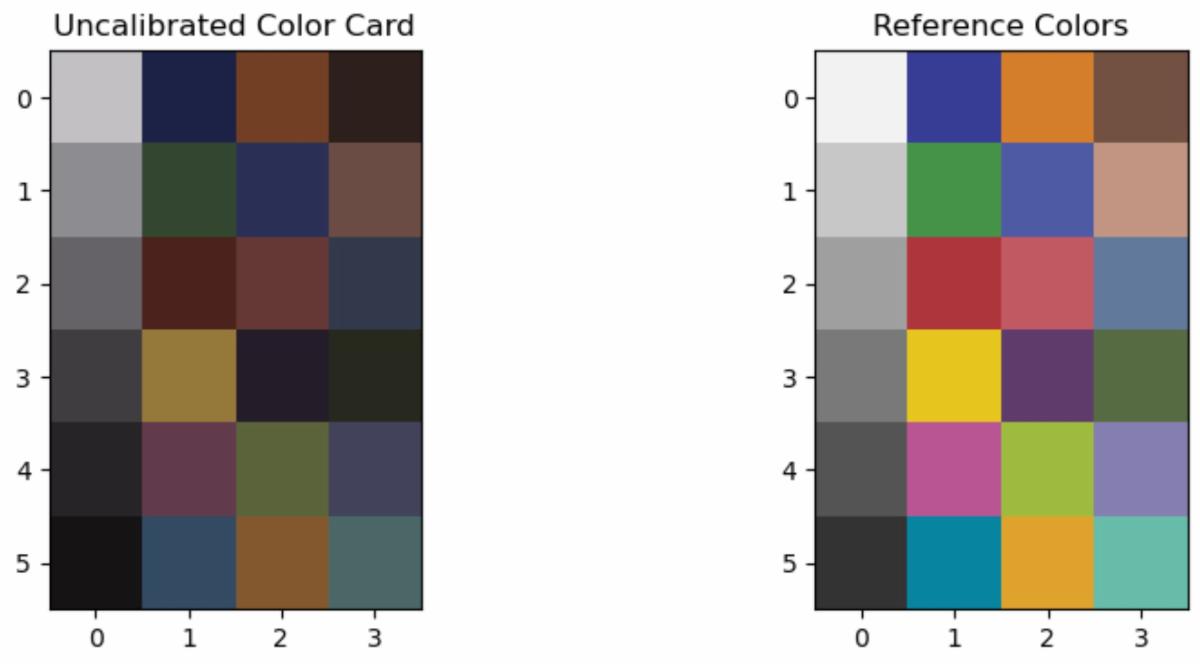
New tools quantify the color difference between a color chip and its reference value, with automatic recalculation after color correction and dataset-wide plotting. This gives a fast, quantitative check on how well color correction is performing.
Contributor: Josh Sumner
| | |
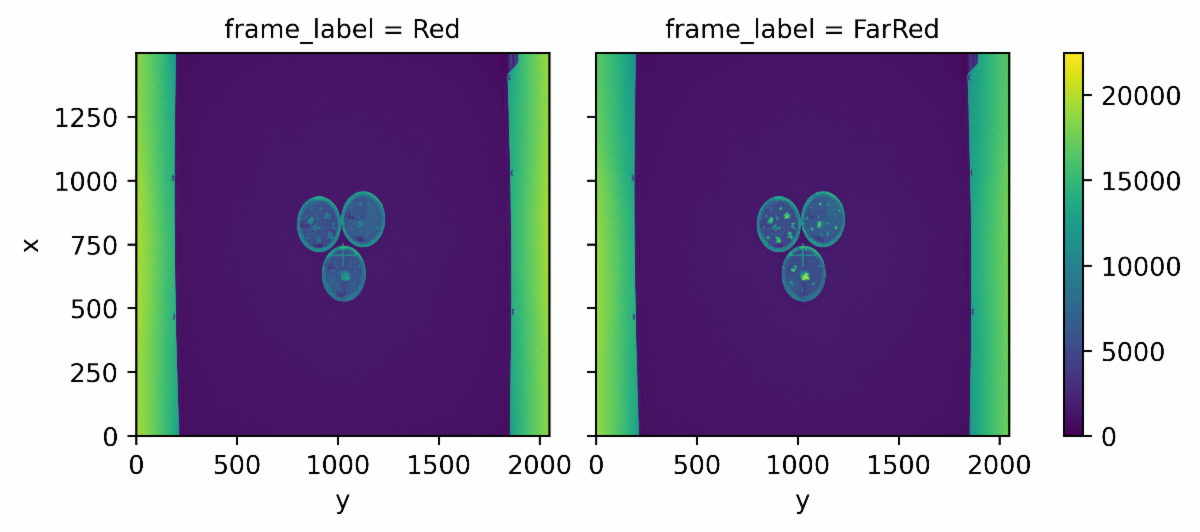
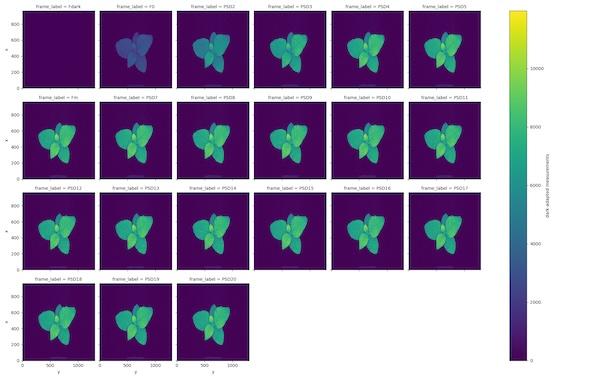
read_cropreporter now imports APH and PMT files directly, extending the NPQ and Fv/Fm import support. This is useful for specialized multispectral cameras, such as the Phenovation PlantExplorer MAX.
Contributor: Katie Murphy
| | |
Several modules (chlorophyll fluorescence, color, alpha, OJIP, NPQ, PSD/PSL, PMT, RFP/GFP, and more) now lazy-load their dependencies, which should meaningfully speed up import time, especially if your workflow only uses a subset of PlantCV.
Contributors: Noah Fahlgren and Josh Sumner
| | |
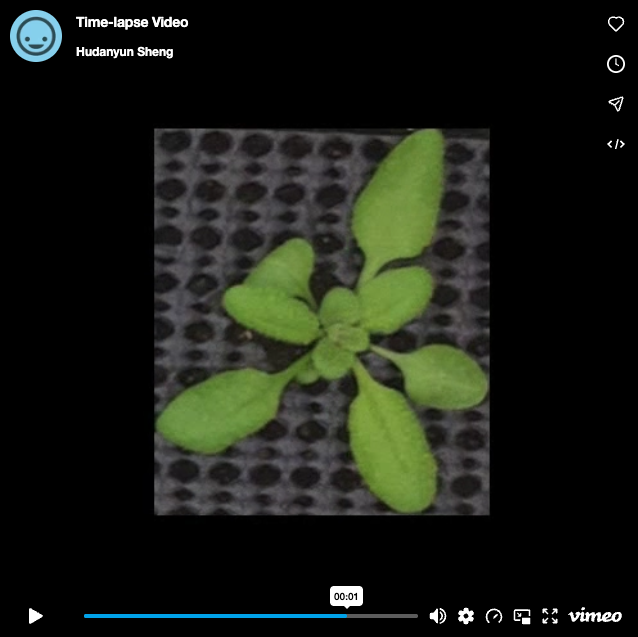
The time_lapse_video function is back, now with support for a list of image arrays as input.
Contributor: Noah Fahlgren
| | |
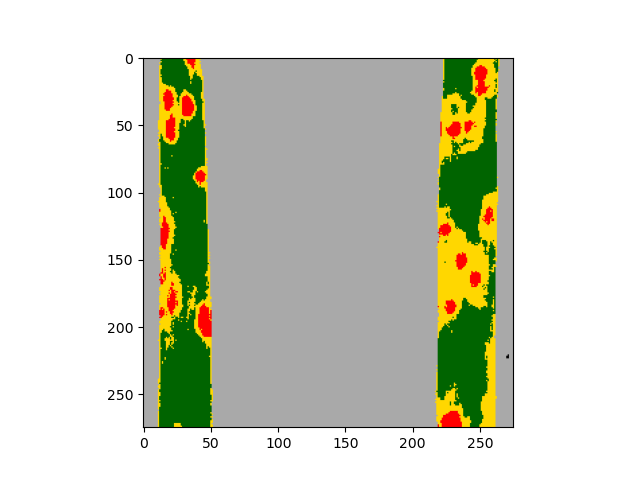
A new quality-control check for naive Bayes classification helps catch pixel misclassification earlier in the pipeline.
Contributor: Keely Brown
| | |
Enhancing spaceflight imaging data using Simple Online Automated Plant Phenomics (SOAPP).
Bauer L, Barker R, Cauthorn G, Jenkins B, Gilroy S. 2026. Enhancing spaceflight imaging data using Simple Online Automated Plant Phenomics (SOAPP). Gravitational and Space Research: Publication of the American Society for Gravitational and Space Research 14:106–118. DOI: 10.2478/gsr-2026-0008.
Summary: PlantCV in space! The authors built SOAPP, a web-based tool on top of PlantCV and OpenCV, to extract quantitative growth and color data from informal astronaut photography of plants aboard spacecraft. ArUco tags in the frame let the tool auto-correct for camera distance and angle, and it has already been used to characterize growth in hydroponic, potted, and petri-plate systems, aligning with NASA's push toward open, non-proprietary phenomics tools.
| |
Modeling phytomeric growth using high-throughput phenotyping deconvolutes genetic control of complex traits underlying size and water use in Setaria.
Dale R, Banan D, Oswald S, Millman B, Schuhl H, Leakey A, Fahlgren N, Mukherji S, Baxter I. 2026. Modeling phytomeric growth using high-throughput phenotyping deconvolutes genetic control of complex traits underlying size and water use in Setaria. bioRxiv. DOI: 10.1101/2023.12.28.573563.
Summary: The team built a seven-module “Phytomeric Growth Model” that tracks individual leaf segments over time, combining a PlantCV-based leaf-tracking pipeline with imaging of 1,138 Setaria plants under well-watered and drought conditions. The model uncovered 14 new QTL for phytomeric traits beyond what standard imaging analysis detects, and showed that tillering rate and marginal water-use efficiency are especially influential in drought response.
Want to share a publication in the newsletter? Email plantcv@danforthcenter.org.
|
|
Learner Spotlight
Thank you to those who visited the Danforth Center in September for our PlantCV Workshop, funded by NSF POSE (award 2346101)! Participants learned basic PlantCV functions, as well as our new add-on package, PlantCV-Geospatial.
| | | | |
Upcoming Events
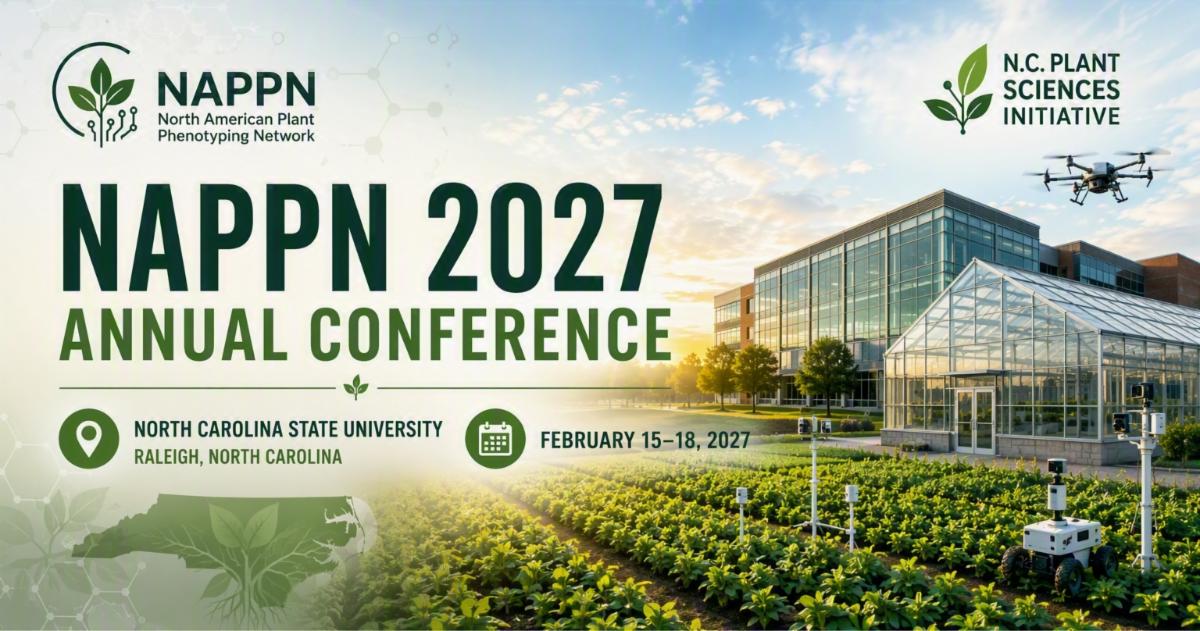
We will be at the North American Plant Phenotyping Network Annual Meeting, February 15 – 18, 2027 in North Carolina! See details here, abstracts are due Oct. 5, 2026 to be considered for a talk. Stay tuned for workshop details.
| | |
How to get started and get involved:
| |
Looking for examples?
Check out the tutorial gallery!
The best way to learn PlantCV is to walk through our tutorials, and adapt
them to work with your own images.
| | | | |