|
Like any good school year, this series went by fast. But as class comes to an end, there's one theme that's been top of mind here at The Lead: “noise.” Looking back on how this year unfolded, it's never been more important for investors, institutional and high net worth alike, to cut through it and focus on the facts and fundamentals.
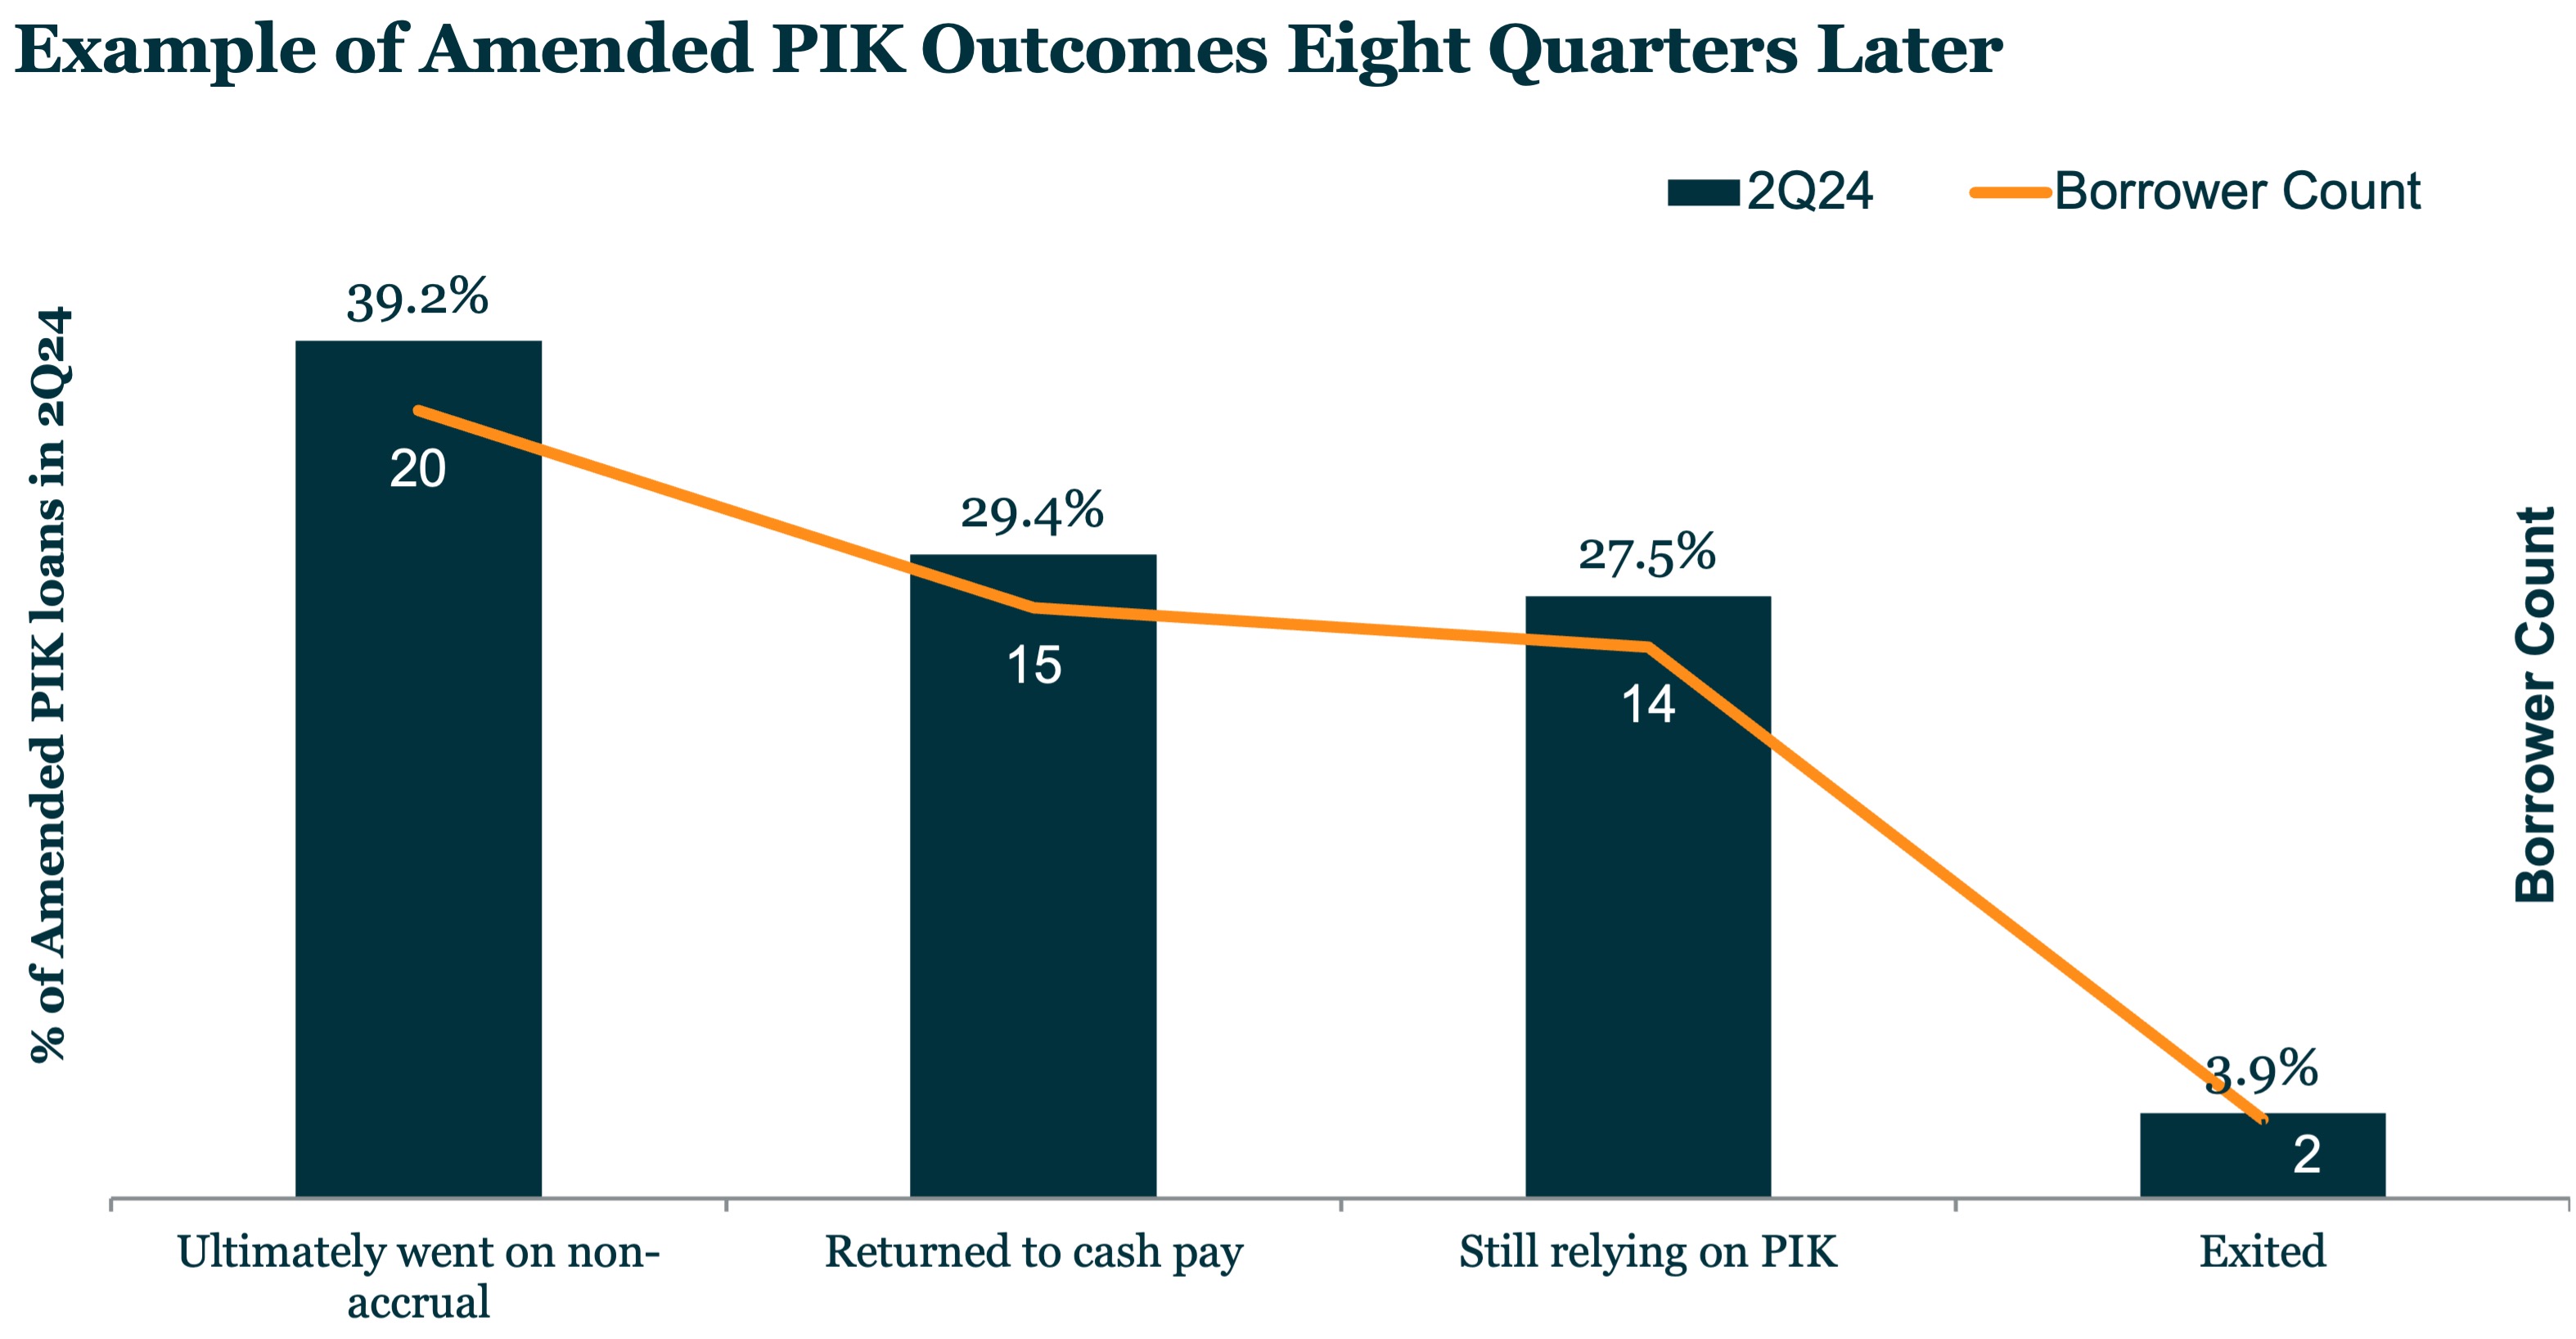
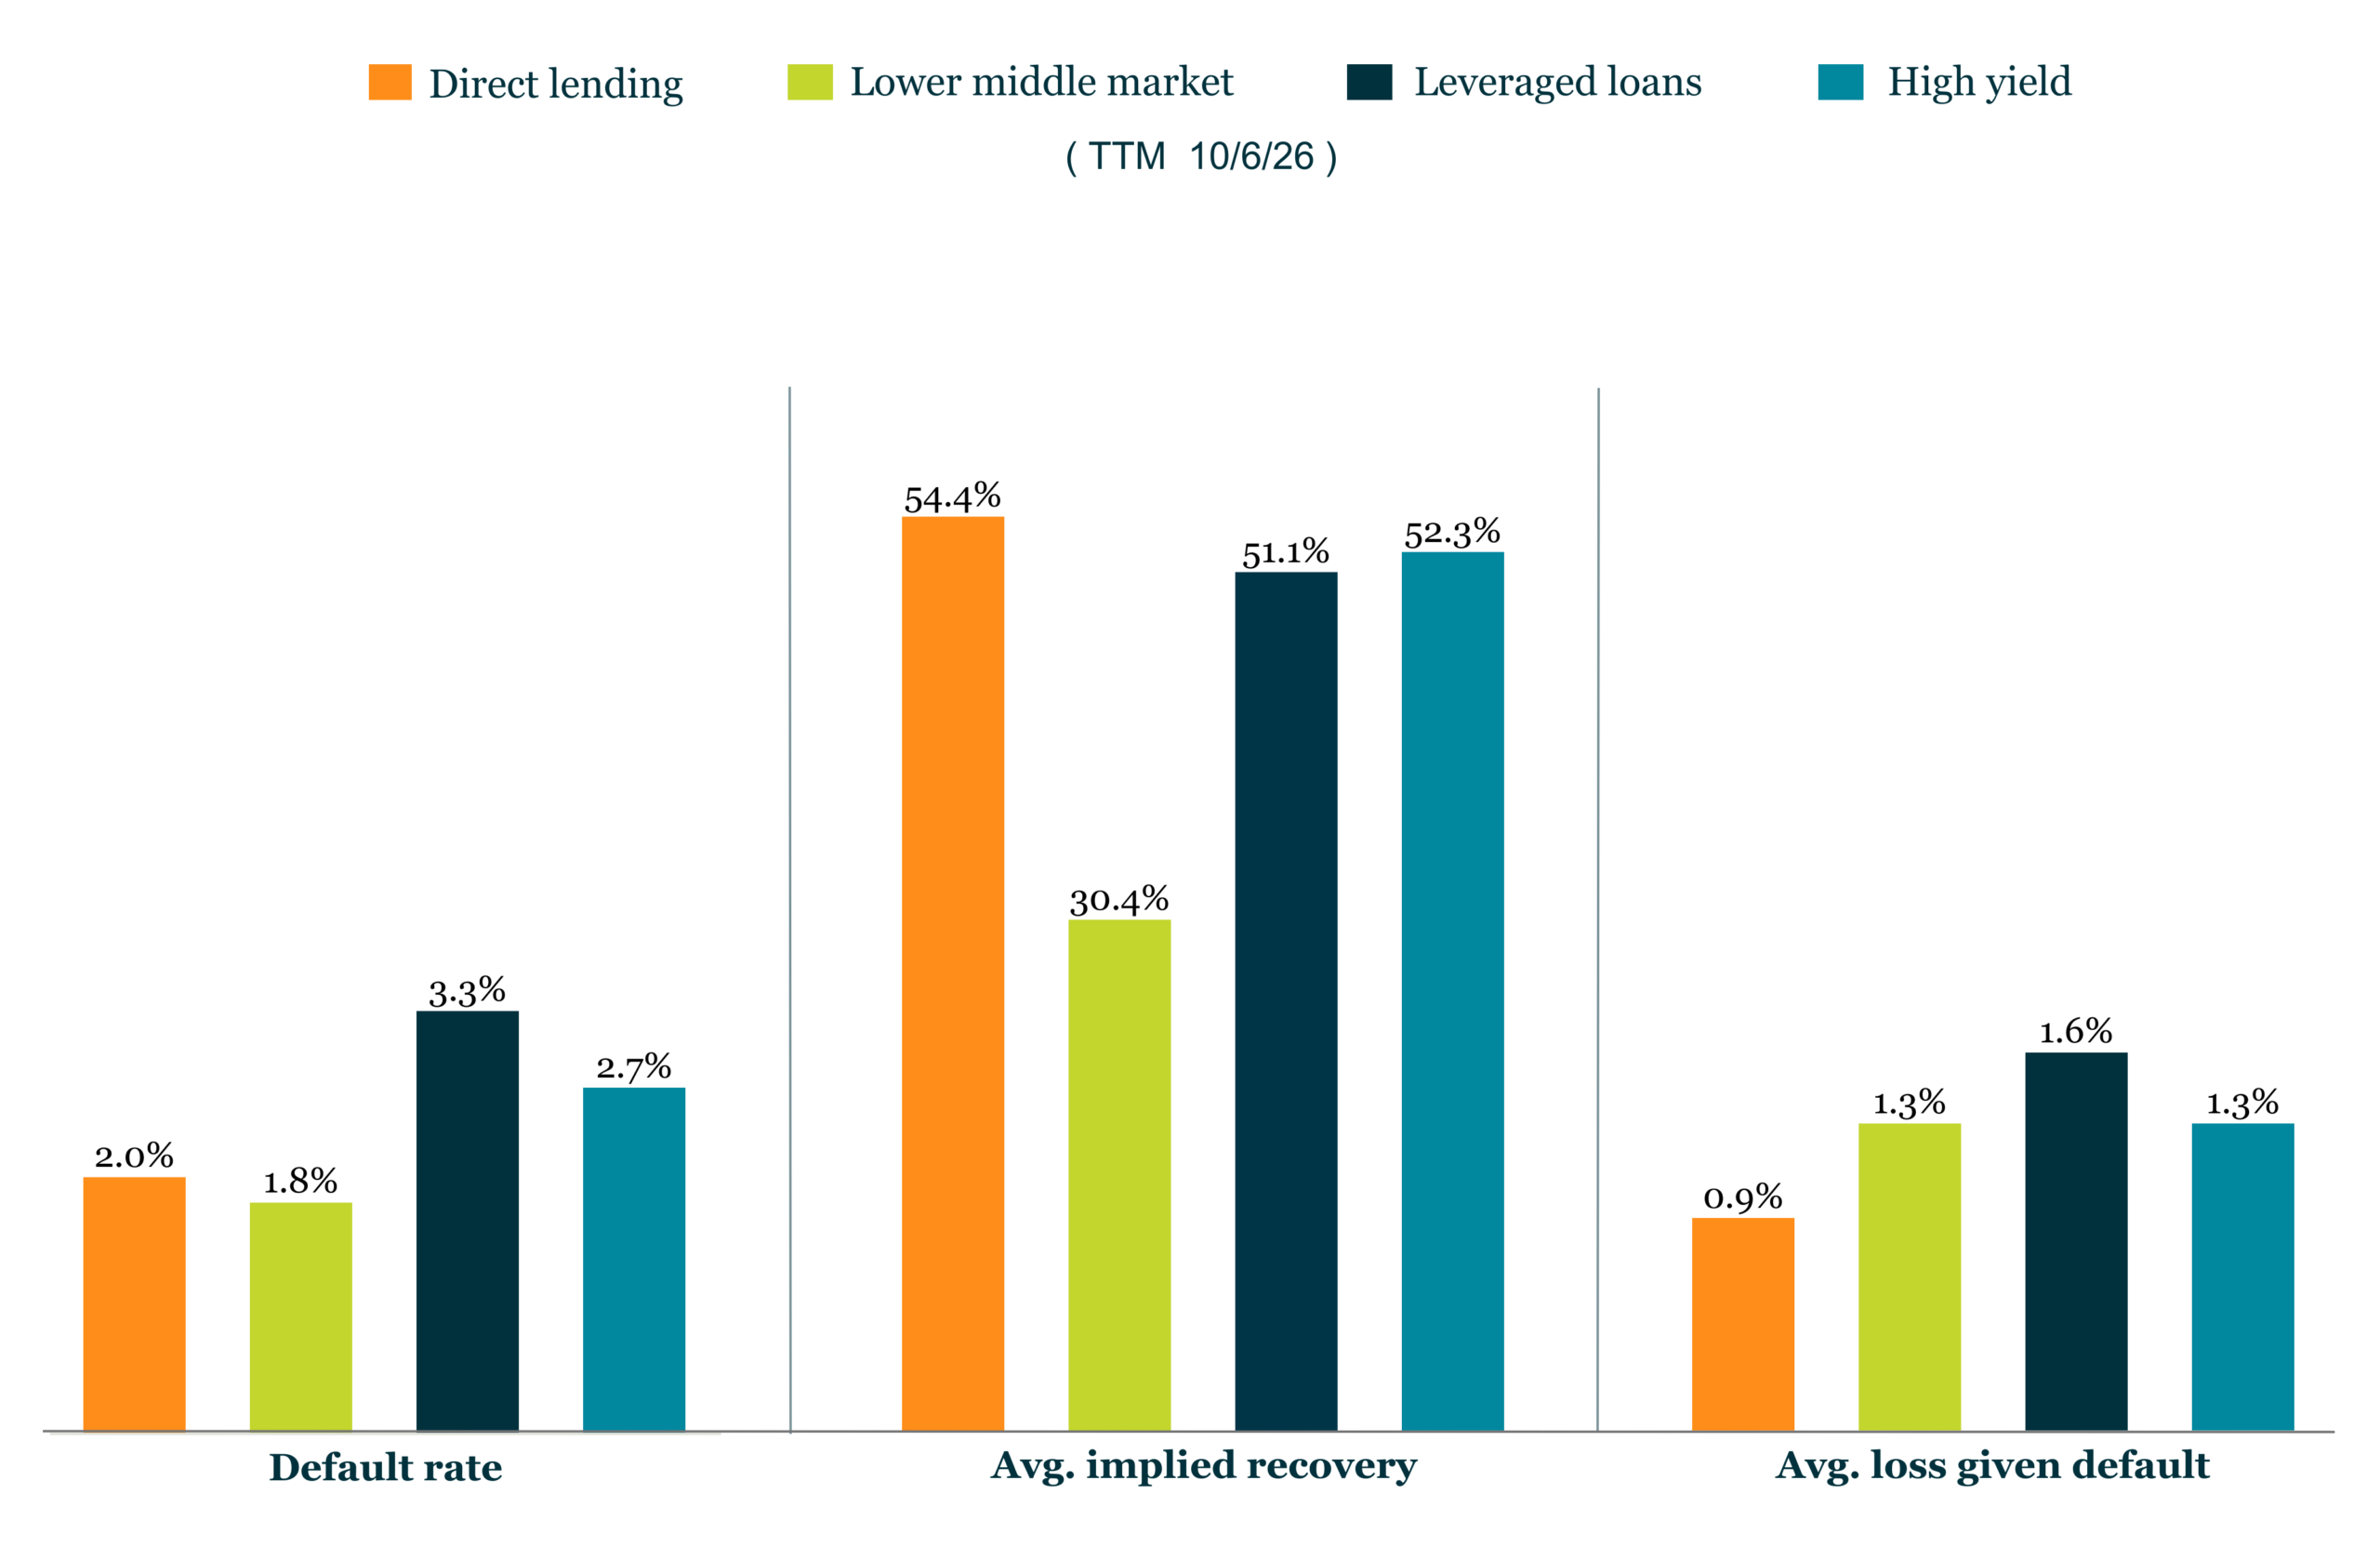
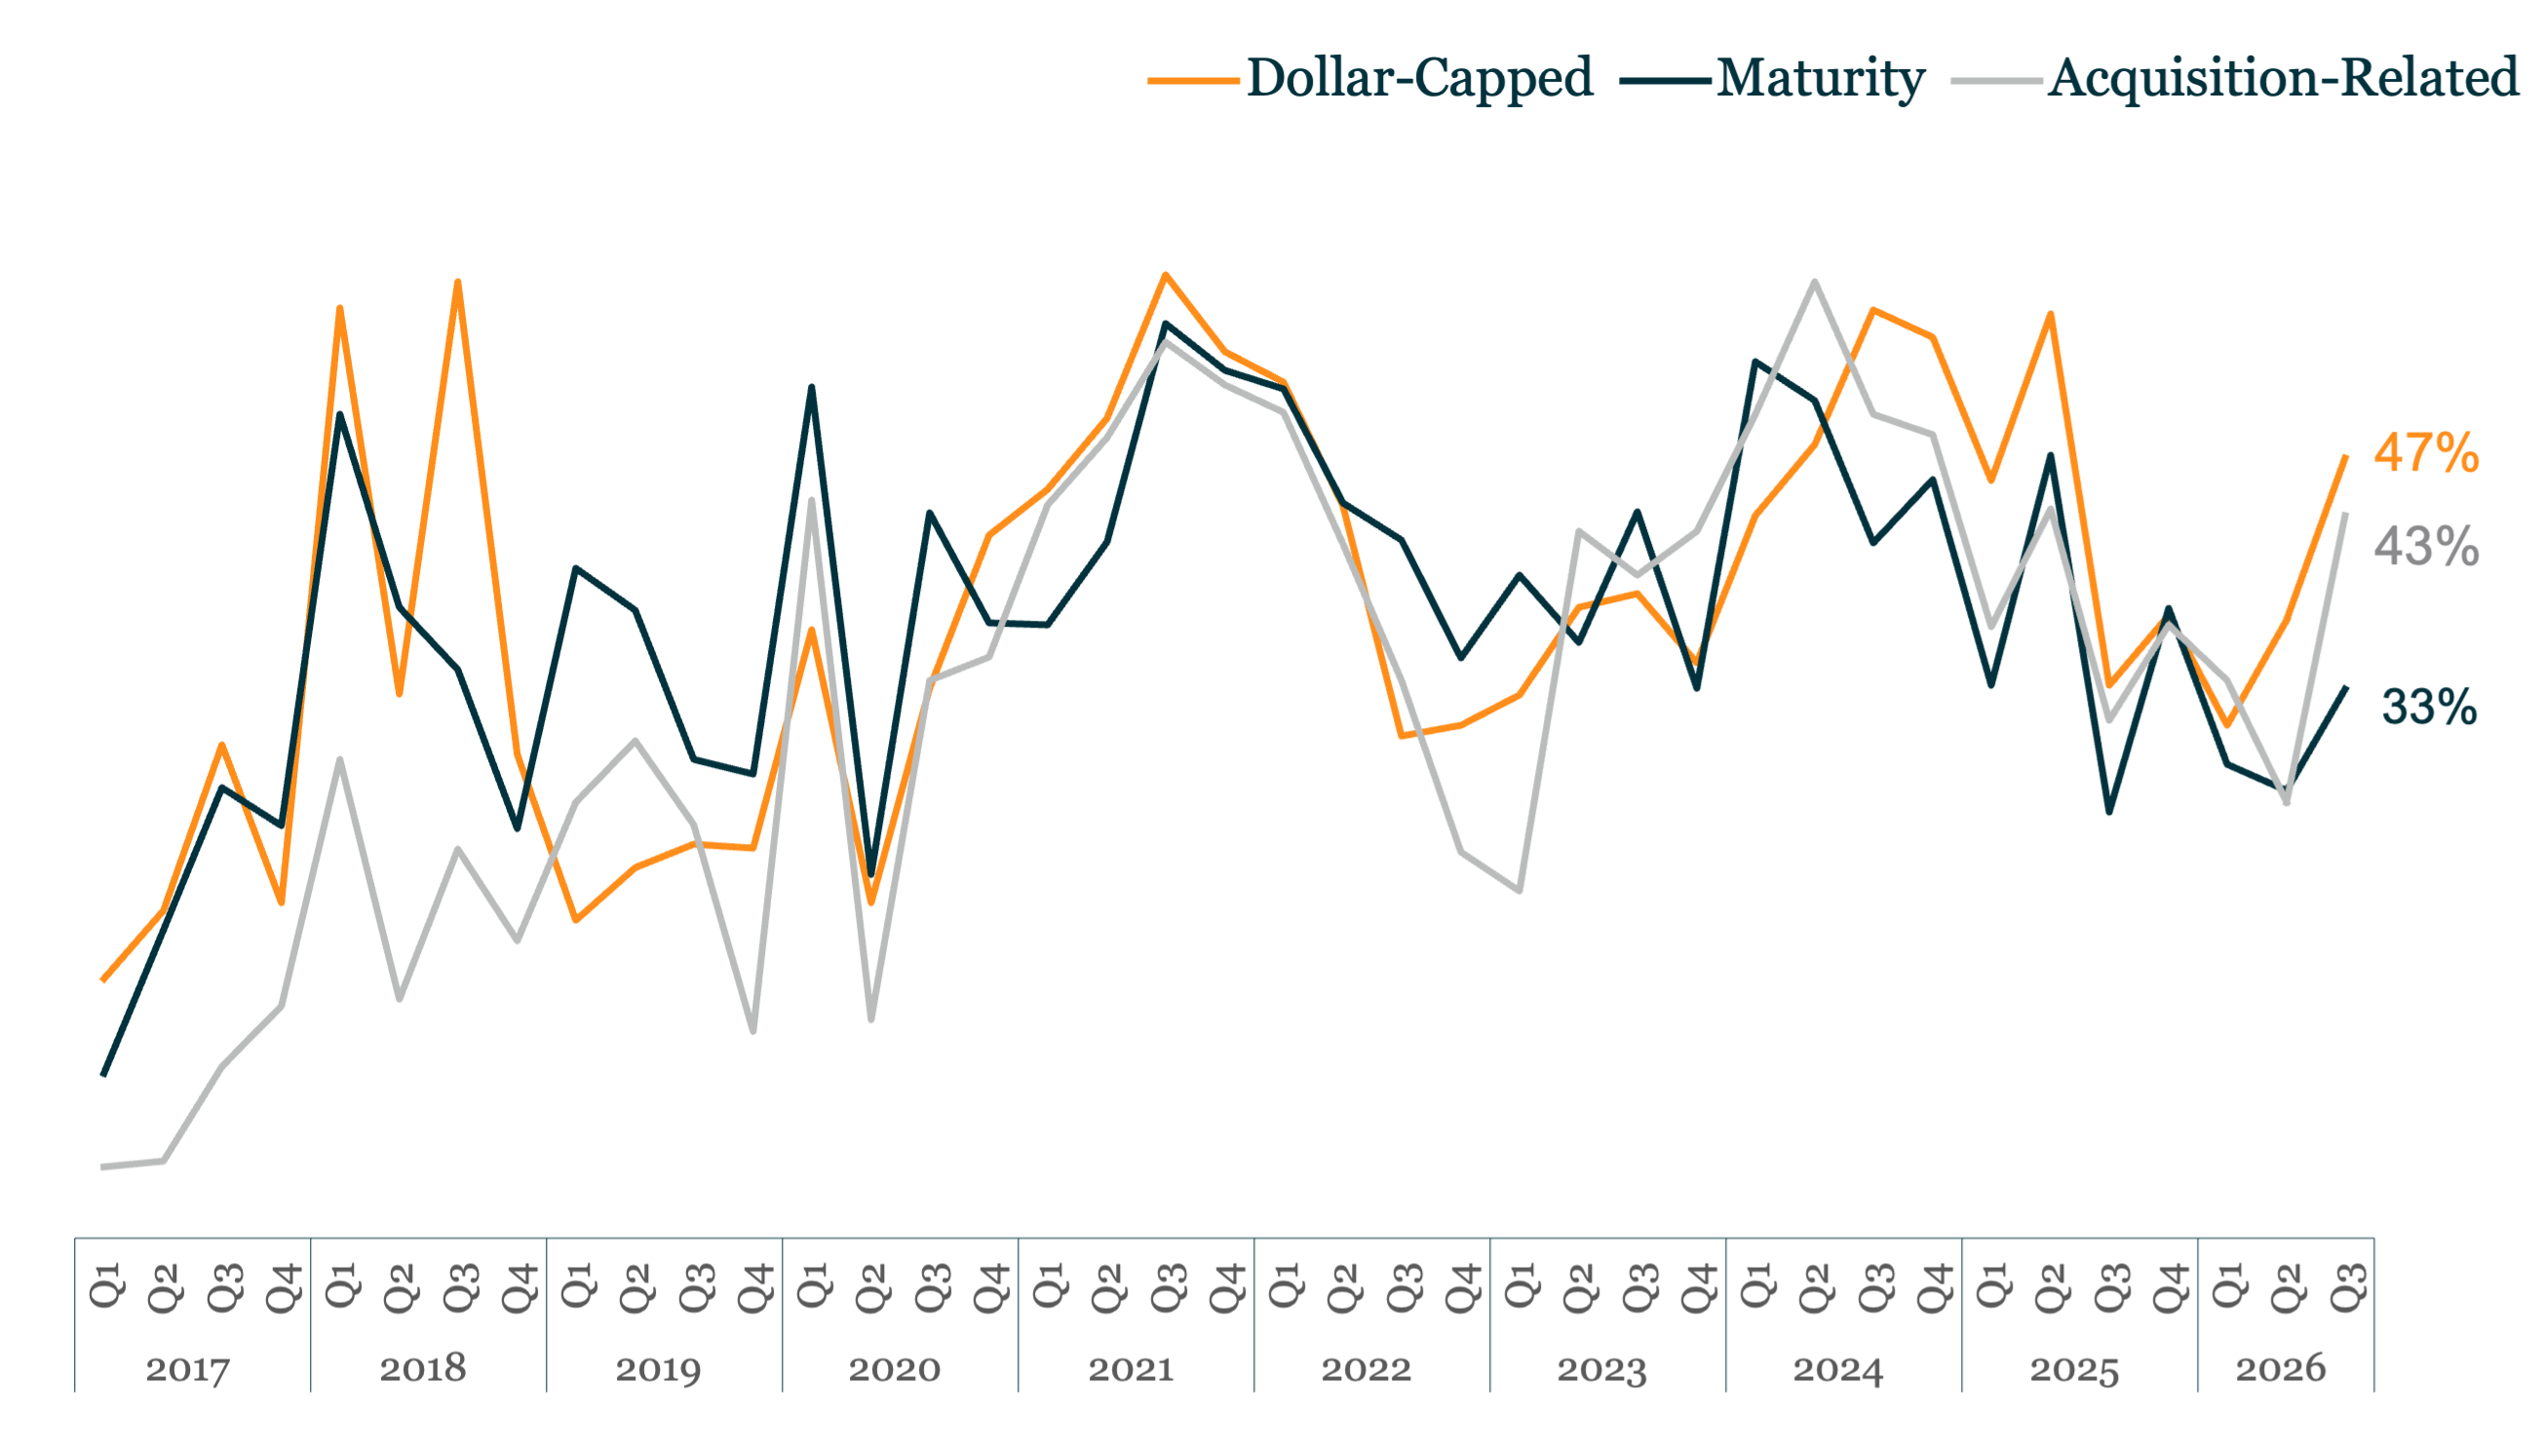
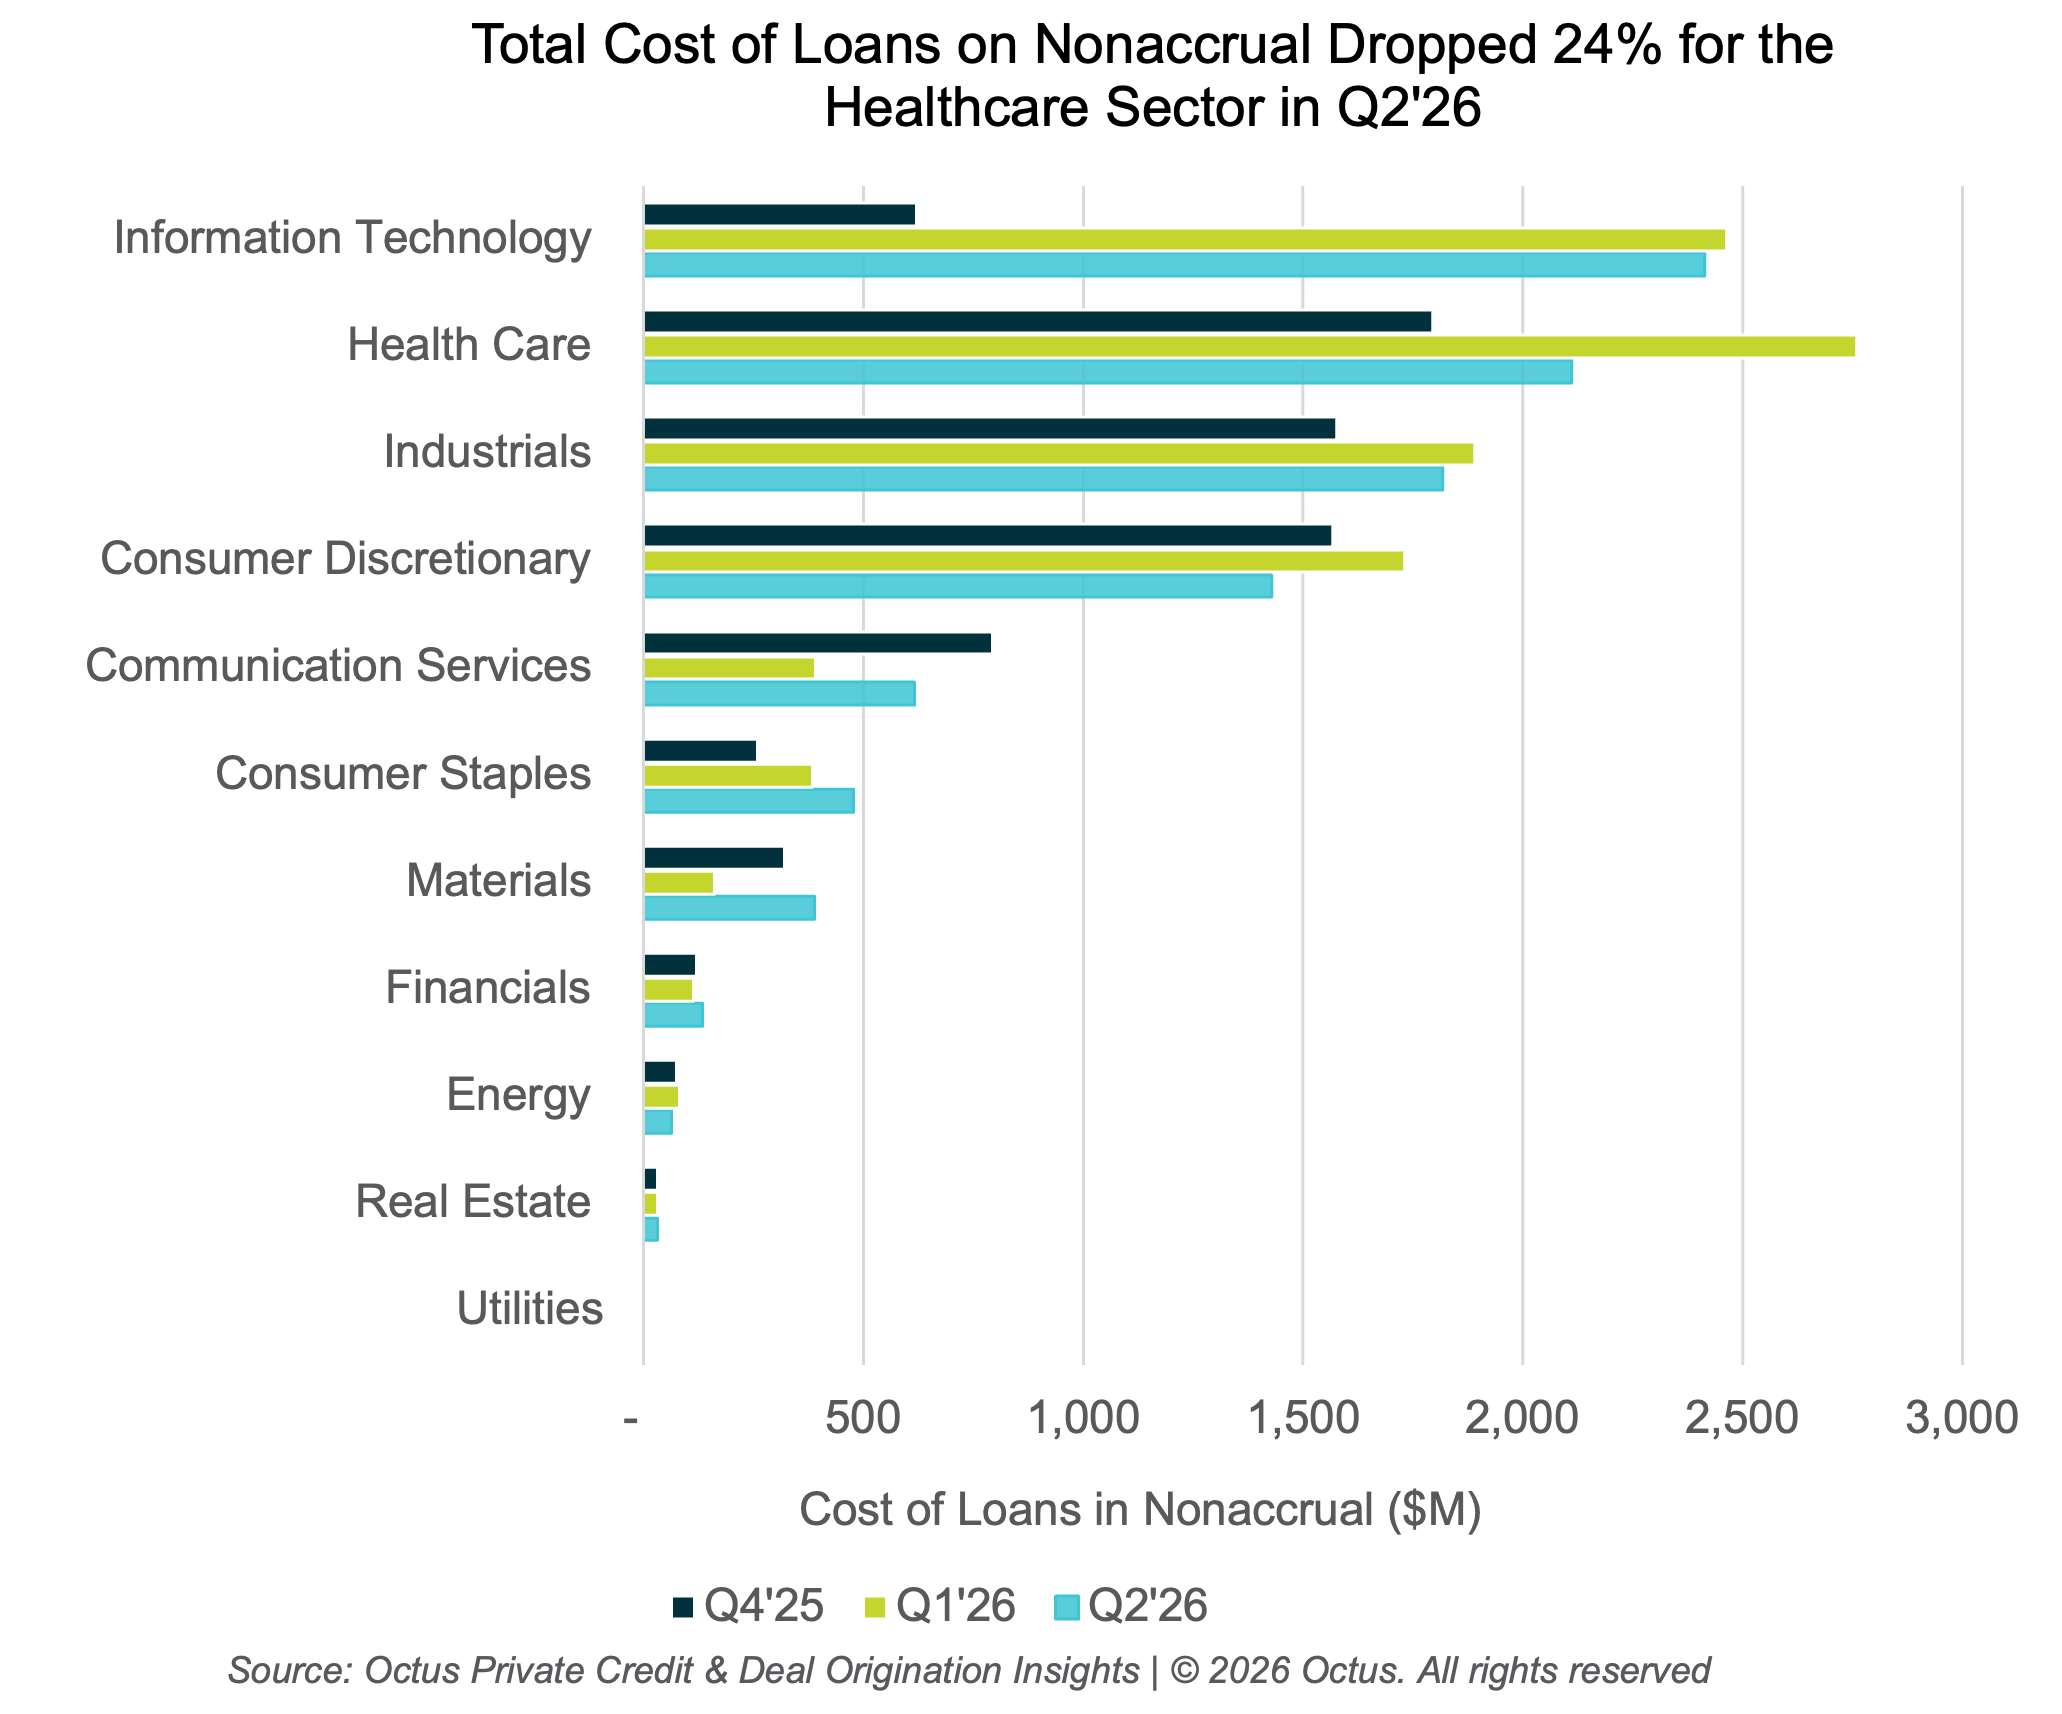
Our goal with this series was to give you the tools to separate signal from noise, especially against headlines like Private Credit Defaults Are 1%, 6% or 19%, Depending Who You Ask - Bloomberg. As we've covered throughout the series, including in Different Numbers, Different Stories, and in conversations with experts on our webinar, you don't need to know the exact details. You just need a general understanding of what's driving these numbers. For example, at the low-end of the range, that's generally going to reflect “harder” measures of defaults such as missed payments, bankruptcies and distressed restructurings. Conversely, a higher rate is more likely to include items like maturity extensions, amended PIK, non-accruals and covenant trips. These measures can be a sign of stress, but that is not always the case. In fact, a recent Cliffwater research note puts some context around this. Of the PIK loans tracked, 40% eventually moved to non-accrual, but 30% returned to cash pay (see Chart of the Week). That's exactly why these figures are worth reading alongside other measures, rather than in isolation...
|