LinkedIn  YouTube
1737323452-scaled-e1789669613276 image

SHARE YOUR PERSPECTIVE

2026 Private Credit Investor Survey


Institutional investors, RIAs and financial advisors - we want to hear from you. Take this two-minute anonymous survey and receive the results report. 

Home | Content hub | Private capital unlocked | Week of September 28 2026

Private Credit Defaults 101: Now Streaming

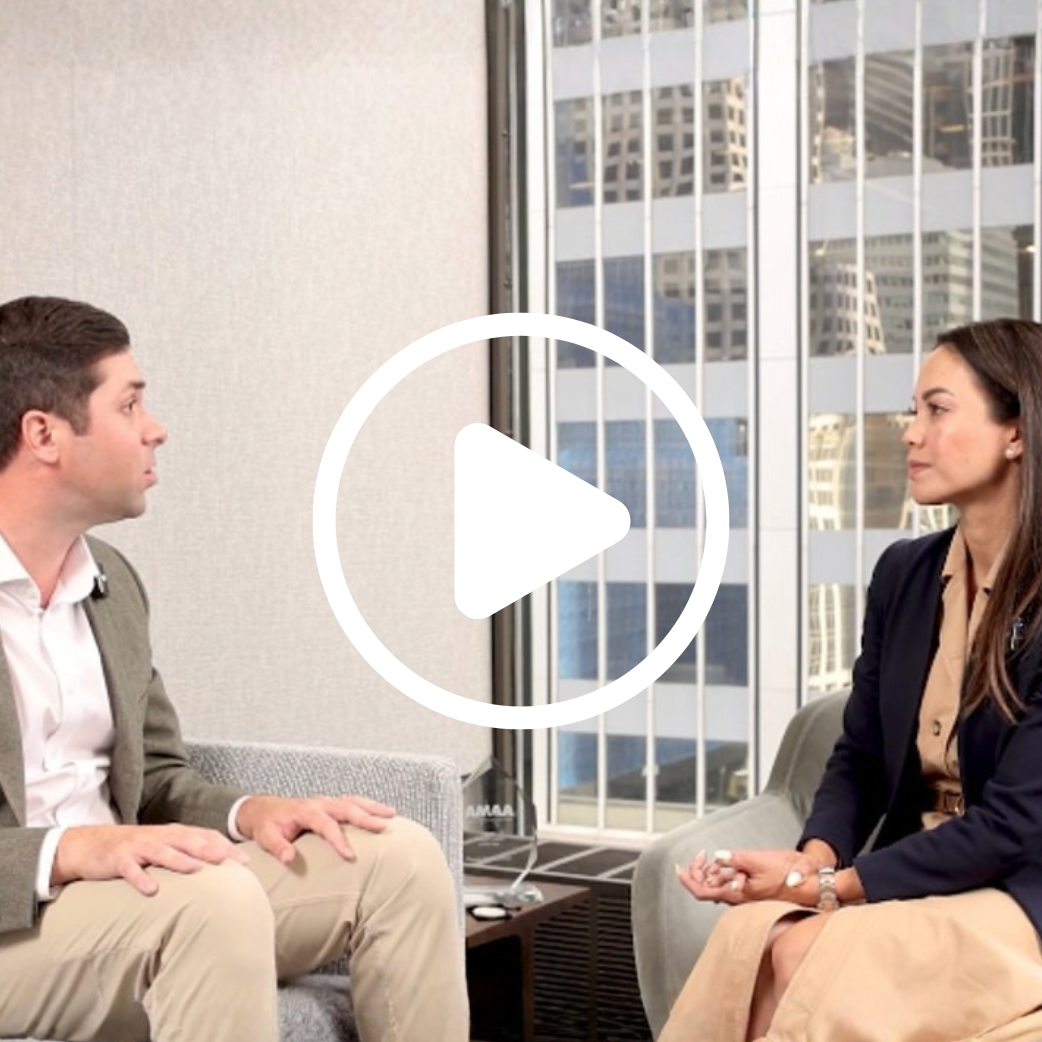
Every big theatrical release eventually makes its way to streaming. It gives people who missed it in theaters a chance to catch up. And for those who already saw it, a second look at the details they missed the first time. The Lead Presents: Making Sense of Private Credit Defaults had its own debut the other week, drawing more than 700 registrants for a conversation with all four major rating agencies on how they calculate and measure defaults. With the replay now live, we wanted to walk through a recap of our conversation. Here are the key scenes worth revisiting.


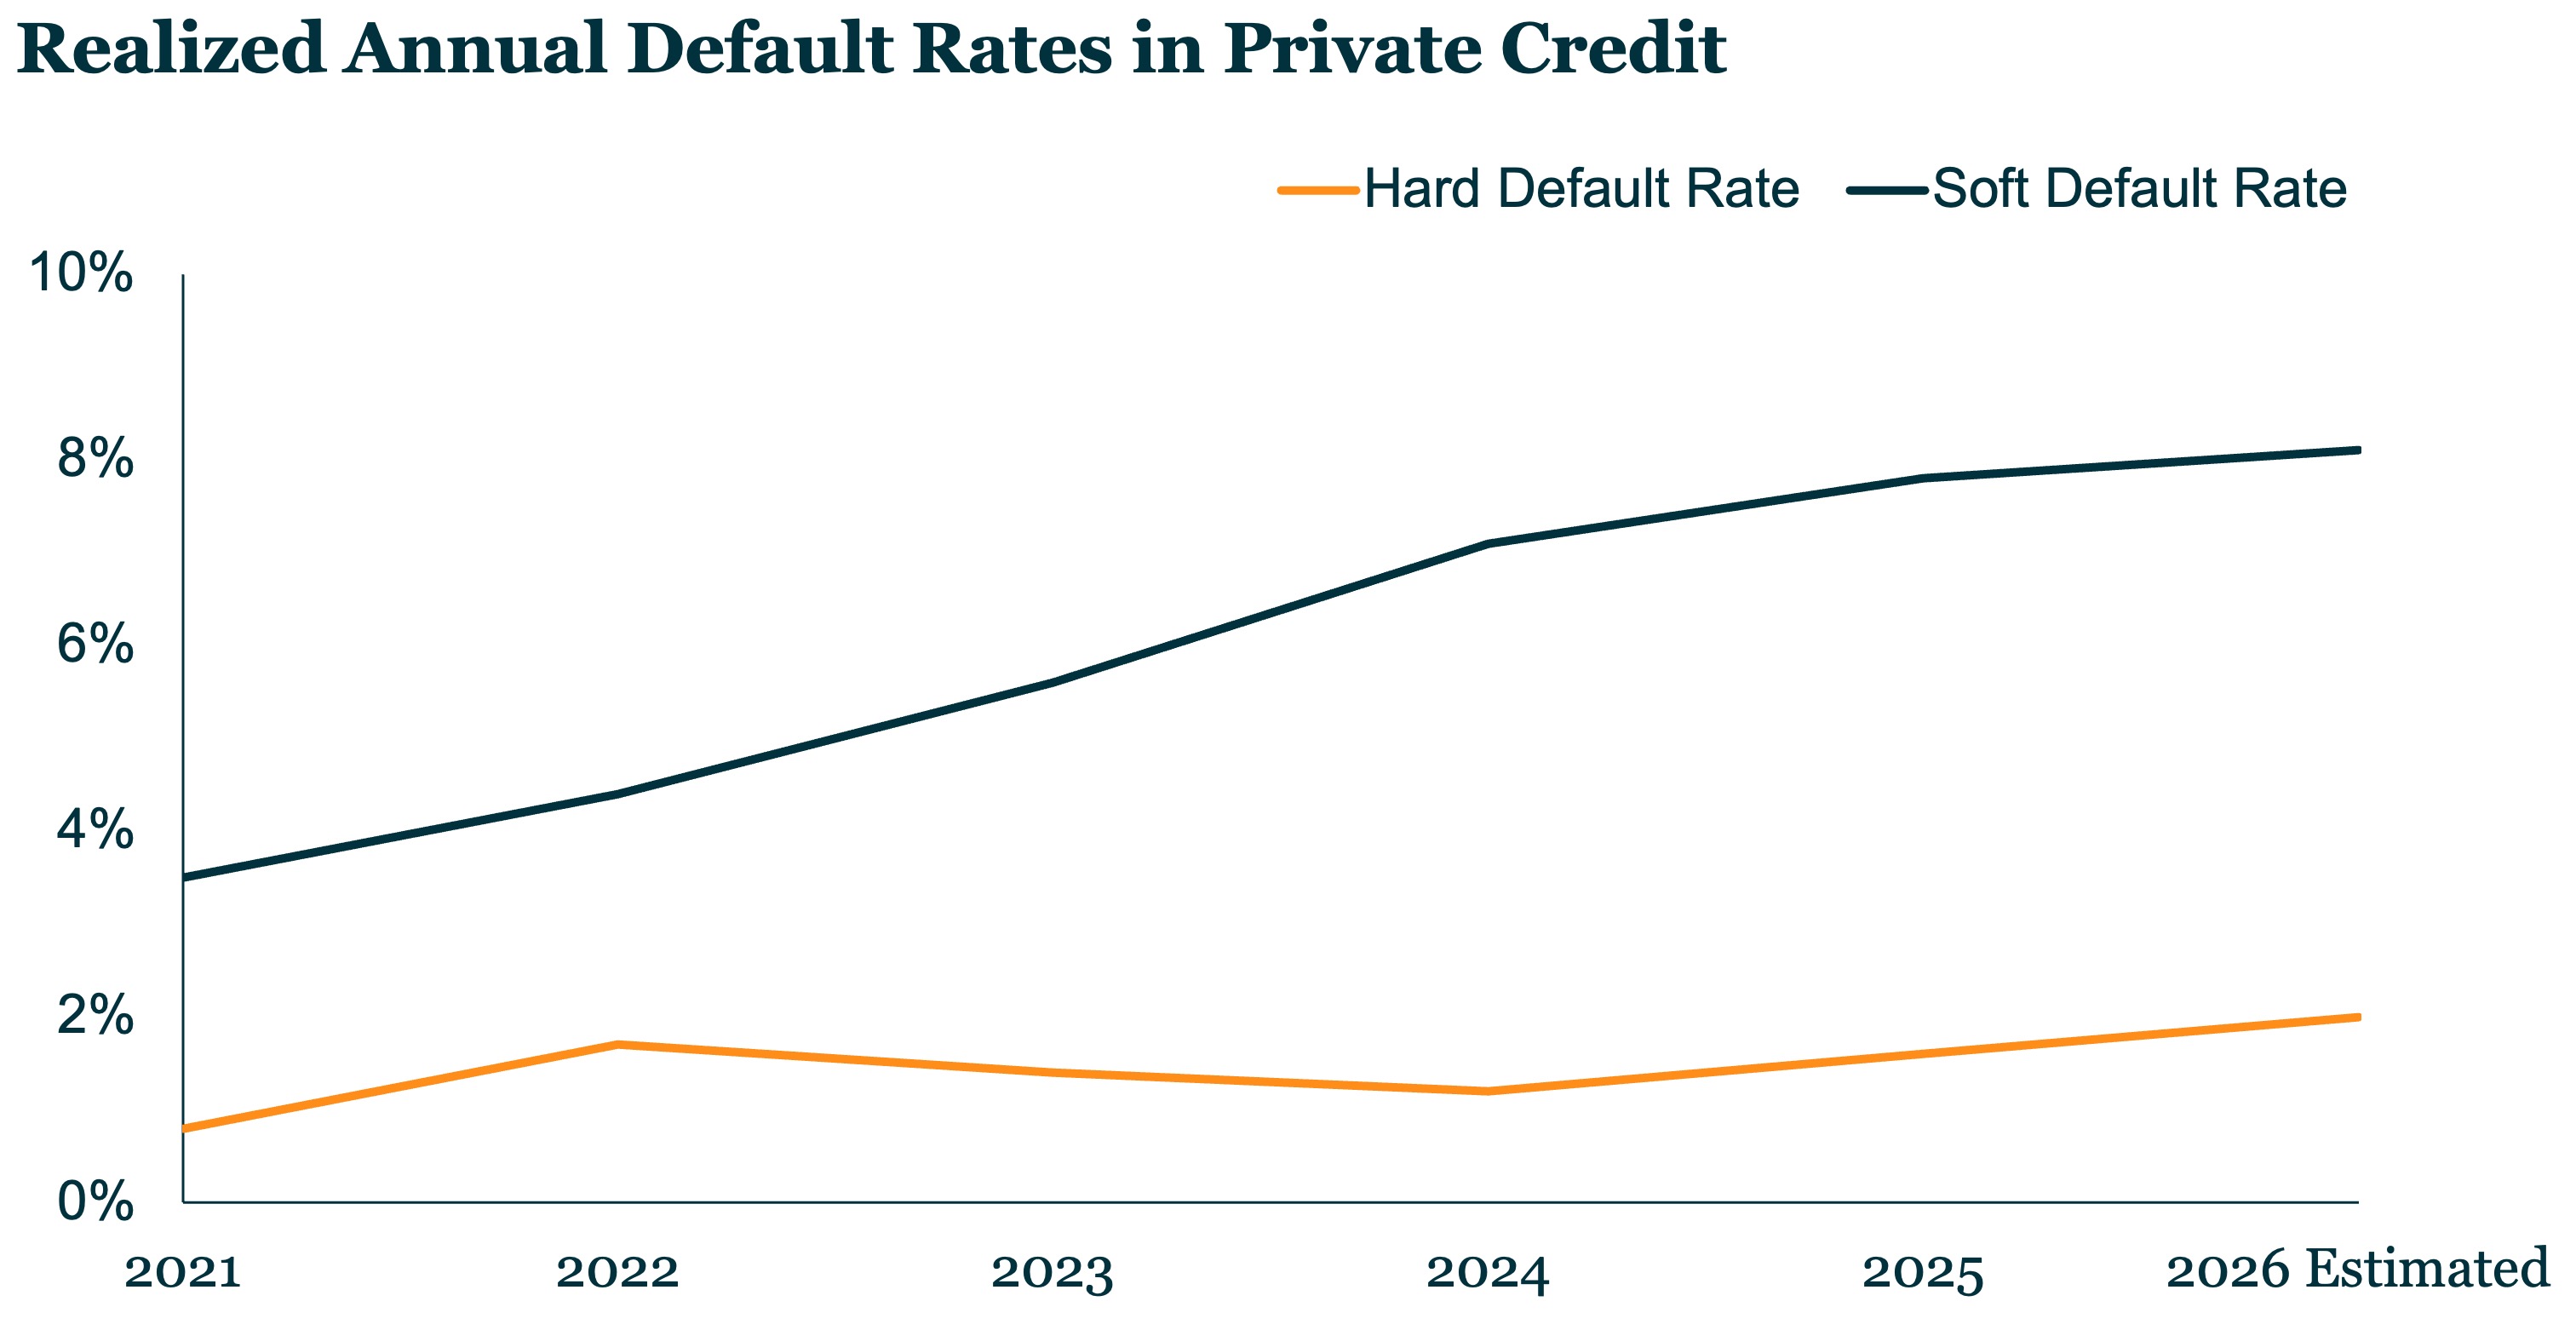
The session picked up right where Different Numbers, Different Stories left off. The reason default rates range so widely is that everyone's measuring something slightly different. One firm may focus on missed payments. Another might include distressed exchanges like maturity extensions and PIK amendments. The universe itself can differ in composition, whether in size, how it's weighted (by issuer or by volume), or whether it includes loans further down the capital stack rather than those most senior. As one panelist framed it, these differences don't mean one rate is more right than another. They each serve a purpose, because it's a non-homogeneous market...

088EEF3B-0DD1-4122-8FC5-96F07D176BA0_1_201_a-e1790689585276 image
video-0928-1 image

Non-accruals in focus


Rising non-accruals: normalization or warning sign? We dig into the data


Chart of the week

Behind the Scenes

The title doesn’t always tell you what’s driving the plot.


CTW-0928 image

Source: Moody’s Analytics

EP-28 image

Private Capital Call podcast 


Credit discipline through the cycle - Lessons from a pension fund

Quote of the week

“
The promise of private credit isn't the ability to avoid every problem. It's being in a better position to recover when those problems happen.” 


– Michael Patterson,

HPS (Semafor)

PEIPC-TL-logo image

PEI Private Credit


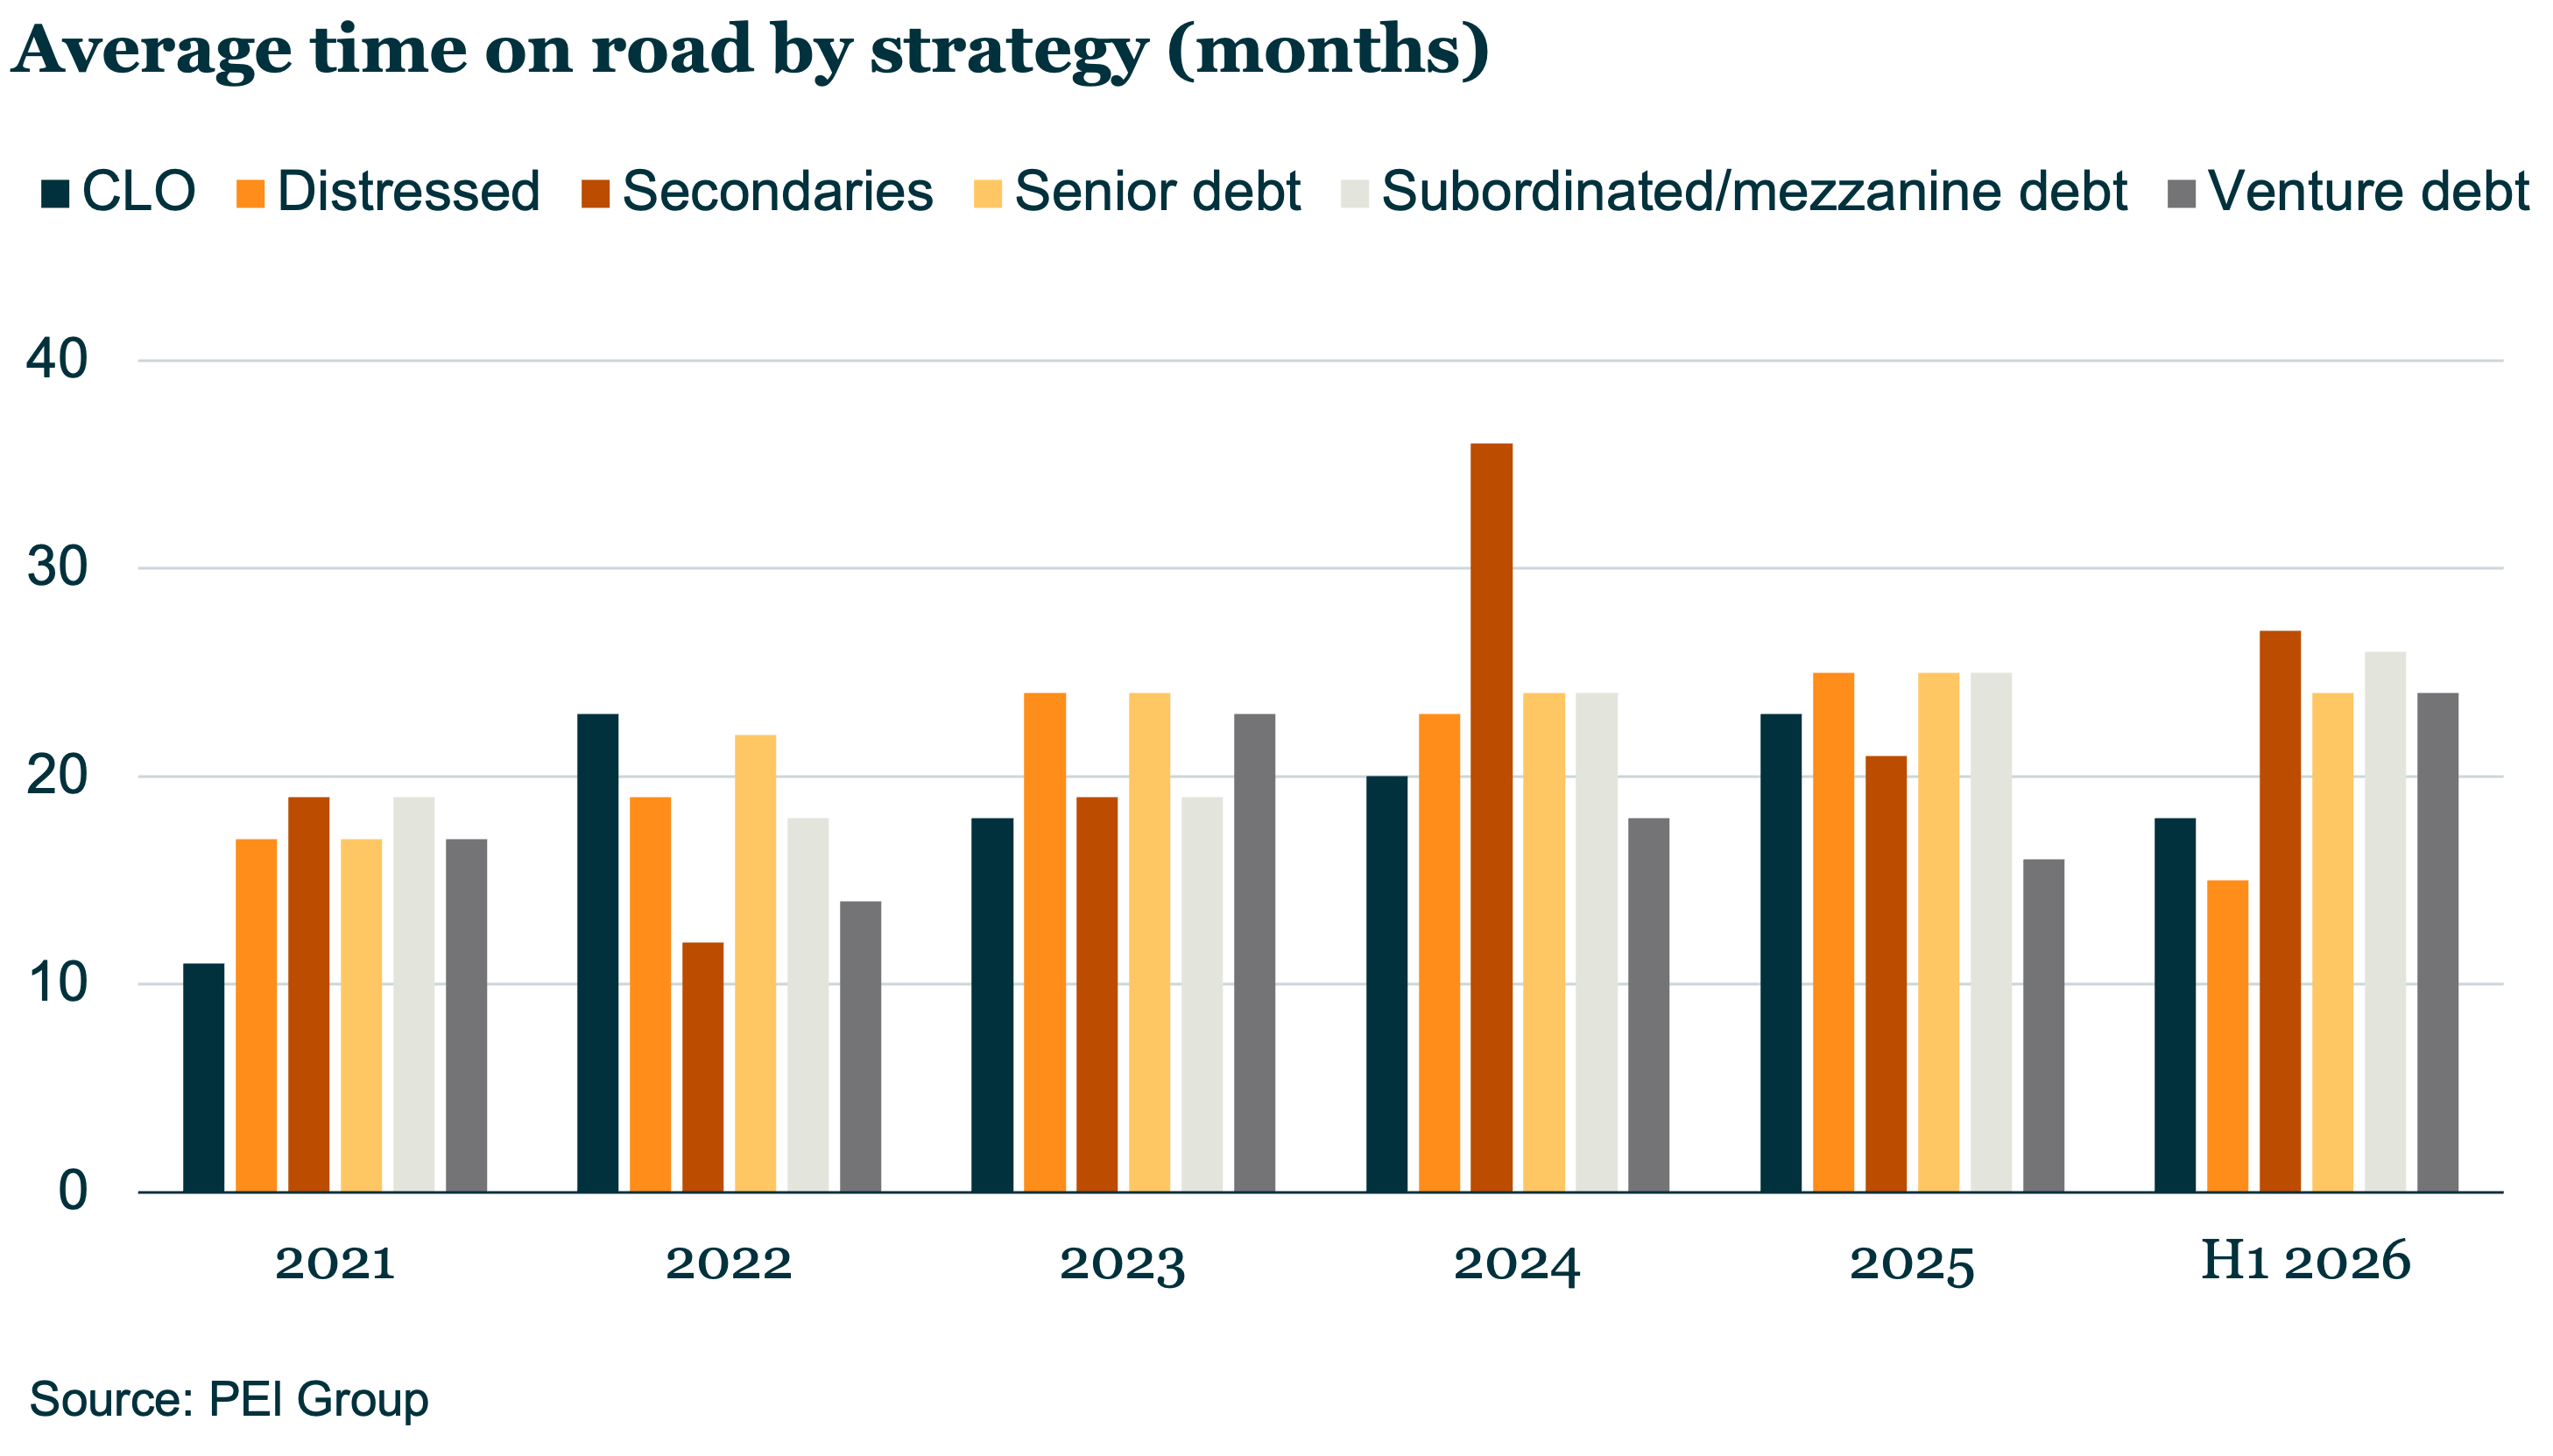
Time on the road increasing since 2021


PDI-0928 image

The average time spend fundraising for private credit fund strategies has generally risen during the 2020s.


The average time taken to raise private credit funds has been increasing since 2021, though there are significant differences between strategies, according to PEI Group data...


Contact: Andy Thomson

LSEG-logo-TL image

Leveraged Loan Insight & Analysis


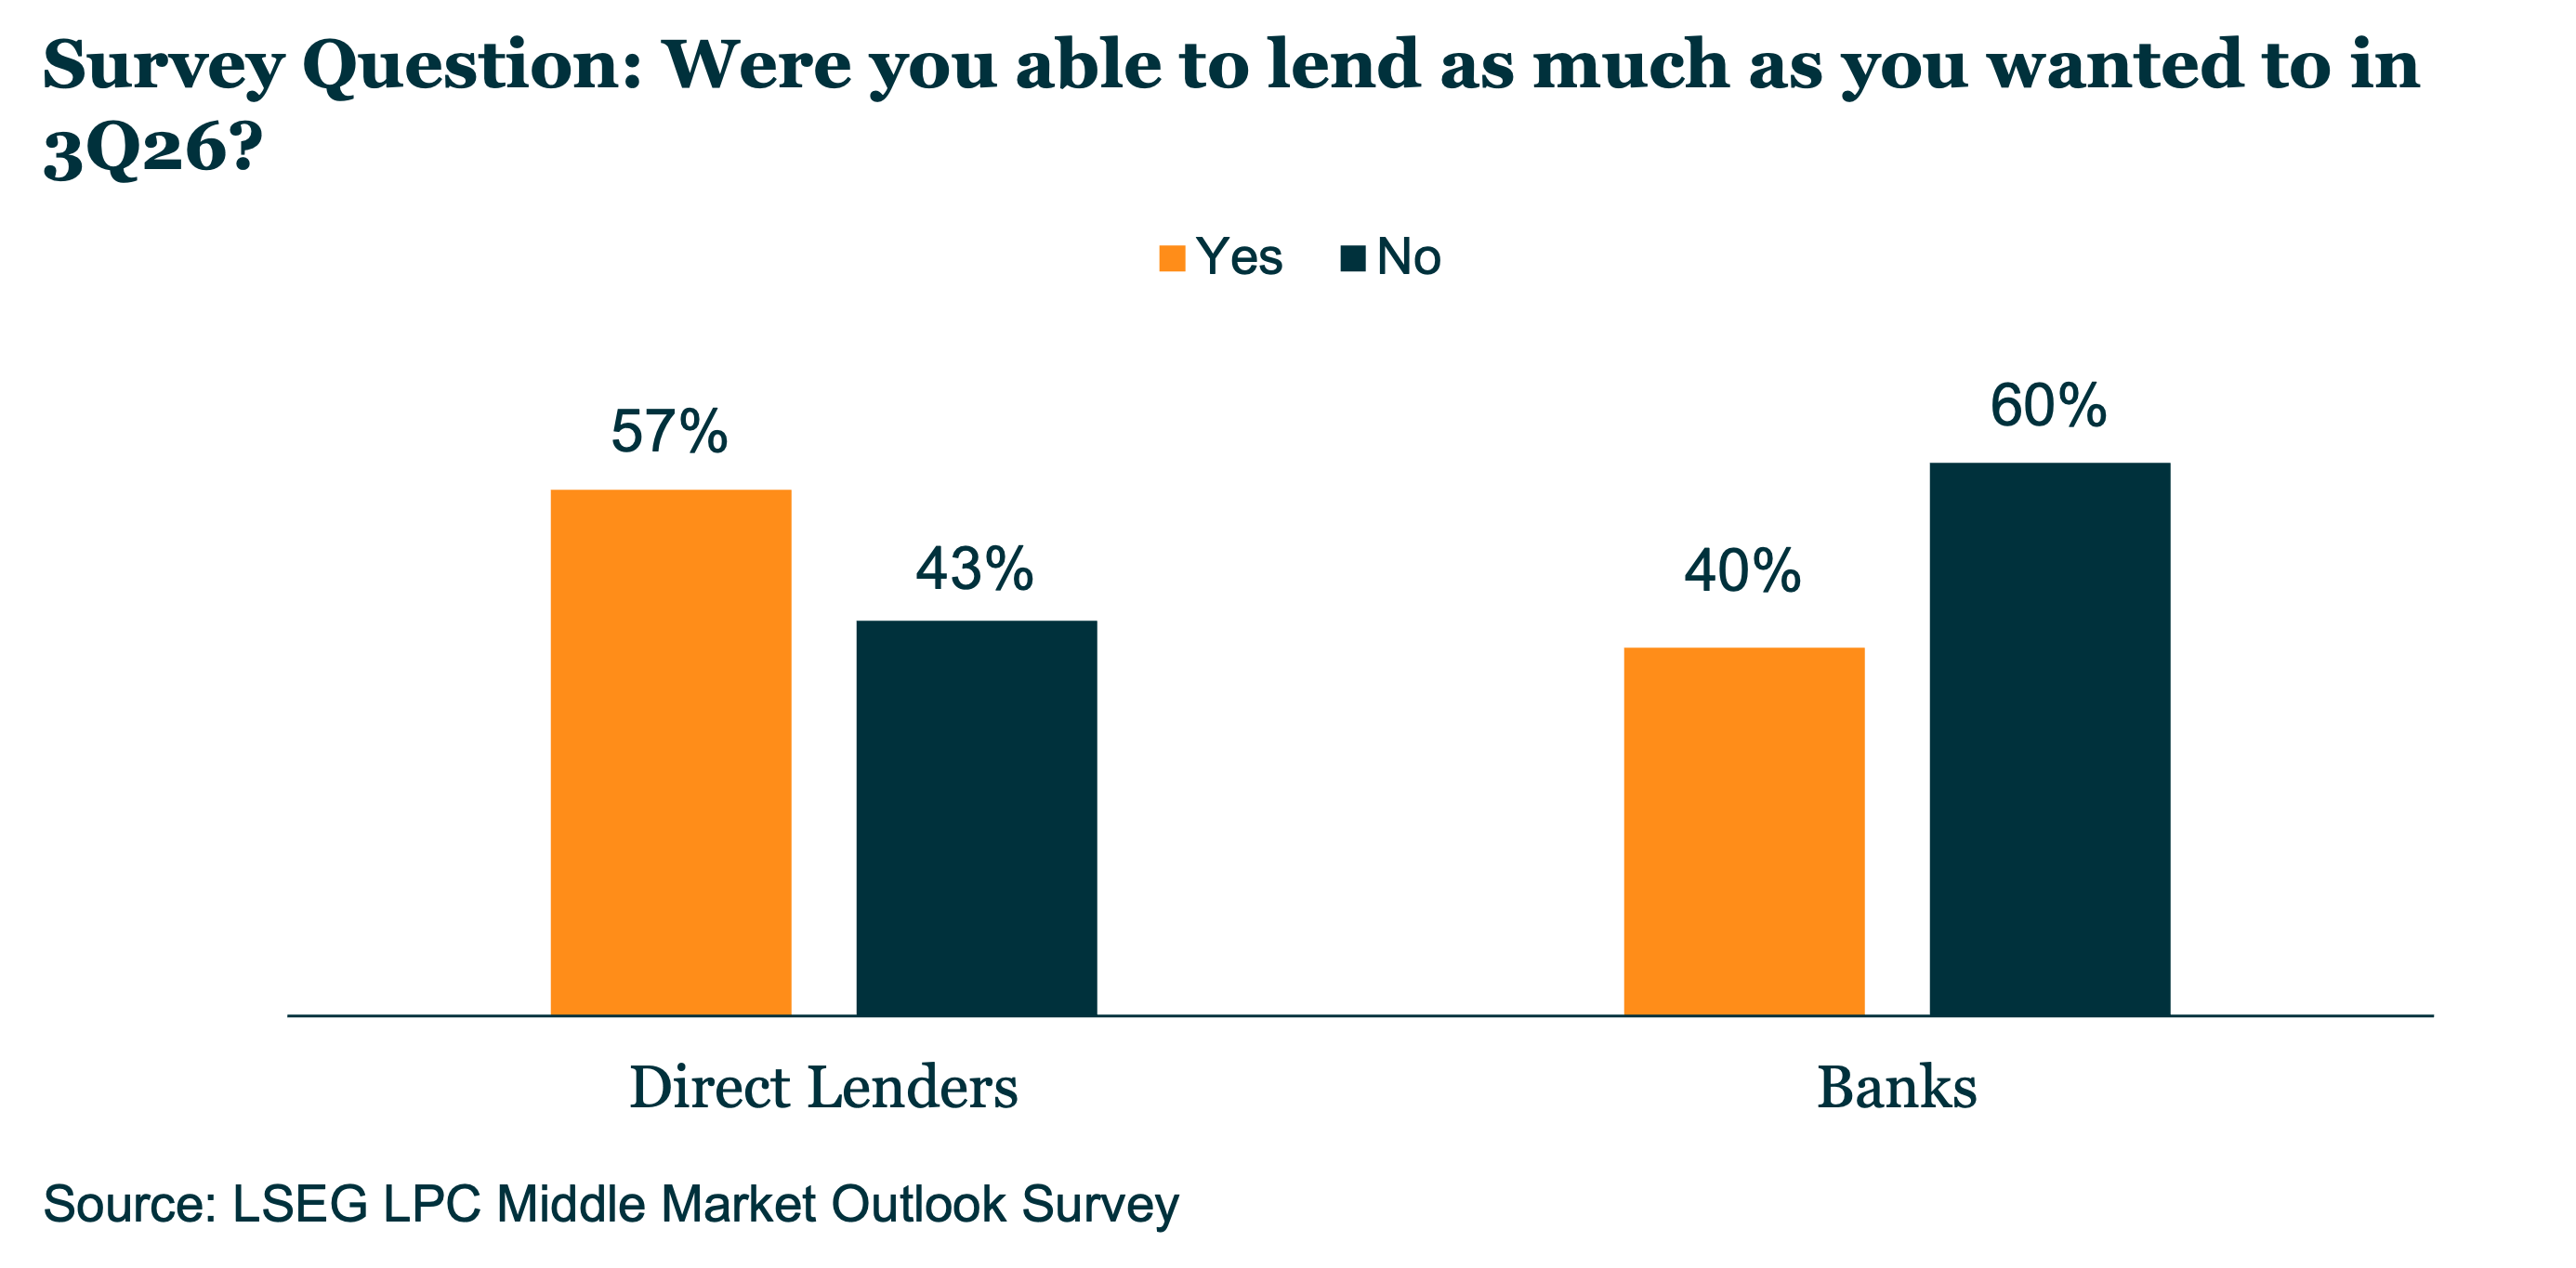
Middle market lender target achievement improved further in 3Q26


LSEG-0928 image

A slight majority of direct lenders (57%) achieved their middle market lending targets in 3Q26, while 60% of banks fell short. Both figures represented a modest improvement from 2Q26, when 50% of direct lenders and 33% of banks met their targets, and a significant improvement from 1Q26, when just 30% of direct lenders and none of the banks surveyed achieved their lending goals...


Contact: CJ Doherty

PB-logo-TL-1 image

The Pulse of Private Equity


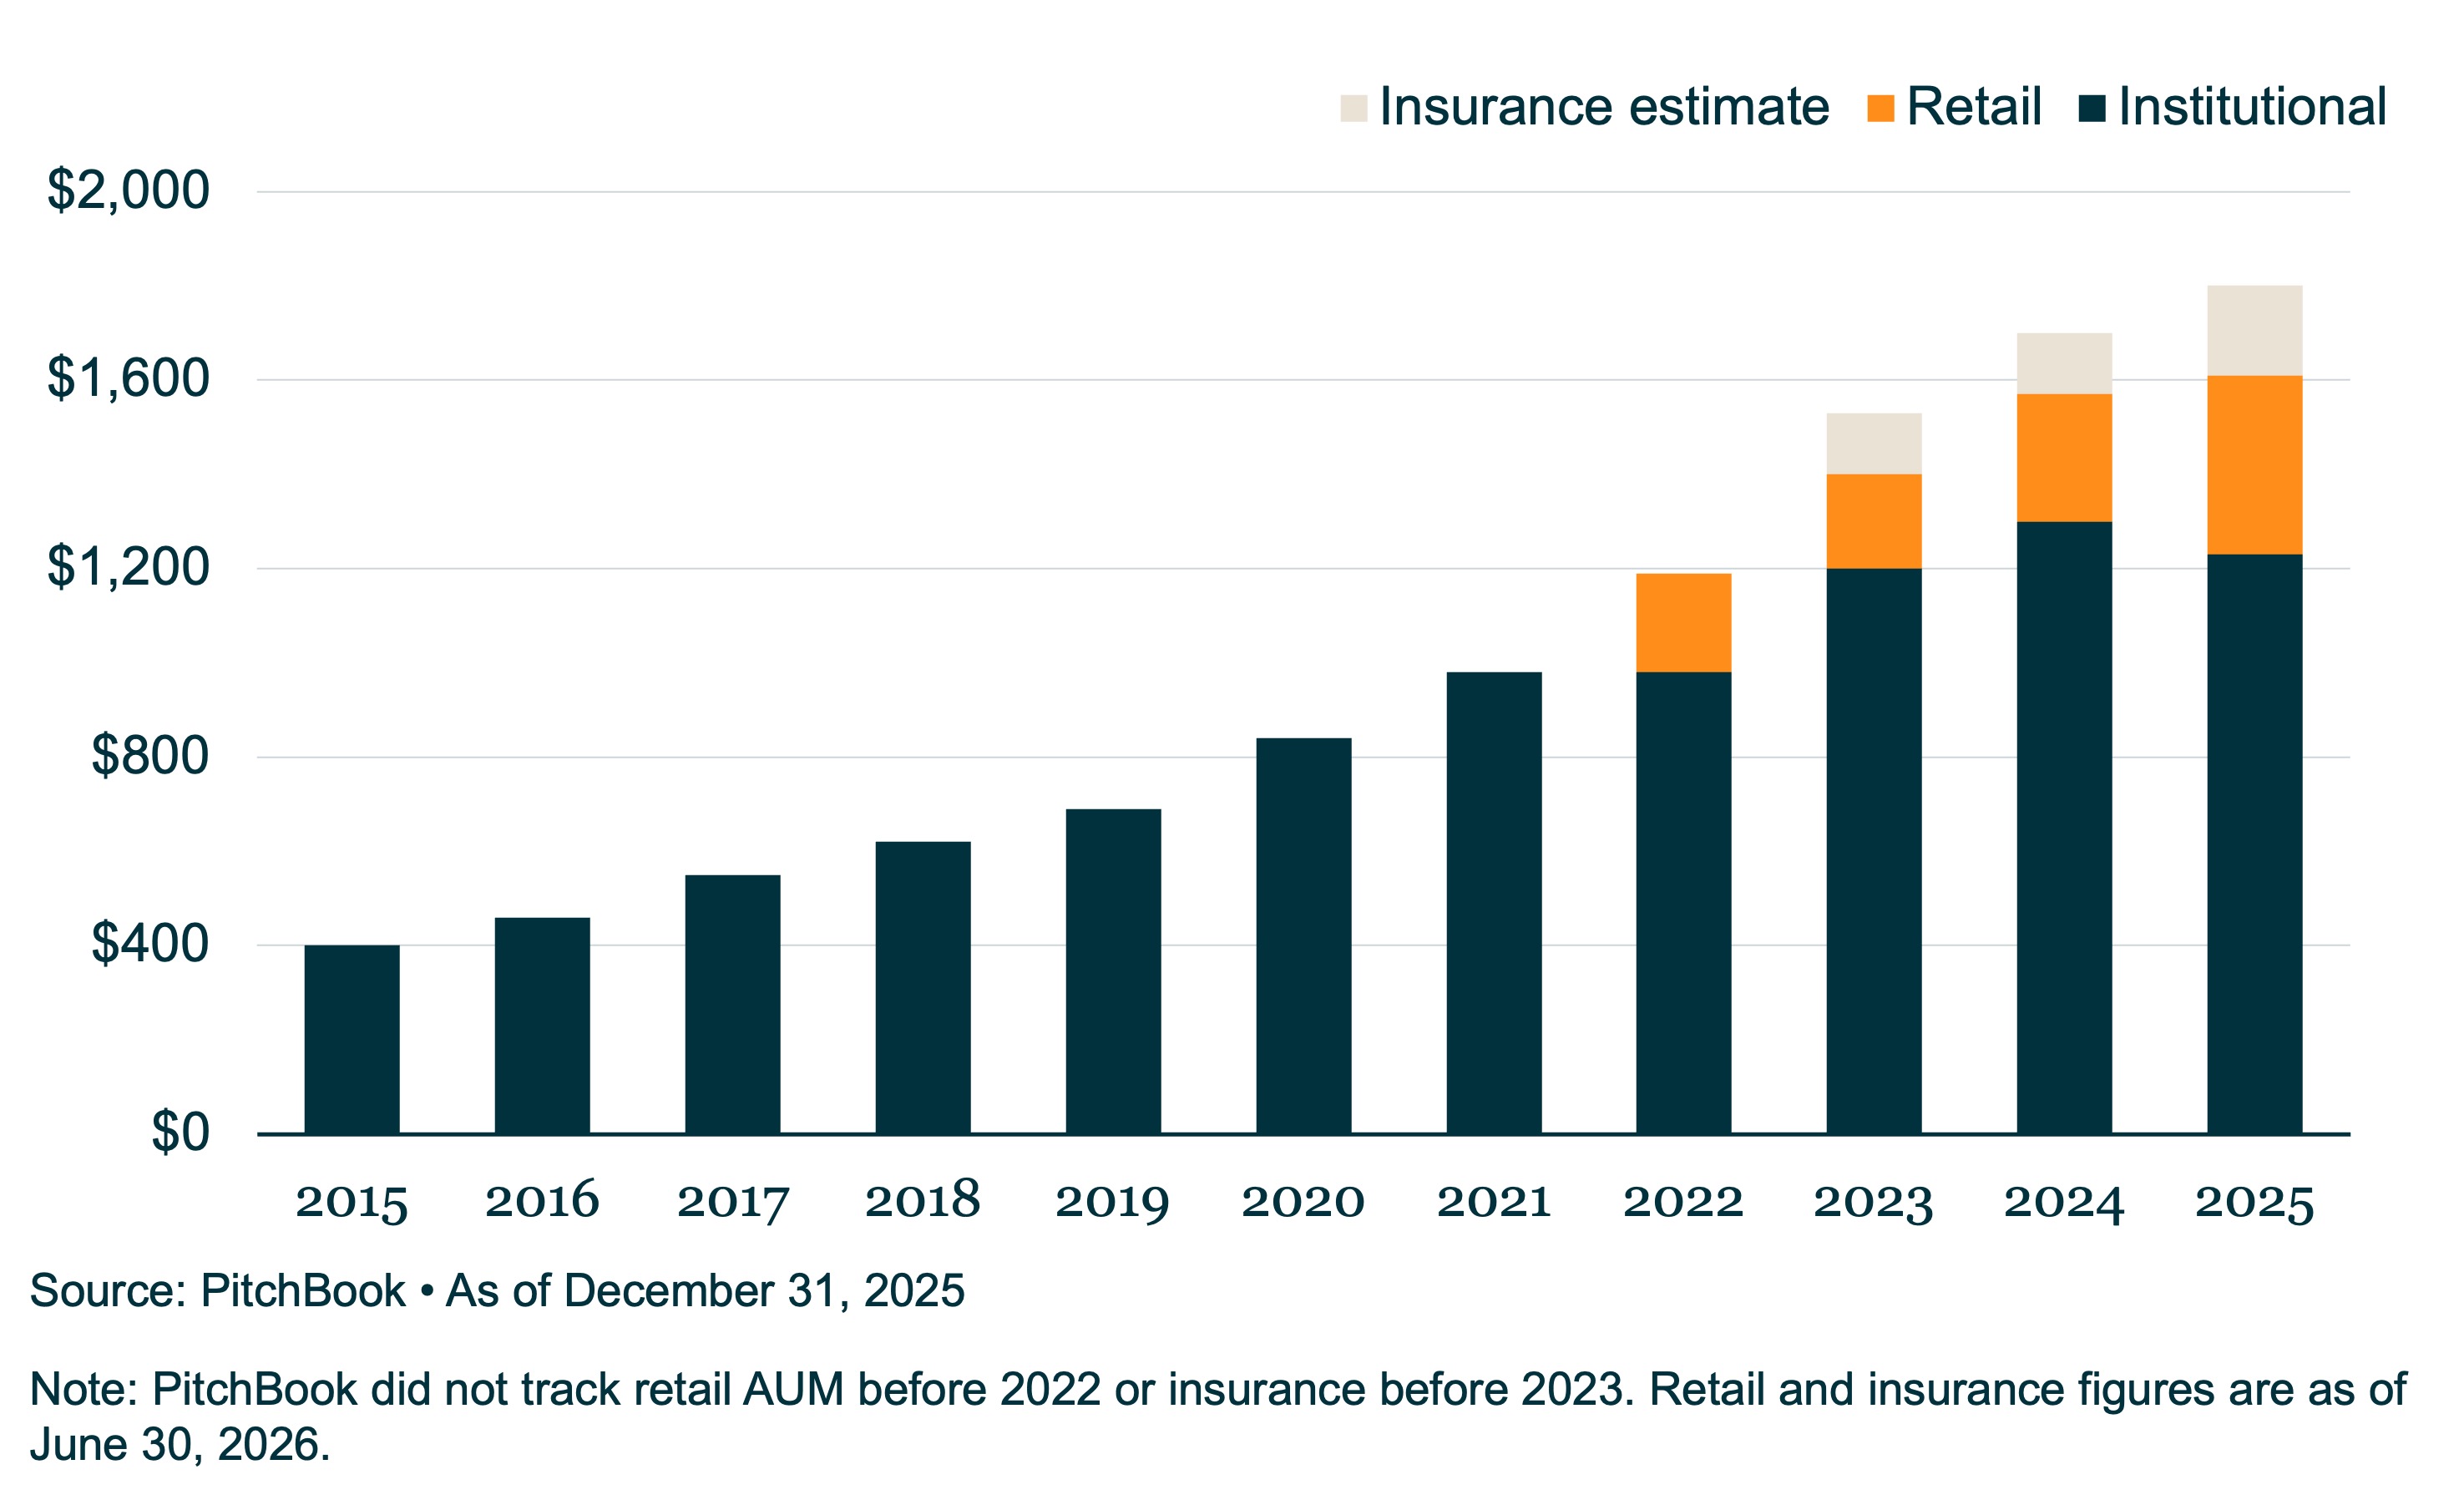
US private debt AUM ($B) by channel


PB-0928 image

Download PitchBook’s Report here.


In 2025 and the early part of 2026, the retail channel added AUM to the asset class at a much faster rate than institutional investors in both regions, with growth rates of 43.7% globally, 41.4% in the US, and 73. 1% in Europe through the beginning of 2026 compared with year-end 2024 figures...

Contact: Garrett Black

KBRA-logo-TL-1 image

KBRA Direct Lending Deals: News & Analysis


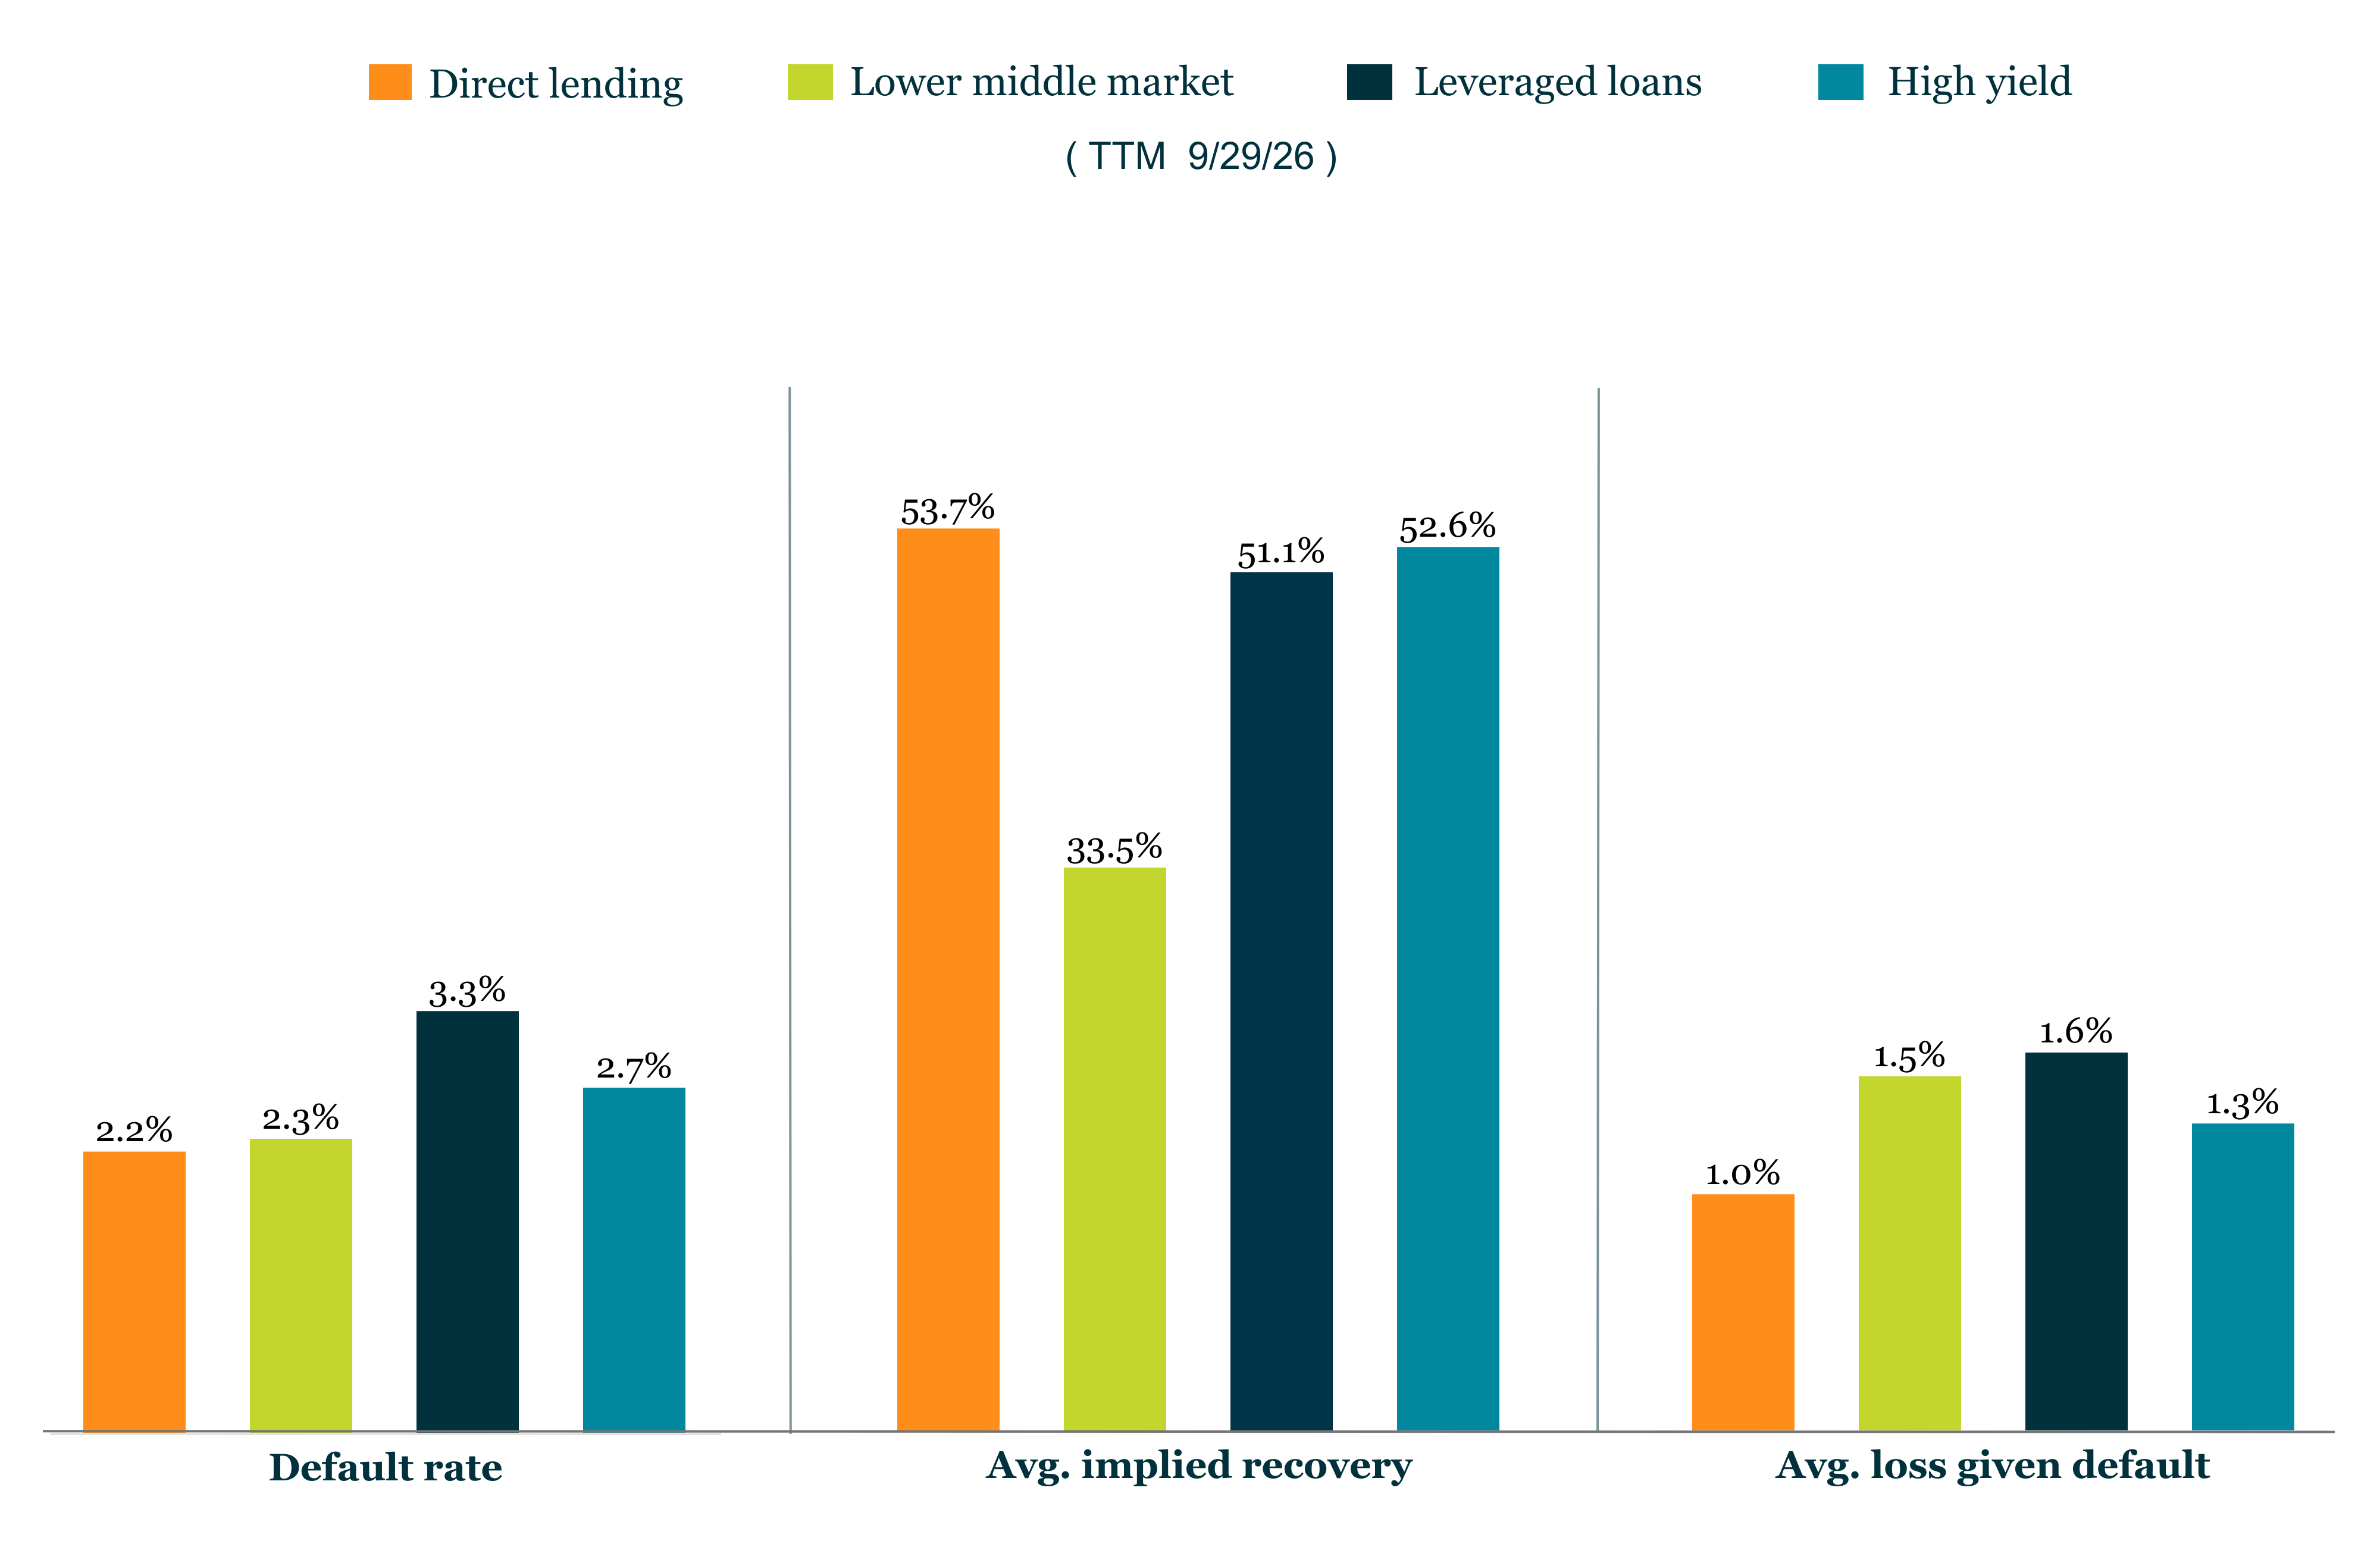
KBRA DLD Default Indices


KBRA-0928 image

Contact: Eric Rosenthal

CR-TL-logo image

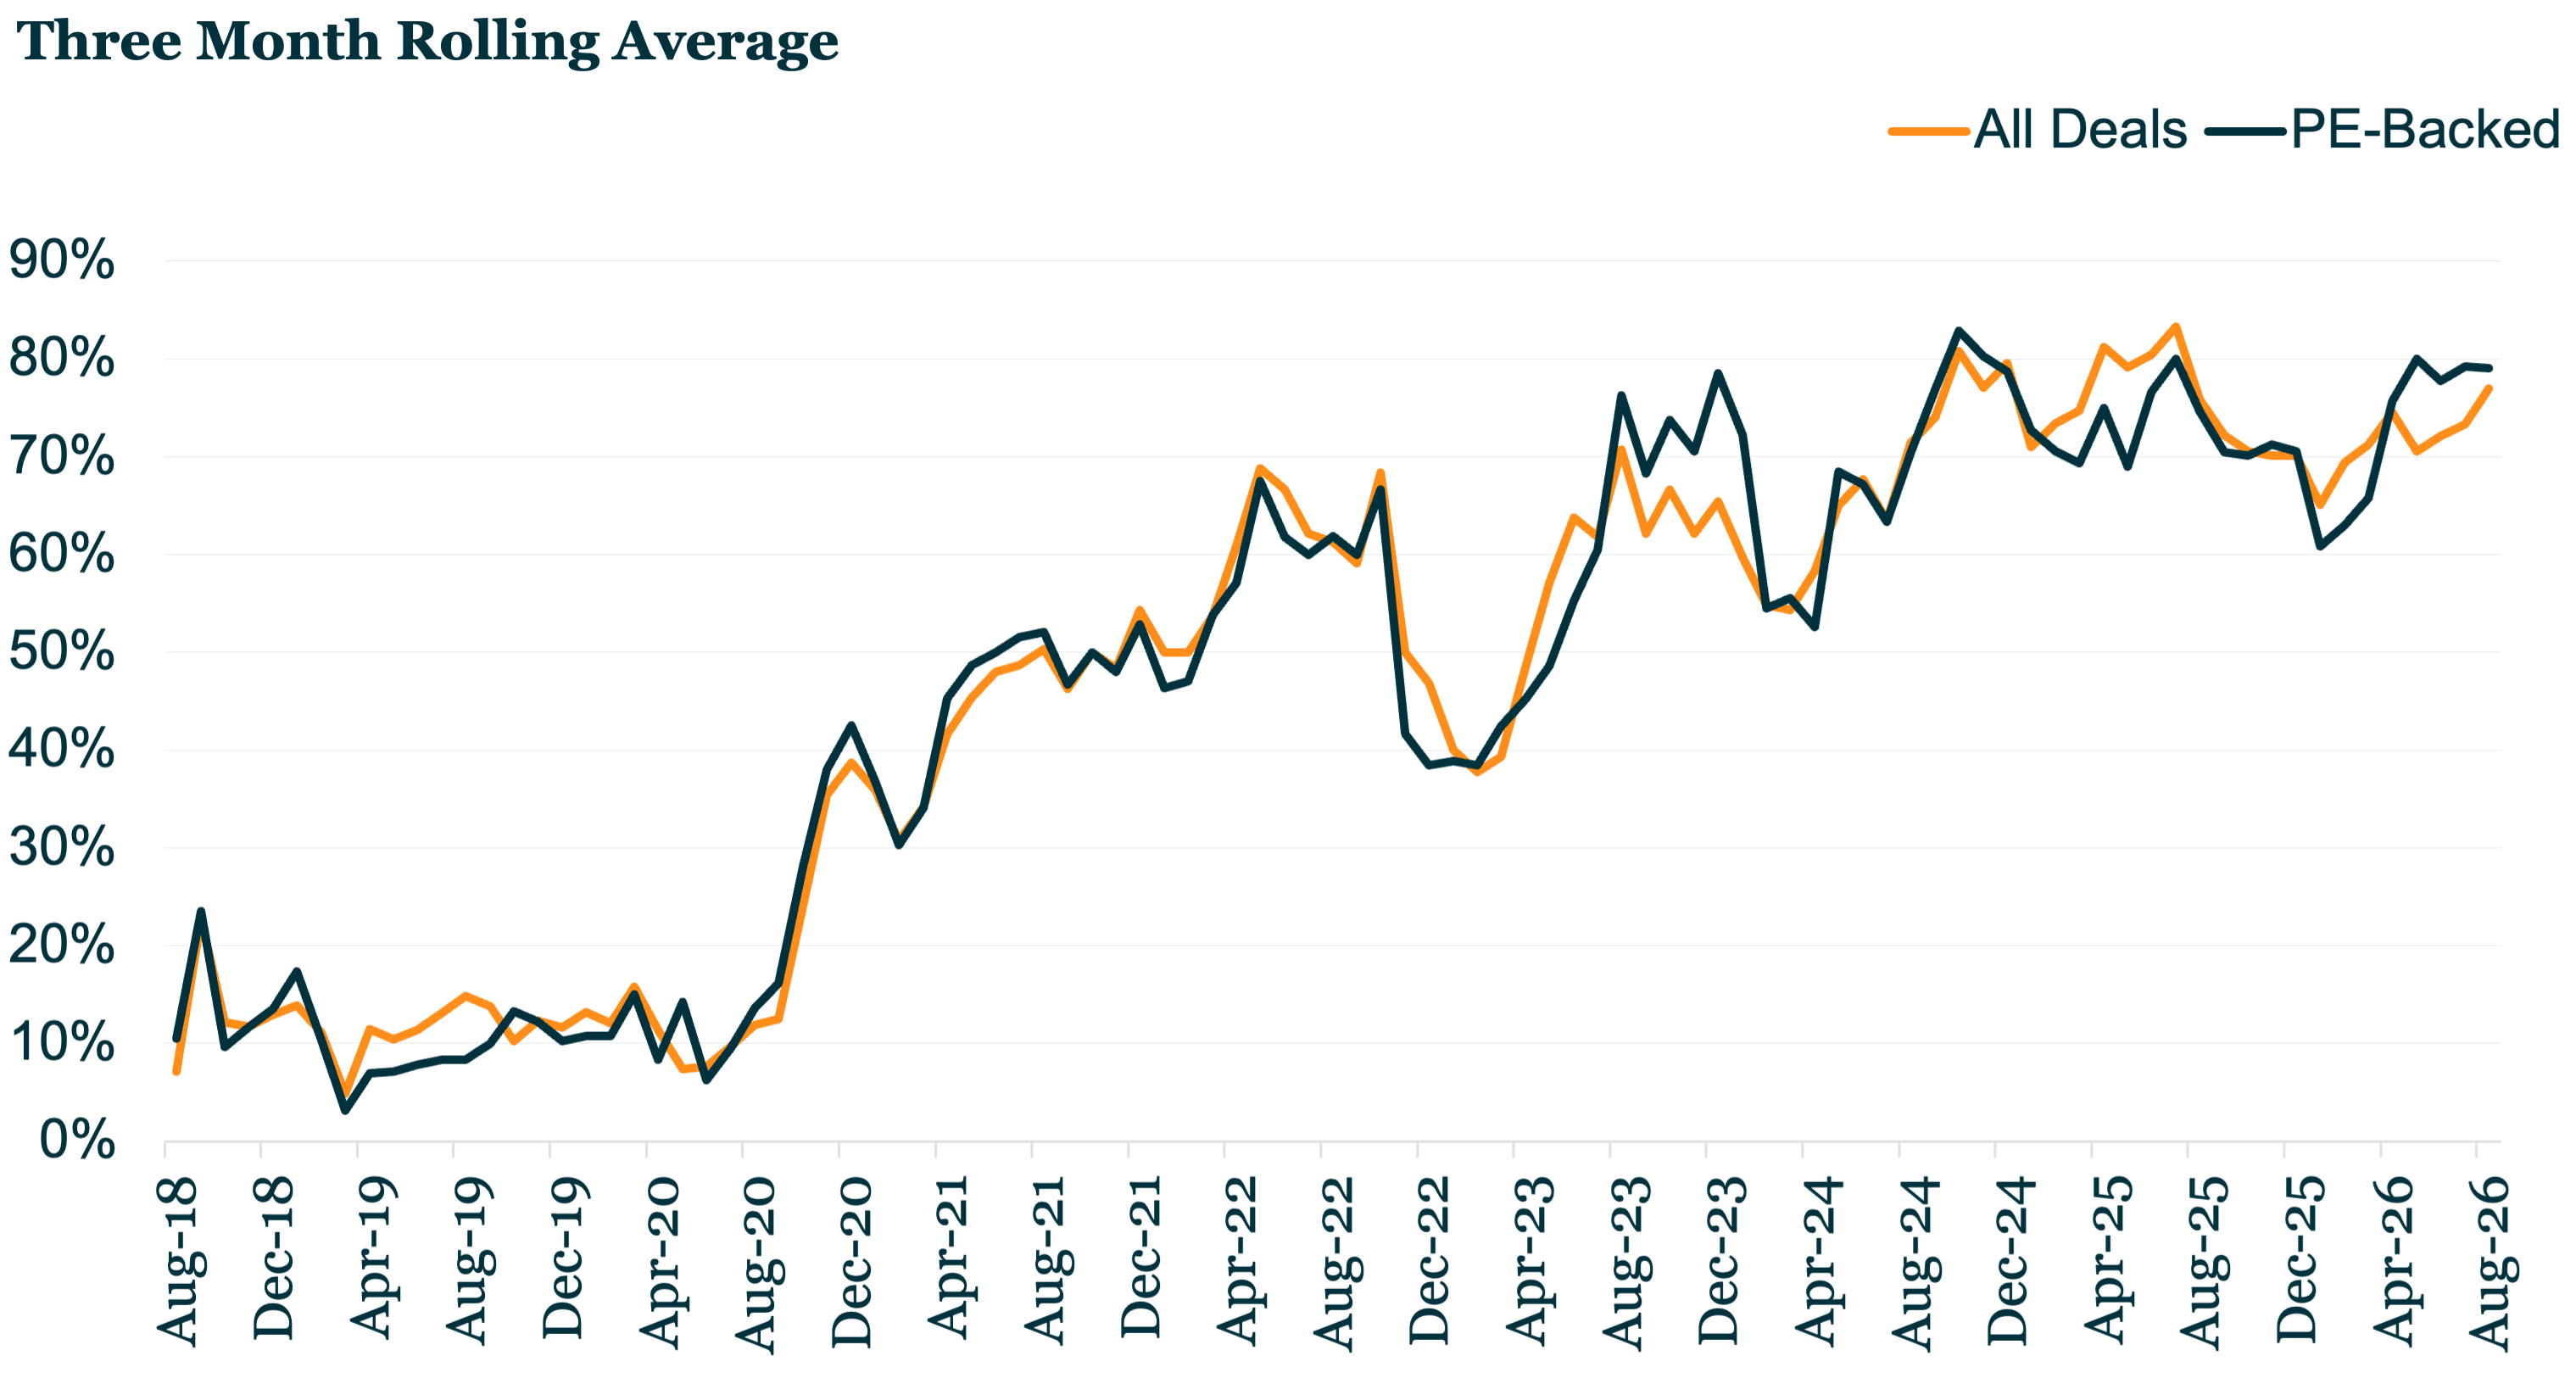
Covenant Trends 


Percentage of First Lien Loans with Affected Lender Voting Protection


CR-0928 image

Contact: Steven Miller

FR-TL-logo image

Middle Market & Private Credit


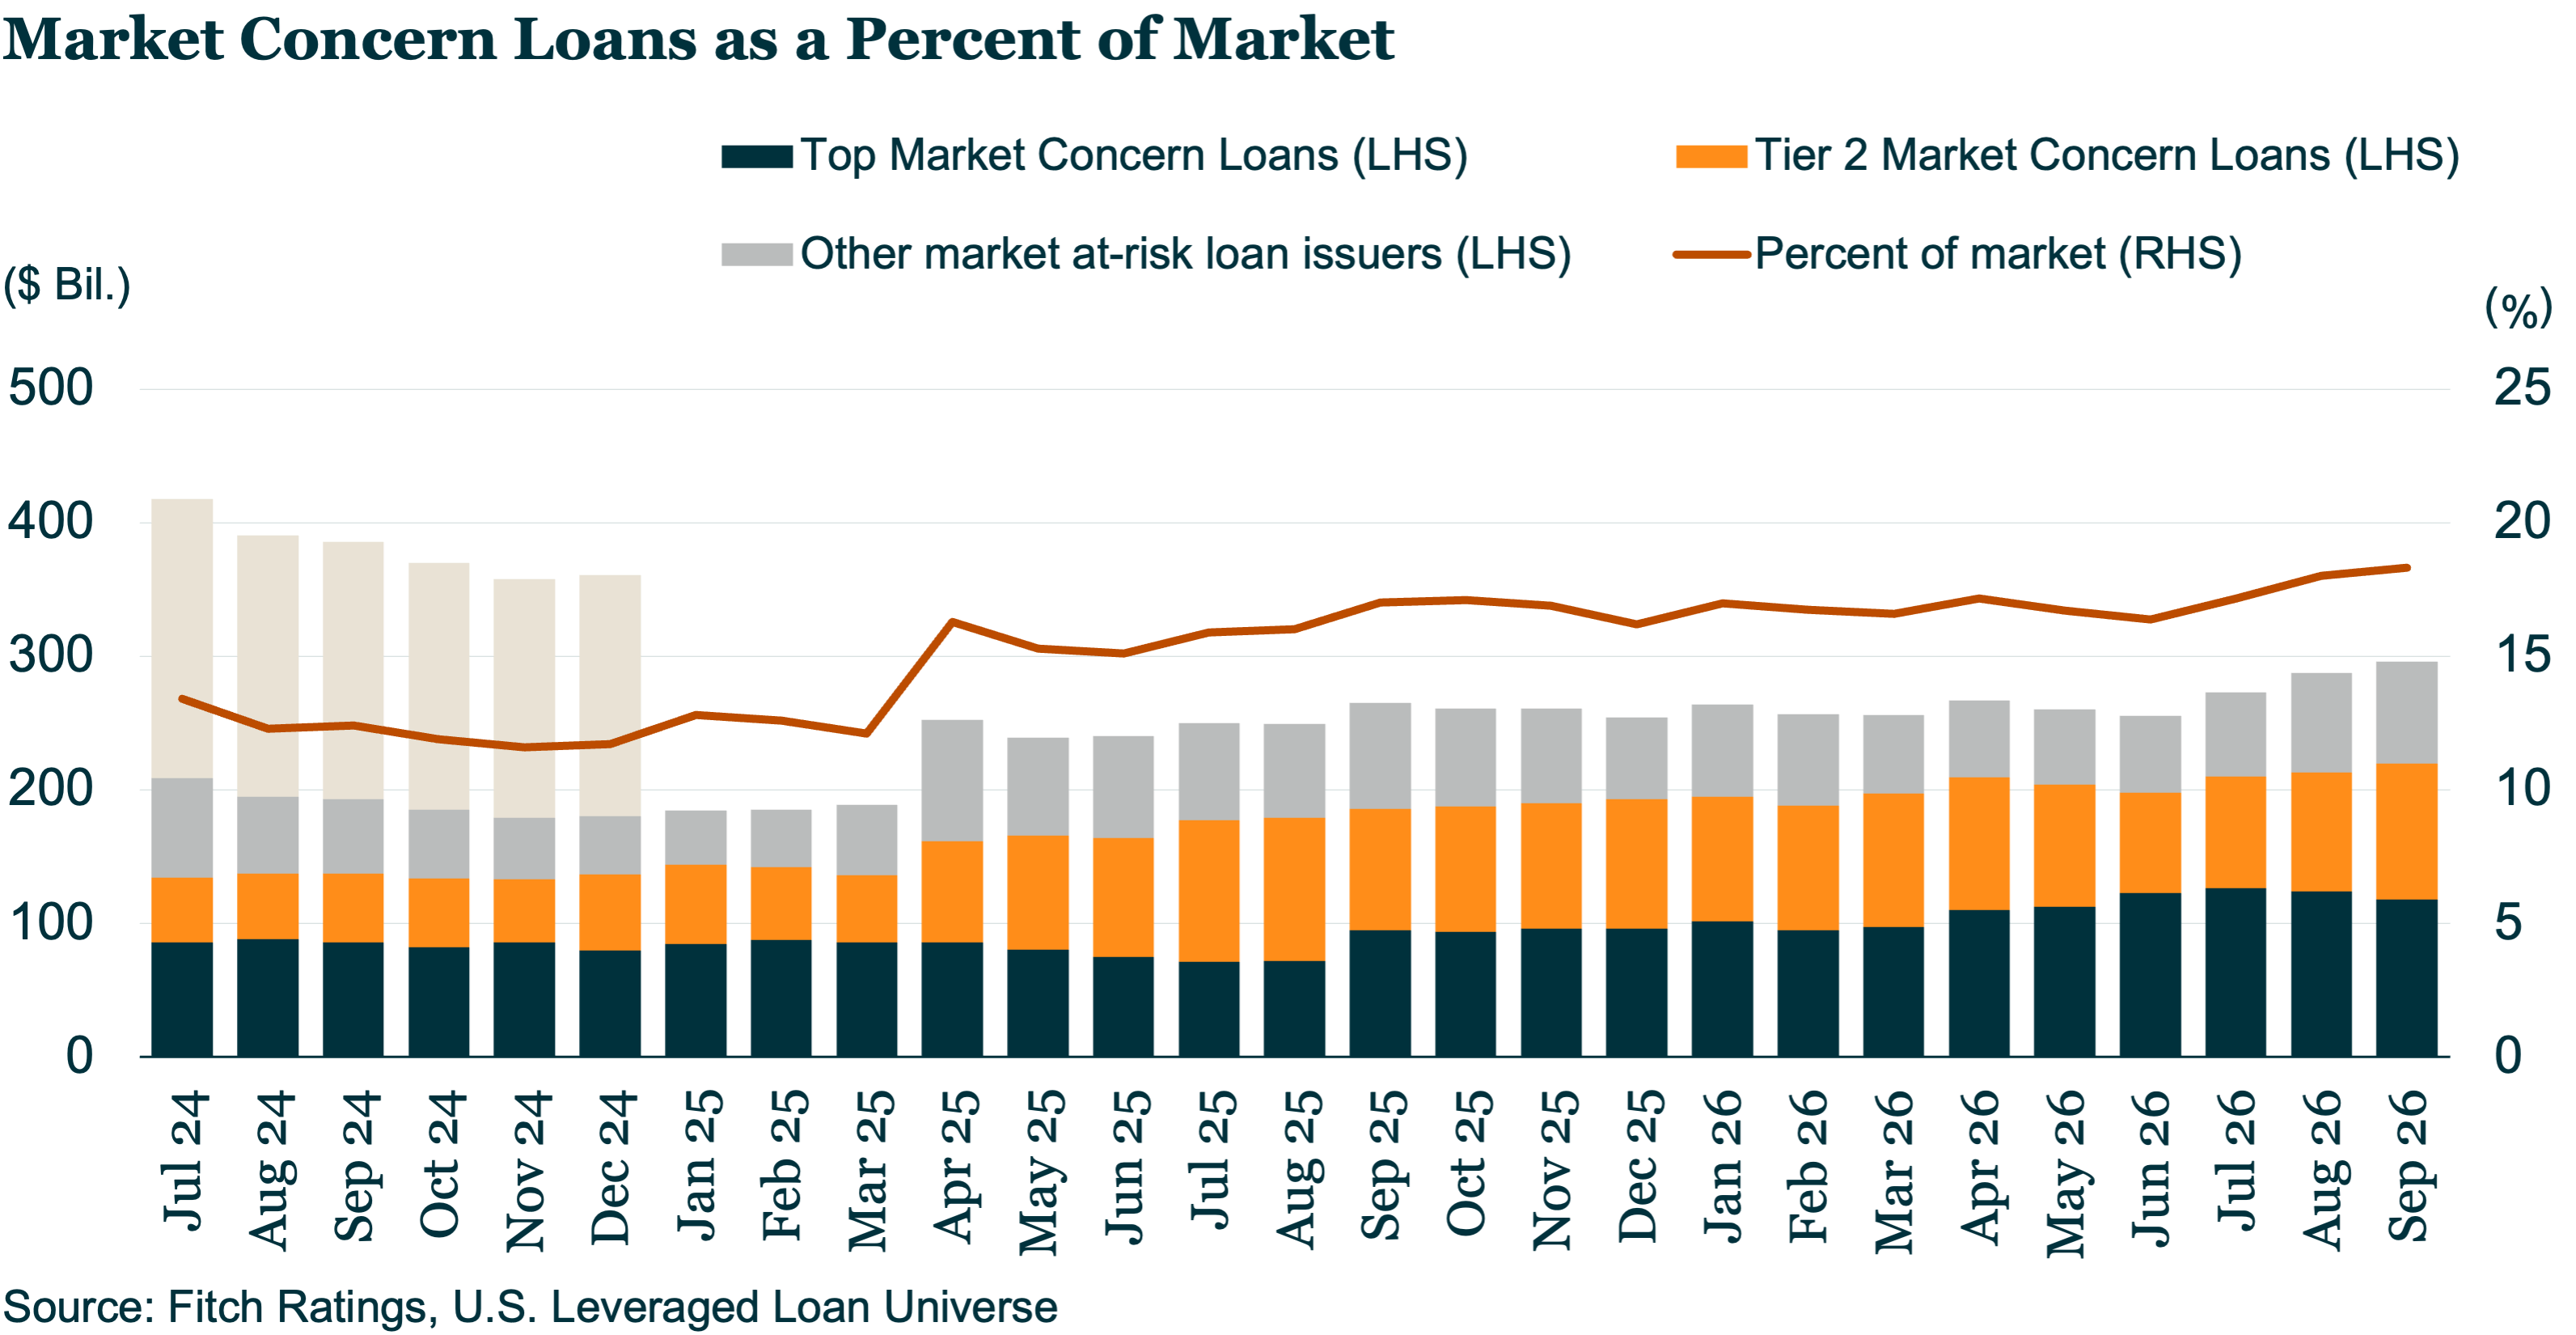
Low August U.S. defaults reflects seasonal slowdown as market concern loans build


FR0928 image

Click here to learn more.


U.S. leveraged loan and high-yield default rates were unchanged in August 2026 at 3.9% and 2.8%, respectively, as seasonal conditions limited default activity, Fitch Ratings says. Fitch expects leveraged loan defaults to rise to the 4.5%–5.0% year-end forecast range, supported by historically elevated Market Concern Loan outstandings...

Contact: Ira Fox

OCTUS-TL-logo image

Private Credit & Deal Origination Insights


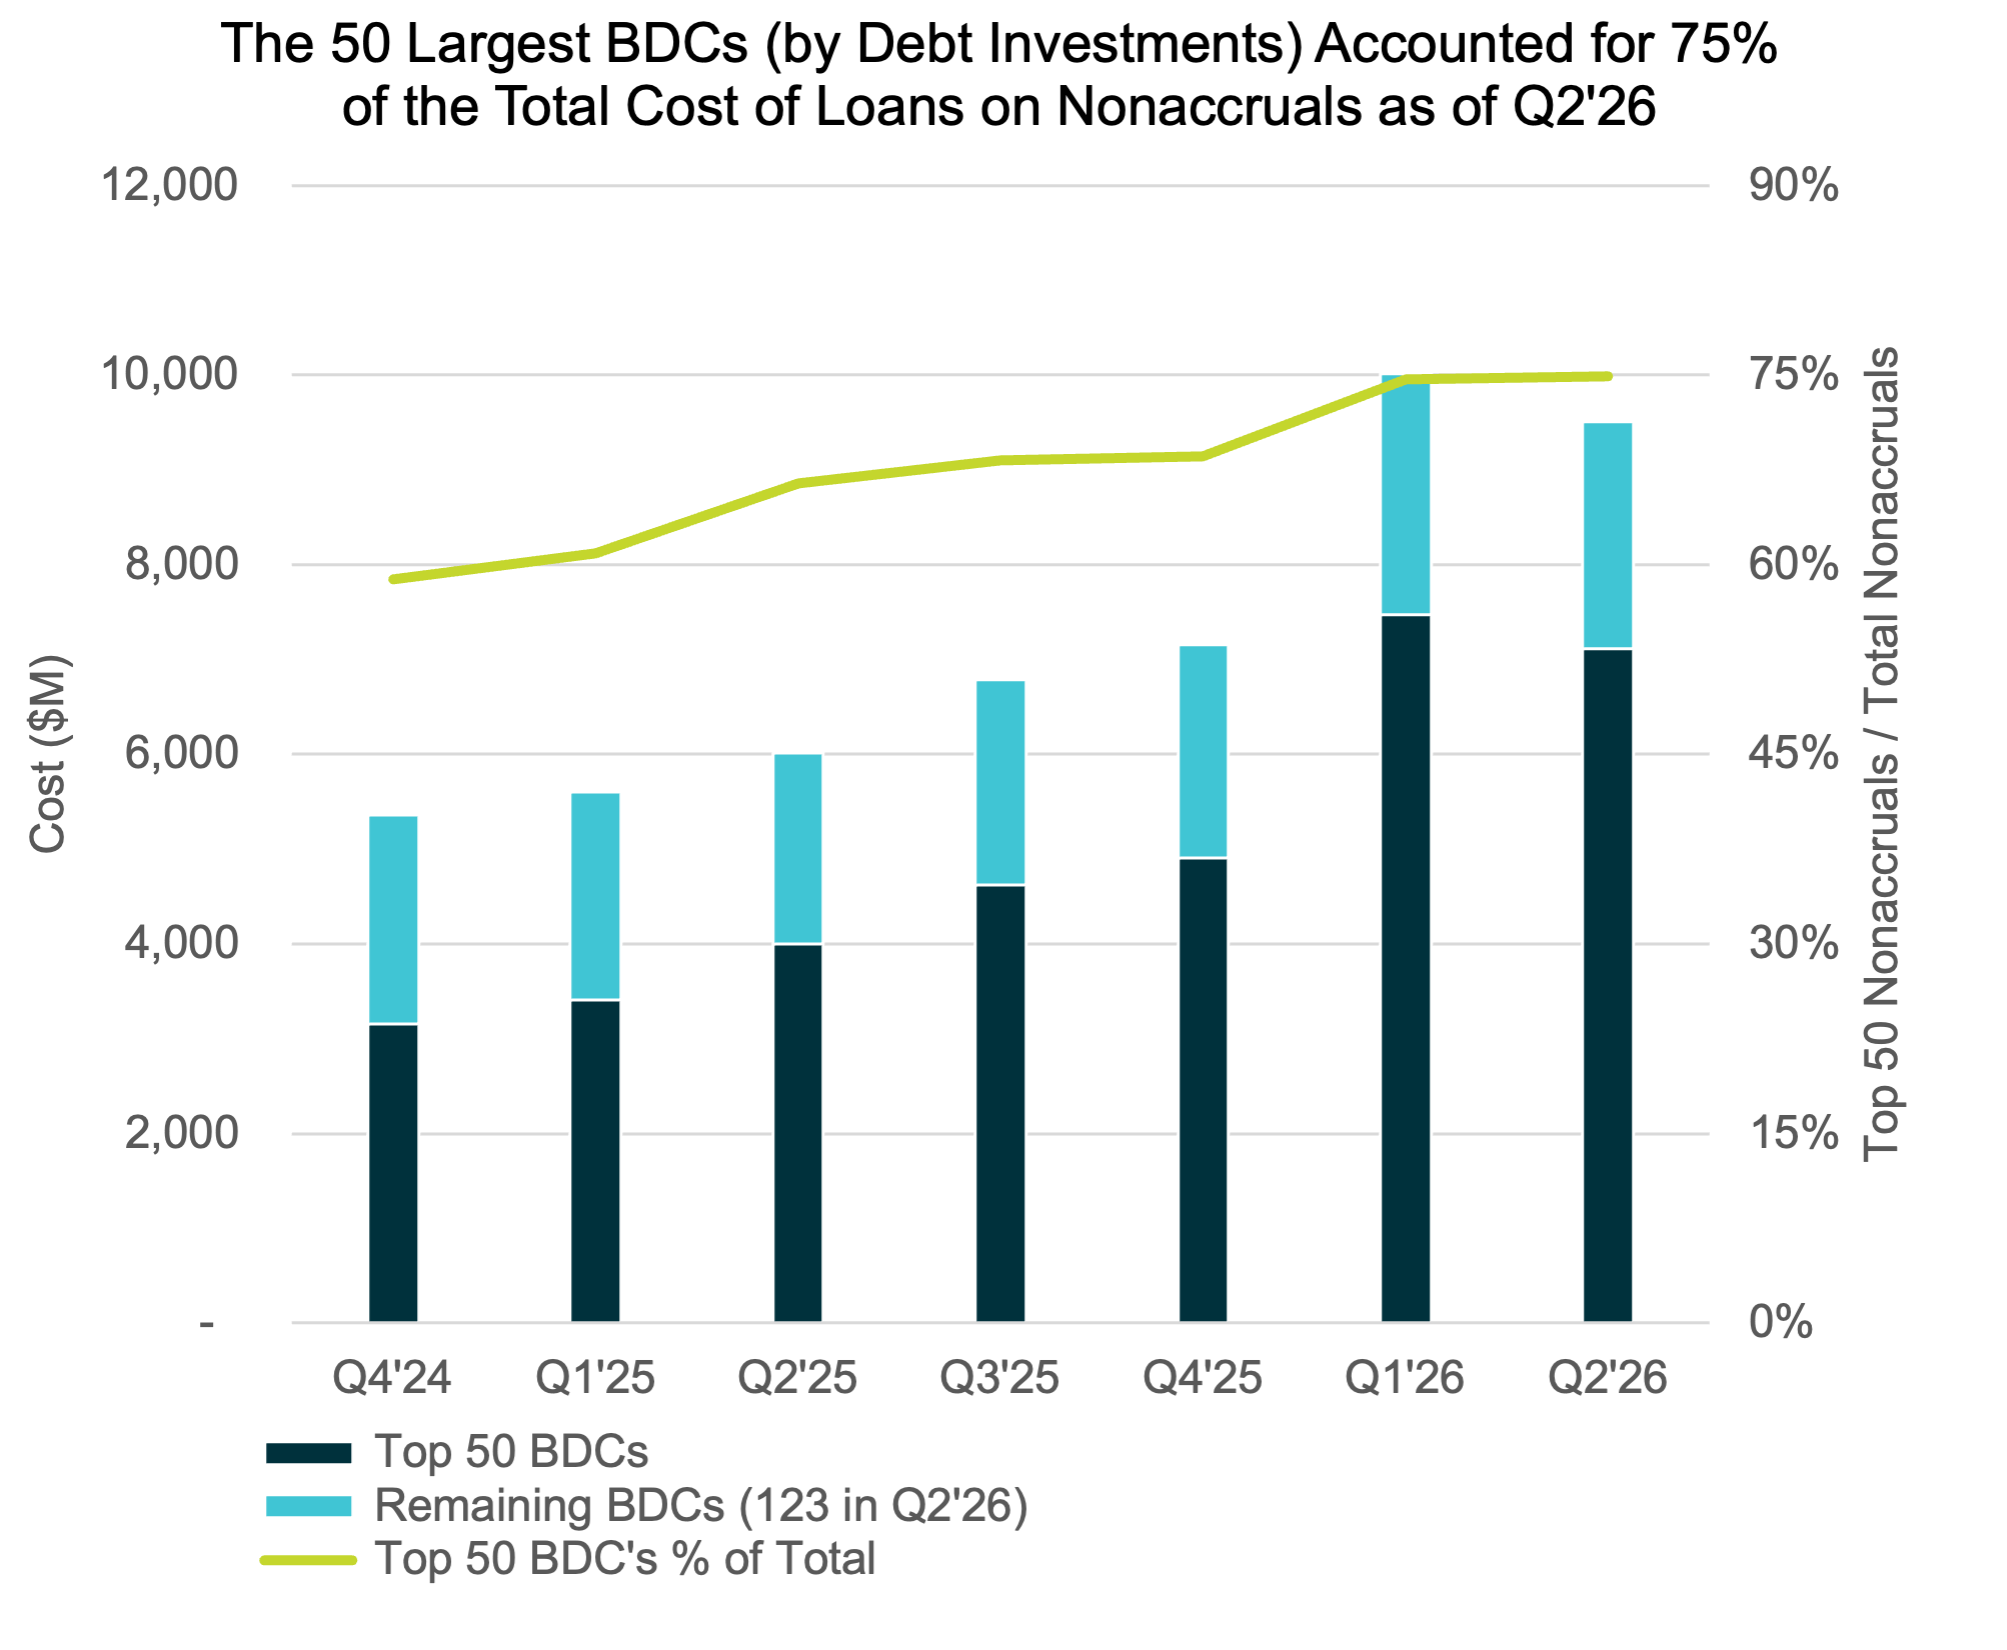
Top 50 BDCs Accounted for 75% of Nonaccrual Loan Cost in Q2’26


OCTUS-0928-1 image

Please email to request the full report.


The 50 largest BDCs, on the basis of total debt investments as of the second quarter of 2026, accounted for 75% of the total aggregate reported value of nonaccrual debt at cost and fair value.

Contact: Kim Giancaspro

LFI-TL-logo image

High-Yield Bond Statistics


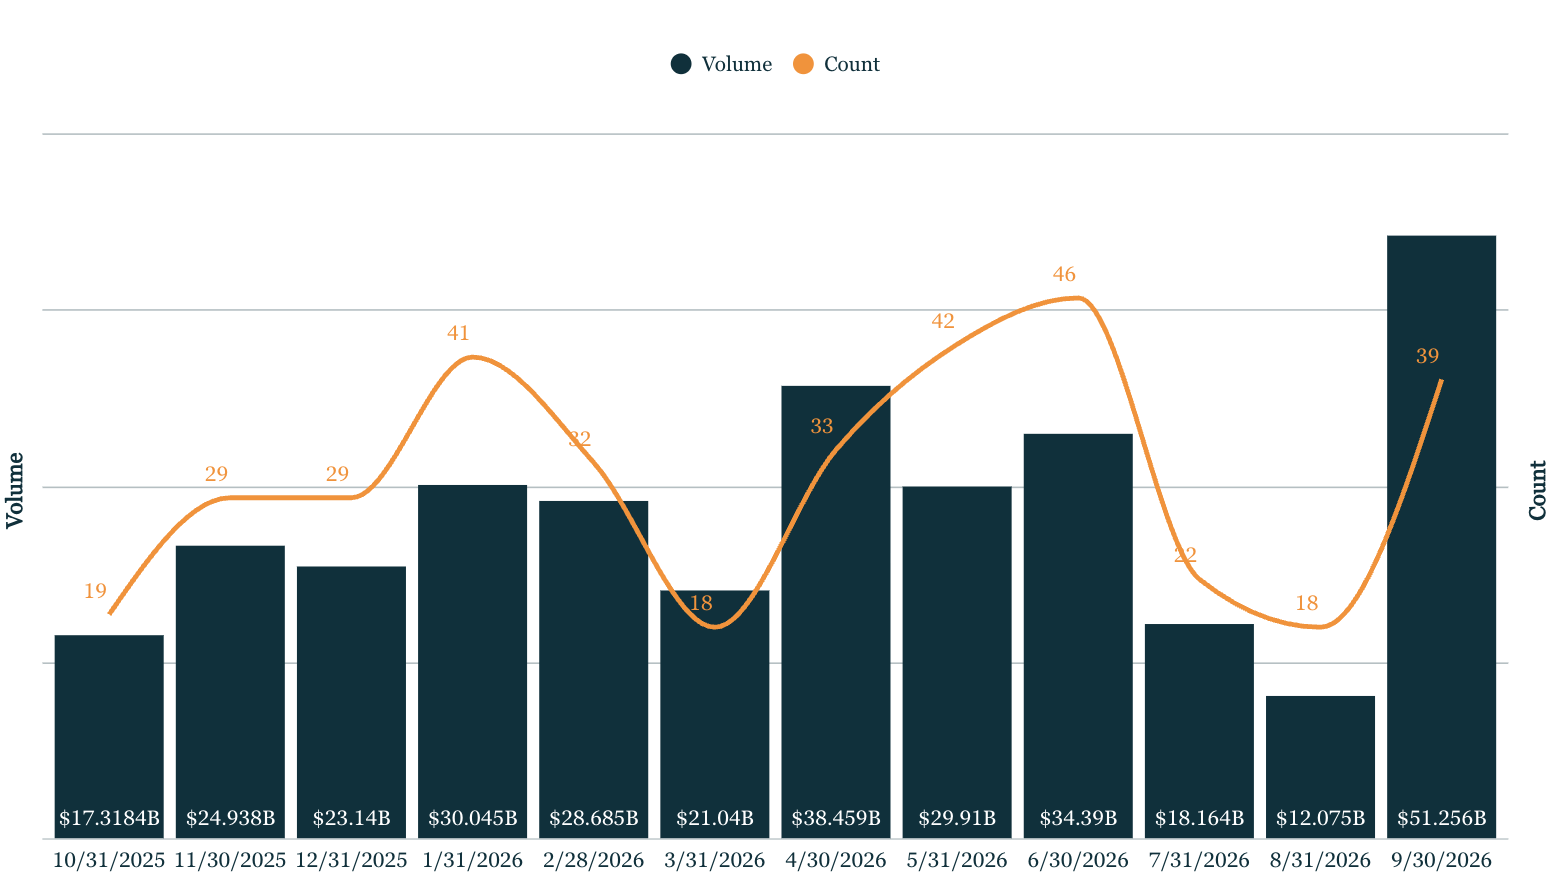
Launched volume

LFI-0928-01 image

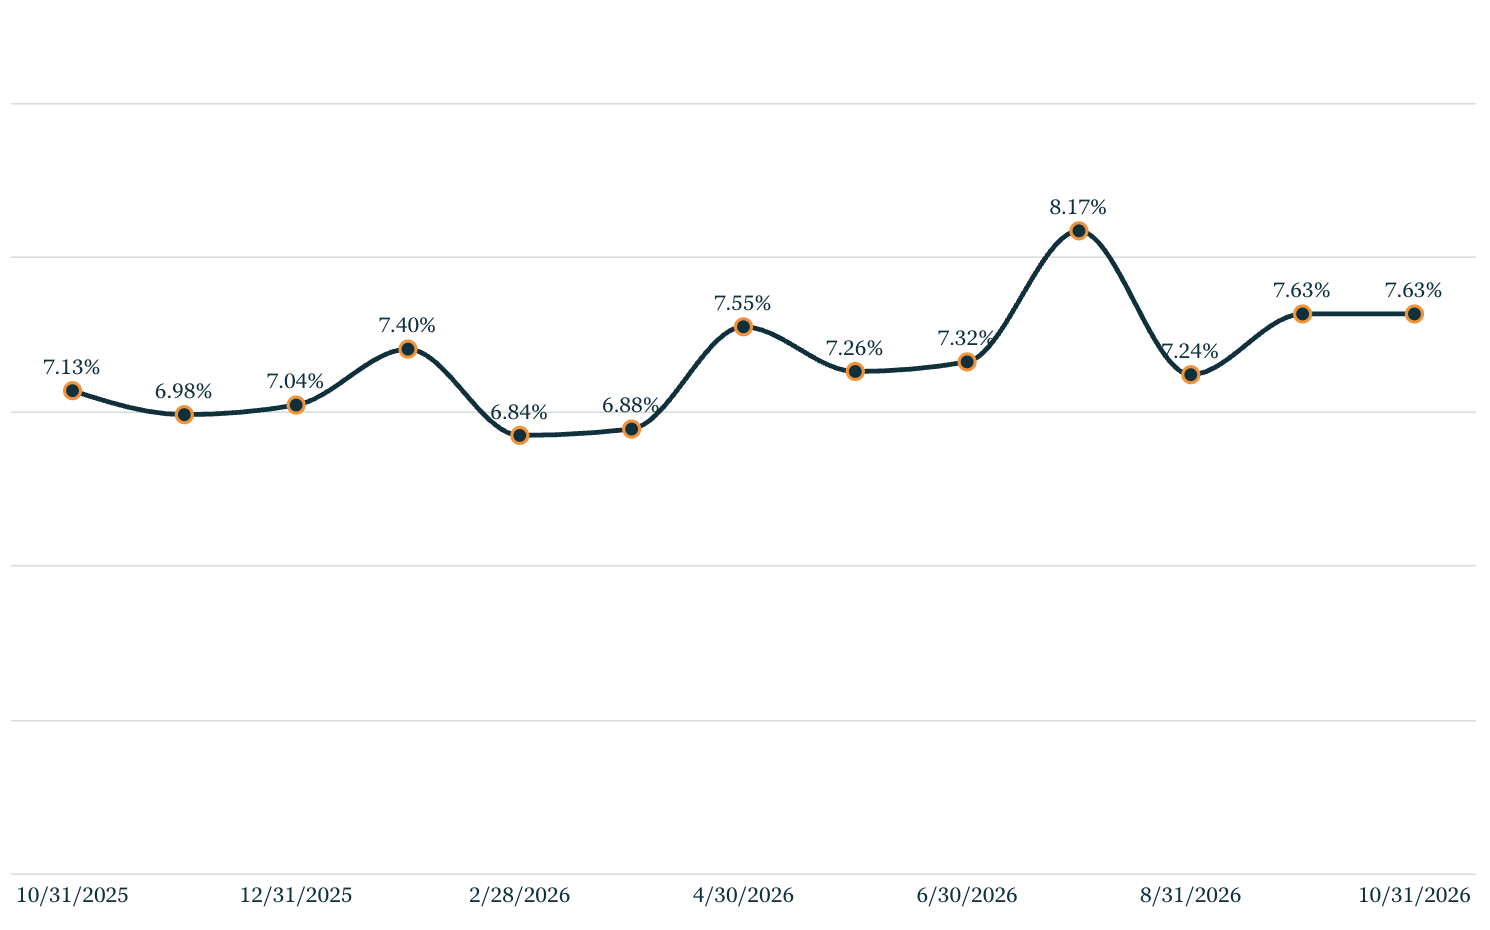
New-issue yields

LFI-0928-02 image

Contact: Robert Polenberg

DW-TL-logo image

Debtwire Middle-Market


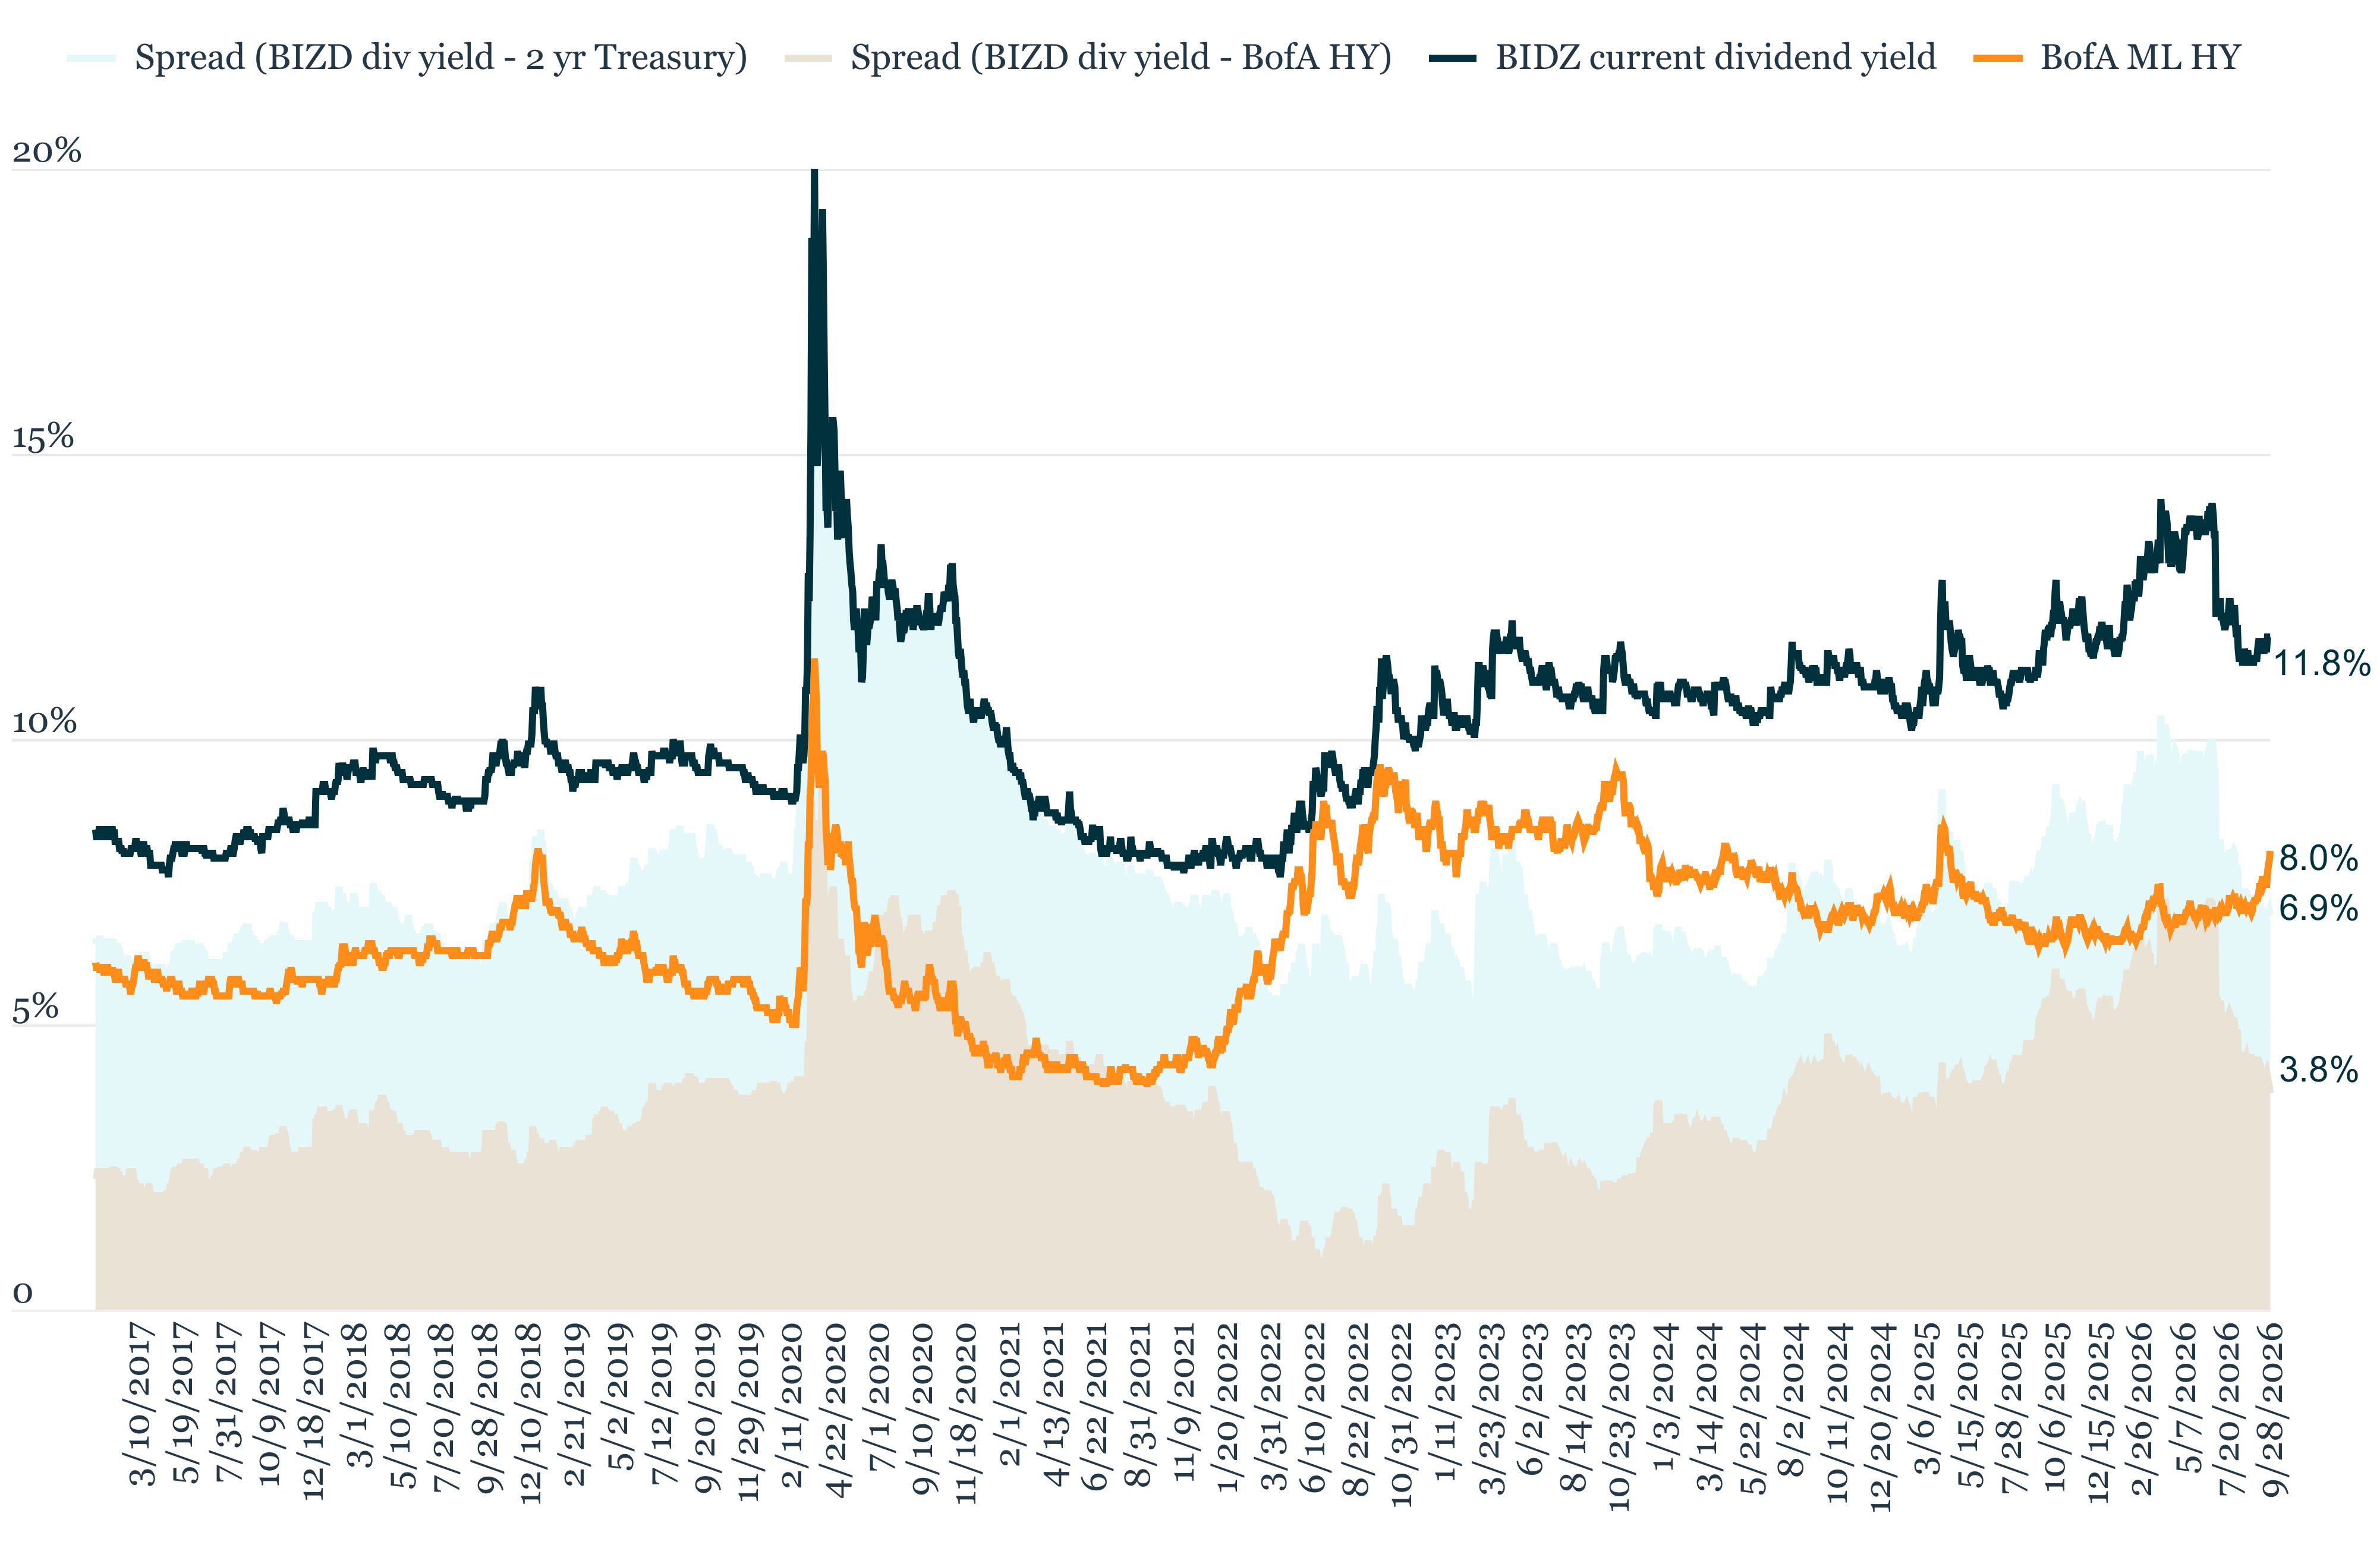
Middle market debt held by BDCs vs High yield vs Treasury yields


DW-0928 image

The blue line represents the dividend yield of the VanEck BDC Income ETF (BIZD), which stood at 11.8% as of 28 September, down 5bps from a year earlier. BIZD’s share price declined 14% YoY to USD 12.87, broadly in line with the 14.3% reduction in trailing-12-month distributions to USD 1.52 per share. However, the latest quarterly distribution fell 45.6% YoY and 50.4% sequentially to USD 0.24. Annualizing the latest payout implies a significantly lower forward distribution yield of 7.4%, materially below the current 11.8% trailing yield, questioning the forward-looking attractiveness of the asset class...


Contact: Suneet Chandvani

Leveraged Lending Insights


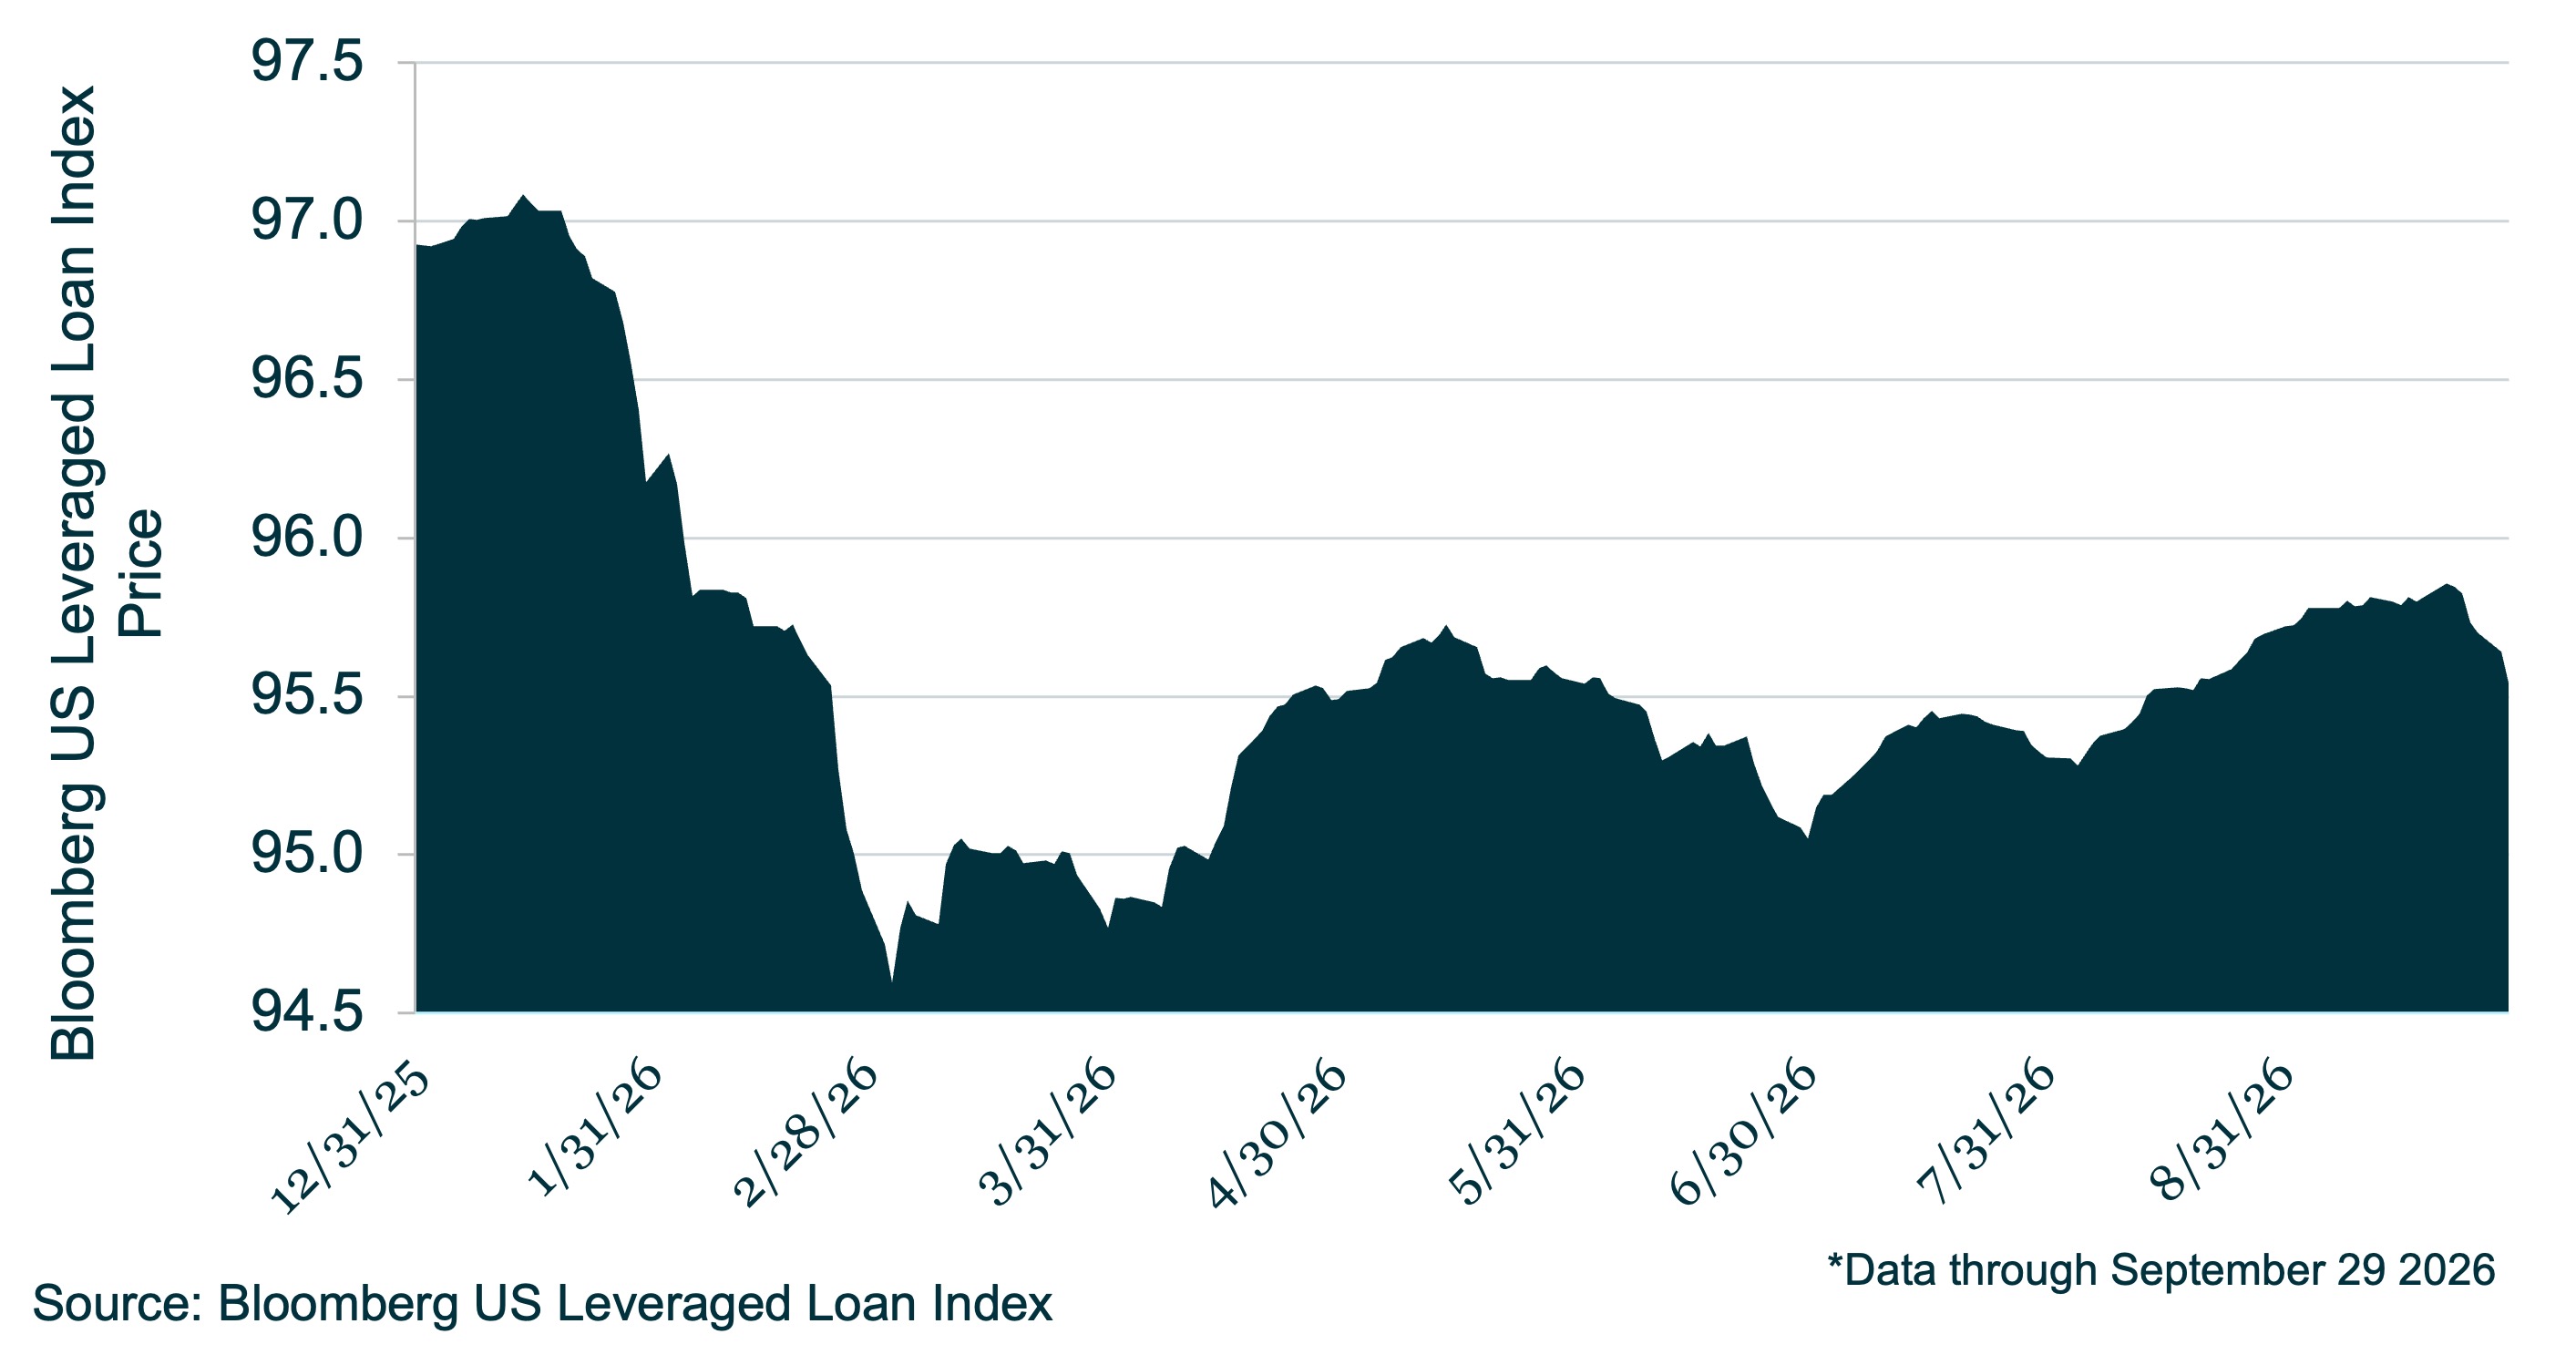
Summer recovery stalls as secondary loan pricing retreats from September peak


BBG-0928 image

The summer recovery in US leveraged loan secondary market pricing has recently lost momentum, with average prices declining to 95.54 on September 29 from a recent high of 95.86 on September 21, according to the Bloomberg U.S. Leveraged Loan Index (Ticker: LOAN). Secondary prices reached a 2026 high of 97.08 in January before falling sharply to 94.60 in March, as heightened geopolitical uncertainty surrounding the conflict in Iran weighed on investor sentiment...

Contact: Vincent Daigger

footer image

This publication is a service to our clients and friends. It is designed only to give general information on the market developments actually covered. It is not intended to be a comprehensive summary of recent developments or to suggest parameters for any prospective financing opportunity.