RBGWA - Logo - Full Color.png
 

RBG Wealth Weekly

April 21, 2023


Ladies and gentlemen, the weekend! In this space each week, Greg and I share some of our favorite articles, notes, and graphics from the past week along with our commentary. Please feel free to provide feedback and forward along to others if you enjoy. We appreciate you taking the time to read. 


If you are a client, we truly appreciate your business. If you are not a client, please click below to learn more about our firm and contact us.

Visit our Website
 

Articles of the Week

Your Income Taxes Are Due. Here’s Who Pays the Most.

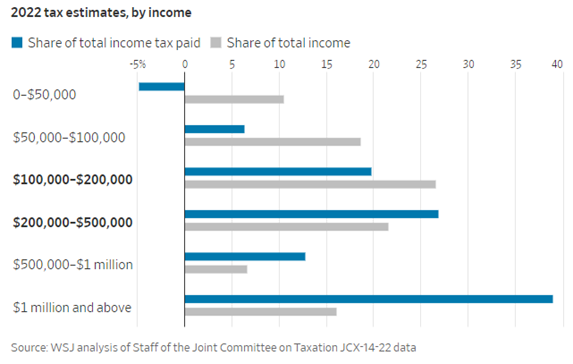
“Overall, the data show that the lowest U.S. earners—about 43% of taxpayers with $50,000 or less—will earn about 10% of total income and owe -4.8% of income taxes. This number is negative because both Republicans and Democrats have opted to route benefits such as the Earned Income Credit (for the working poor) and the Child Tax Credit through the tax system rather than another federal agency. Therefore, many filers in this group owe no net income tax and receive a check from the IRS for benefits.


This picture changes if levies such as payroll and excise taxes are counted for this group, in part because they include flat taxes that can apply from the first dollar. In this case, filers earning $50,000 or less in aggregate will pay 3.5% of total taxes.


For filers who do owe income taxes, the system is steeply progressive. As the data show, nearly 80% of projected income taxes for 2022 will be paid by about 10% of filers earning $200,000 or more, and those earning $1 million or more will pay half of that. All told, filers in this group will earn 44% of income earned by individuals.”


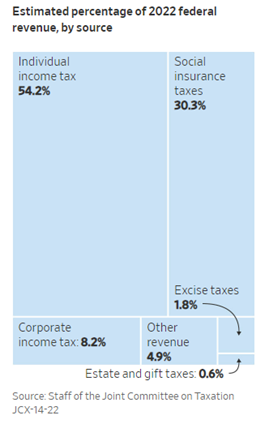
For Tax Day, the WSJ had an interesting breakdown of income, sources, and taxes grouped into categories. Also, see the Graph of the Week below for a breakdown of total tax revenues by source. The article closed with some discussion on recent tax proposals from President Biden; however, in my opinion, with this political backdrop, they are very low probability. Save your time. Hopefully, save your taxes.

Will We Ever See Affordable Housing Prices Again?


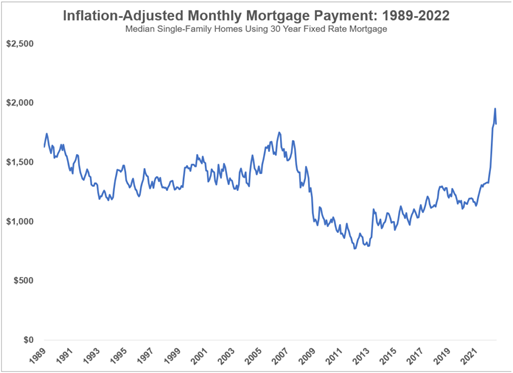
“On the surface, one would assume 6-7% mortgage rates combined with a 50% surge in housing prices in a few short years would lead to a substantial re-rating of housing prices to the downside. The math on housing affordability presents a pretty clear-cut case for much lower housing prices:

And it is true that housing prices are falling in certain areas. But prices are stubbornly resilient in much of the country.


[Fortune’s Lance Lambert] notes that 55% of the 400 biggest housing markets in the country are either back to new all-time high price points or close to it…


There is no blood in the streets just yet.


Here is a snapshot of the current housing market:


  • Prices are about as unaffordable as they’ve ever been from a monthly payment perspective.
  • Housing supply remains constrained because so few people want to move out of their 3% mortgage or buy into a new 7% mortgage.
  • Because supply is so constrained and so many millennials want to buy a house, demand exceeds supply.
  • So prices should be falling more but the demographics of household formation are essentially putting a floor under prices.


This environment can’t last forever. Eventually, people will start to move or rates will come down and inventory will pick up again (I hope). Or if rates stay at 6% or 7%, you would expect prices to slowly grind lower.


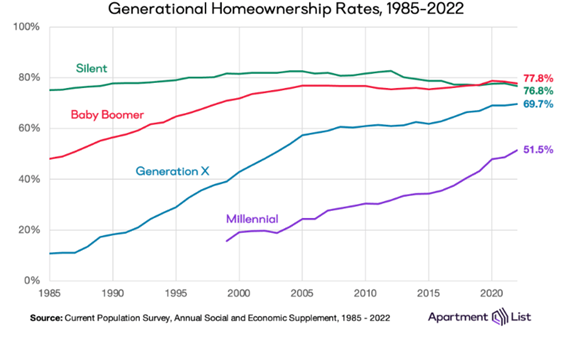
But household formation and demographics are a big reason why housing prices aren’t falling as much as some people would like.


Millennials still have some work to do when it comes to catching up to other generations in terms of homeownership:"

We have a couple of major factors at play in the housing market keeping prices elevated in an environment that otherwise says they should be falling.


1) The jump in interest rates has many homeowners staying in their homes to avoid giving up their low mortgage rates. There is low supply due to fewer existing homeowners “upsizing” and “downsizing”.


2) Millennials (the largest generation group after passing Baby Boomers in 2021) have accumulated assets and want to establish home ownership. However, supply is low with underdevelopment post-2008 housing crash and low existing supply (see point above).

Drumbeat Getting Louder


“The S&P 500 has been holding up quite well as the the nattering nabobs of negativism beat their drums more loudly. Today's batch of economic indicators gave the bears plenty to growl about. Consider the following:


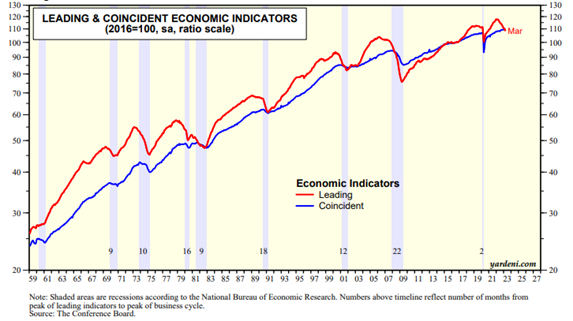
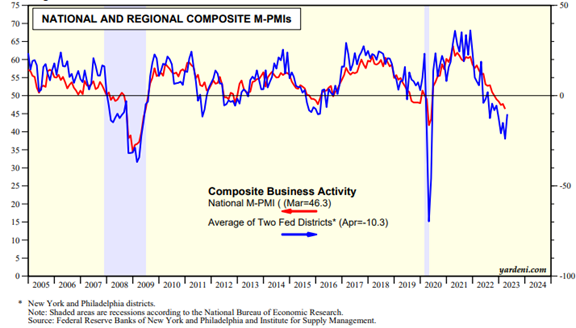
LEI. The Index of Leading Economic Indicators (LEI) peaked at a record high during February 2022 (chart). It's been falling since then. It was down during March of this year by 1.2% to the lowest level since November 2020. A recession should be imminent according to the LEI. Then again, the Index of Coincident Economic Indicators rose to yet another record high in March!

Philly survey. Today's release of the Philly Fed business survey for April was remarkably downbeat. However, on Monday, the NY Fed's business survey for April was surprisingly upbeat. On balance, the average of the two surveys showed an uptick in business conditions this month (chart)…

Jobless claims. Initial claims for state unemployment benefits rose 5,000 to a seasonally adjusted 245,000 for the week ended April 15. That's still a low number, and lots of other indicators show that jobs remain plentiful. The combination of spring breaks and people who have exhausted their severance packages following a rush of layoffs in the technology sector and other areas of the economy sensitive to interest rates, could account for part of the rise in claims last week…


Bottom line. We remain in the soft landing camp and see no reason to join the hard-landers based on this latest batch of economic indicators. So far, stock and bond investors also seem to be in our camp.


Based on these latest numbers we expect the Fed to pause. If the FOMC votes for another 25bps hike in the federal funds rate at the May 2-3 meeting of the committee, Fed Chair Jerome Powell is likely to announce a pause in additional hikes for the time being.”


Dr. Ed Yardeni addresses some recent bearish talking points and pokes some holes in them. His bottom line call is an economic soft landing and slightly bullish market outlook.

Read More
 

Graph of the Week

Most people are shocked at the total share of federal revenues from individual income taxes compared to corporate income taxes – approximately 54.2% vs. 8.2%. Of course, individuals also pay their fair share of state and local taxes as well with sales taxes, property taxes, etc.

Tweet of the Week

Thanks for reading. Have a great weekend!


Guidance for today. Growth for tomorrow.


RBGWA - Logo - Full Color.jpg

Tim Ellis, CPA/PFS, CFP®

CIO and Wealth Advisor

RBG Wealth Advisors

M: 901.682.2431 | C: 662.444.1415

E:  tellis@rbgwa.com

A:  5100 Wheelis Dr., Ste. 300, Memphis, TN 38117

W: rbgwa.com

LinkedIn  Twitter  Facebook

RBG Wealth Advisors LLC is a registered investment adviser. Information presented is for educational purposes only and does not intend to make an offer or solicitation for the sale or purchase of any specific securities, investments, or investment strategies. Investments involve risk and, unless otherwise stated, are not guaranteed. Be sure to first consult with a qualified financial adviser and/or tax professional before implementing any strategy discussed herein. Past performance is not indicative of future performance.