RBGWA - Logo - Full Color.png
 

RBG Wealth Weekly

August 18, 2023


Ladies and gentlemen, the weekend! In this space each week, Greg and I share some of our favorite articles, notes, and graphics from the past week along with our commentary. Please feel free to provide feedback and forward along to others if you enjoy. We appreciate you taking the time to read. 


If you are a client, we truly appreciate your business. If you are not a client, please click below to learn more about our firm and contact us.

Visit our Website
 

Post of the Week

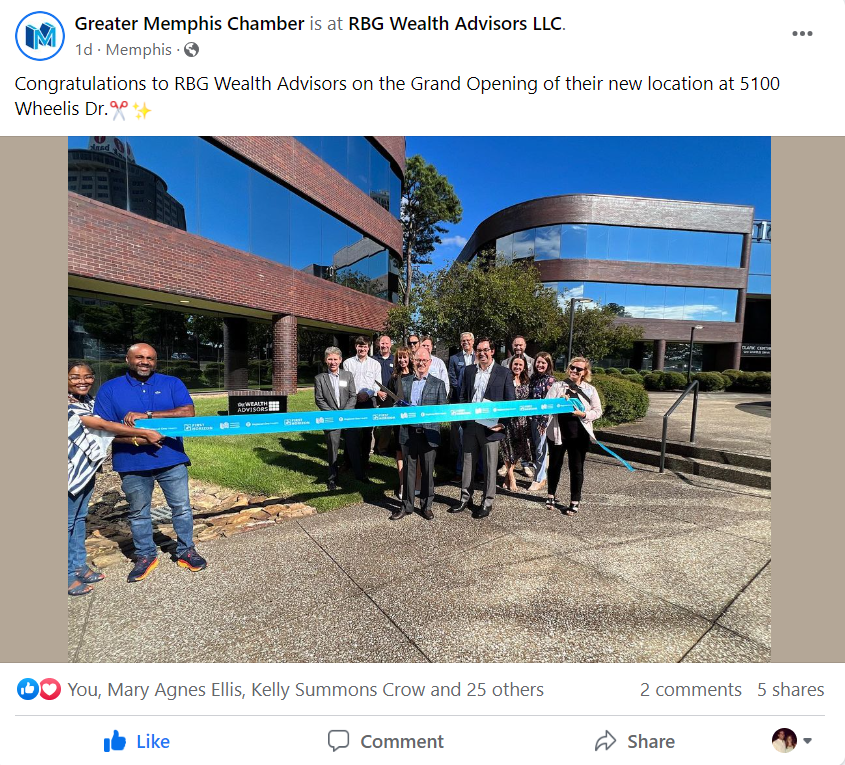
Thank you to the representatives from the Greater Memphis Chamber and all of our guests who could attend this week's ribbon-cutting ceremony and open house event.

Articles of the Week

What is ‘up’ with rates?


“The nominal U.S. 10-year Treasury yield troughed in early April at 3.28% following the peak in regional bank stresses but have since moved higher by almost of full percentage point, settling at ~4.2% at time of writing. In our view, there are several reasons, both fundamental and technical, that have contributed to the move:


1. Still robust incoming data relative to weak leading indicators…


The Conference Board’s Leading Economic Indicators Index, which leads turning points in the business cycle by around 7 months has declined for 15 consecutive months—the longest streak since 2007-08—and is deeply negative year-over-year. Meanwhile, the coincident index has risen 0.6% since the start of the year. To the extent leading indicators are suppressing market forecasts, it’s not surprising we’ve seen an increase in incoming data surprising to the upside relative to expectations, putting upward pressure on yields.


2. Pushing out rate cuts, not pulling forward more hikes…


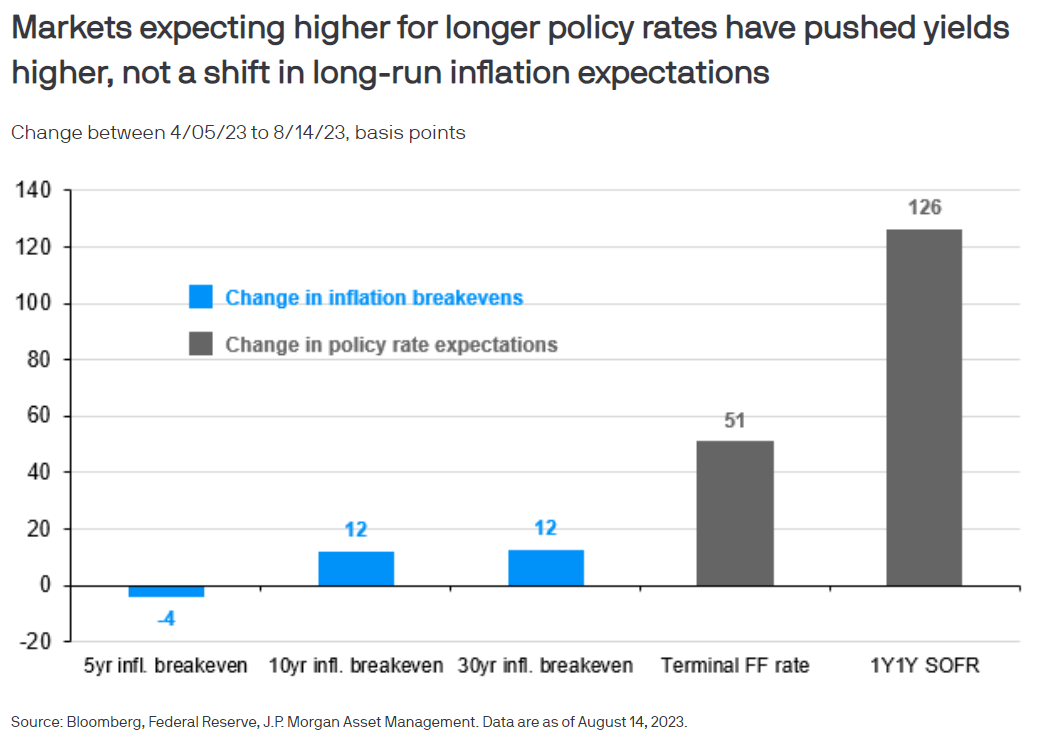
Meanwhile, terminal rate pricing has drifted up by about 50 bps since the beginning of April, with the larger repricing being the 1y1y policy rate which is ~125 bps higher. Essentially, the driver of higher yields particularly in May and June was the market expecting the Fed to keep rates higher for longer, not just more hikes this year.


3. More U.S. Treasury supply…


4. Fitch downgrade of U.S. debt. While a surprise to many, the market reaction of Fitch’s downgrade to of U.S. Treasury debt was short-lived…


We’re likely to stabilize at current levels, followed by cooling inflation and growth dynamics biasing yields lower. Given the level of rates and income bonds now provide, it would benefit investors to leg into duration with yields above 4%.”


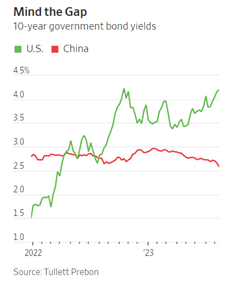
The benchmark 10-year U.S. Treasury interest rate has resumed its rise over the last month including topping 4.3% on Thursday. You must go back more than 15 years to November 2007 to find interest rates that high.


What’s behind the latest upward trend?


In summary, improved prospects for economic growth, shifting Fed policy (i.e., a higher “terminal” rate with no cuts), more Treasury supply, softening demand from foreign investors, and valuations.

The Rasputin Effect: Global resilience to higher rates


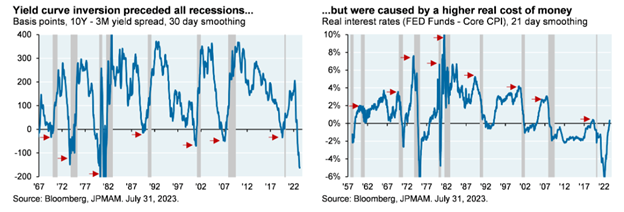
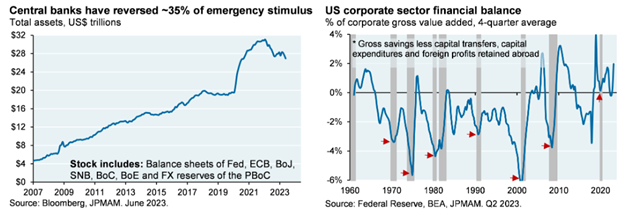
“[1] The “inverted yield curve -> recession” argument is premature. Yes, inverted yield curves tend to precede recessions as shown on the left. But why was it such a consistent signal? Before prior recessions (other than COVID), yield curve inversion reflected policy rates that were restrictive in real terms (i.e., relative to inflation). This time, policy tightening in the US is barely restrictive at all, as shown on the right. And while a simple read of the yield curve points to recession, the health of the US corporate sector does not: the corporate sector financial balance is still in surplus, a condition which has never preceded a recession (see chart below).

[2] Central banks have only removed around one third of the $11 trillion in global liquidity they created in 2020/2021. In other words when considering points #1 and #2, there’s still plenty of liquidity in the system and the cost of money is not prohibitive.”

We’re getting deep in the weeds, but this article from a couple of weeks ago provided more color on the deeply inverted Treasury yield curve. We’ve all been told that it’s a reliable recession indicator. So, why hasn’t it happened yet?


See the chart above labeled “…but were caused by a higher real cost of money”. The Fed has just now gotten to the point of restrictive/tight policy conditions because they were late to start raising rates. If the Fed continues to hike or hold rates here, and core inflation falls, then the economy could be in danger of overshooting the soft landing scenario. 

China’s Economic Woes Are Pushing Its Currency Toward a Record Low


“The People’s Bank of China cut several interest rates on Tuesday, the same day the country released a raft of July data that painted a grim picture of China’s economy. The lowering of interest rates is designed to give the economy a boost, but it is also putting pressure on the currency…


‘The situation is dire,’ said Michelle Lam, a China economist at Société Générale. ‘The pressure on the Chinese yuan will keep lingering if the property sector fails to stabilize, which will weigh on the overall economy and financial stability.’


The country’s housing market is in a yearslong slump, badly hurting confidence in an economy where rising property prices were for many years a key source of wealth. Official data shows home sales are down and prices have been slipping…


China’s exports are shrinking, and consumer prices recently slipped into deflationary territory. Retail sales, industrial production and fixed-asset investment all grew at a slower pace in July than they did a month before. Data for youth unemployment, which hit a record high of 21.3% in June, will no longer be published.


That is putting Beijing in a Catch-22 situation. The central bank is officially committed to using monetary policy to maintain a stable currency value ‘and thereby promote economic growth,’ but at the moment its major policy tool—the level of interest rates—can boost only one side of that equation.”

China has had a slew of poor reports out over the past few weeks. Foreign direct investment is down substantially year-over-year even after they have reopened from COVID-imposed shutdowns; U.S. multinationals noted severe China weakness in earnings reports; and on Friday, real estate development company, Evergrande finally filed for bankruptcy after other major debt restructuring proved unsuccessful.


The world’s 2nd largest economy will likely need to take other measures to course-correct. 

Read More
 

Graph of the Week

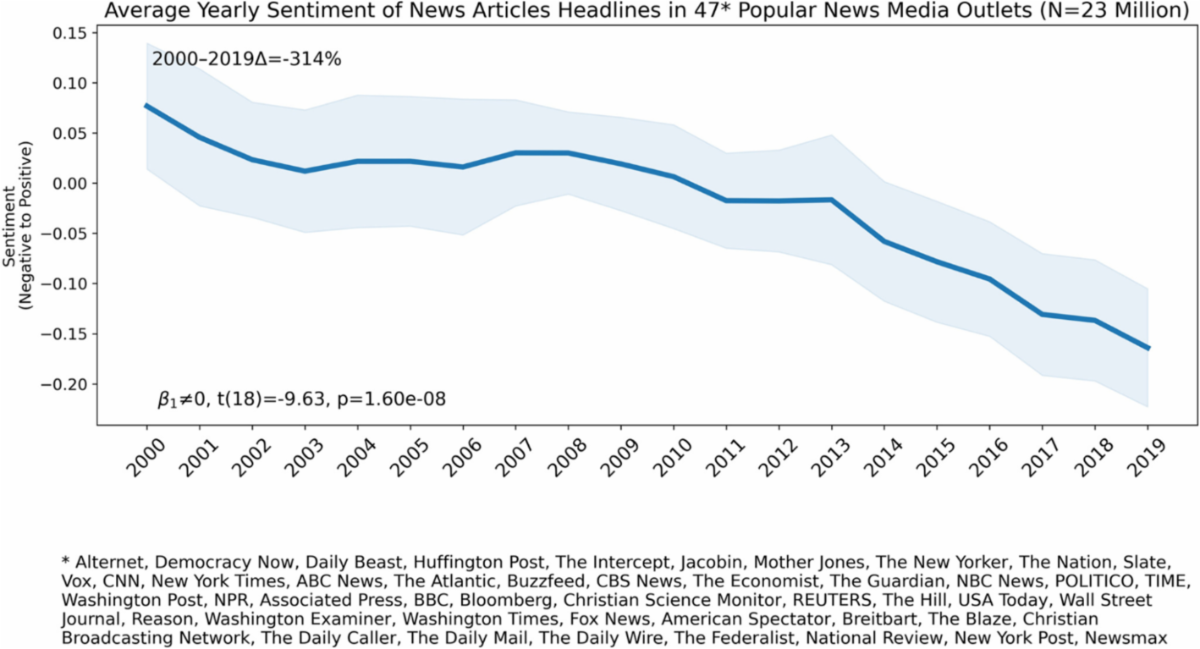
“Ross Mayfield, an investment strategy analyst at Baird, shared some interesting insight on LinkedIn. According to a recent study of article headlines in 47 news media outlets, sentiment has gradually gone from positive to increasingly negative over the past two decades.


‘It’s not that news is inherently bad, and in fact, most programs do a great job informing and educating,’ Mayfield wrote. ‘I’m not anti-media. But over time, and especially in the last decade or so, news has shifted in a way that gives outsized attention to the fear-stoking and anger-provoking.’”


Market and economic news is no exception.

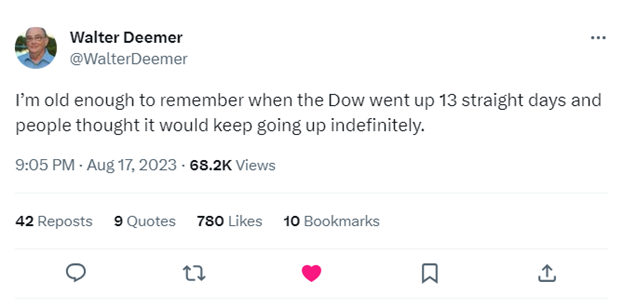
Tweet (or maybe X) of the Week

Thanks for reading. Have a great weekend!


Guidance for today. Growth for tomorrow.


RBGWA - Logo - Full Color.jpg

Tim Ellis, CPA/PFS, CFP®

CIO and Wealth Advisor

RBG Wealth Advisors

O: 901.244.2891 | C: 662.444.1415

E:  tellis@rbgwa.com

A:  5100 Wheelis Dr., Ste. 211, Memphis, TN 38117

W: rbgwa.com

LinkedIn  Twitter  Facebook

RBG Wealth Advisors LLC is a registered investment adviser. Information presented is for educational purposes only and does not intend to make an offer or solicitation for the sale or purchase of any specific securities, investments, or investment strategies. Investments involve risk and, unless otherwise stated, are not guaranteed. Be sure to first consult with a qualified financial adviser and/or tax professional before implementing any strategy discussed herein. Past performance is not indicative of future performance.