RBGWA - Logo - Full Color.png
 

RBG Wealth Weekly

May 12, 2023


Ladies and gentlemen, the weekend! In this space each week, Greg and I share some of our favorite articles, notes, and graphics from the past week along with our commentary. Please feel free to provide feedback and forward along to others if you enjoy. We appreciate you taking the time to read. 


If you are a client, we truly appreciate your business. If you are not a client, please click below to learn more about our firm and contact us.

Visit our Website
 

Articles of the Week

Debt Ceiling Standoff


“The need for a resolution is becoming urgent. Treasury Secretary Janet Yellen told Congress in a May 1st letter that the U.S. could default as soon as June 1st, though her letter indicated that the imprecision of predicting Treasury revenues and outlays could push the default date later into the summer. That uncertainty has made it difficult for Congress to set a real deadline for negotiations…


A default would risk sending short-term yields higher, while riskier assets and the dollar would likely fall. This is the scenario that played out in the 2011 debt ceiling fight, which resulted in the U.S. federal government credit rating being downgraded by several rating agencies, including Standard & Poor's, to below AAA for the first time ever.


If no deal is reached, the Treasury has a couple of options:


1. Technical default. A technical default is defined as an extended period of time of non-payment of interest and principal on the debt…


2. Creative possibilities: Premium bonds/minting a platinum coin/invoking 14th Amendment. Among the more creative suggestions that commentators have made is that the Treasury could issue premium bonds—bonds with higher coupons—that would generate a price that is above par, giving the Treasury more cash. It's not clear how this would work in practical terms. And the Treasury secretary has dismissed the idea…


Clearly there are no good choices for the Treasury. Even if feasible, these creative suggestions may not pass muster in court if challenged.”


Congressional leaders are flirting with the X-date, in which the federal government runs out of funding. If the Treasury makes it to June 15th, 2nd quarter estimated tax payments will likely extend funding into late July.


Most everyone remembers the brinkmanship that occurred around the 2011 debt ceiling. There were contingency plans developed during that period and afterwards that are being recycled to the current day. The Federal Reserve had plans in place then if a technical default were to occur. Under the 2011 plan, the Treasury would have continued to pay interest on Treasury securities, and pay principal by auctioning new securities for the same amount (not increasing the overall debt over the ceiling).


It’s not a base case, but the chance is greater than 0%, especially in this political environment. The more likely case is a short-term deal that coordinates the debt ceiling fight with the federal budget fight – the current federal government fiscal year ends September 30, 2023.

College Prices Aren’t Skyrocketing—But They’re Still Too High for Some


“We need better information regarding college costs that are specific to individuals’ financial circumstances. The focus on sticker prices is perhaps understandable since institutions are required by law to report it annually. Net prices [total less scholarships & aid] are specific to the individual, and generating that information is difficult. Finding better ways to report and track net price is sorely needed…


Net price calculators are a well-intended step in the right direction, but they still have a long way to go. The net price data available at the College Scorecard also fall short. They can give a student some sense of what they might pay, but they do not fully incorporate individual circumstances and some of the data appear to be inaccurate or misleading.


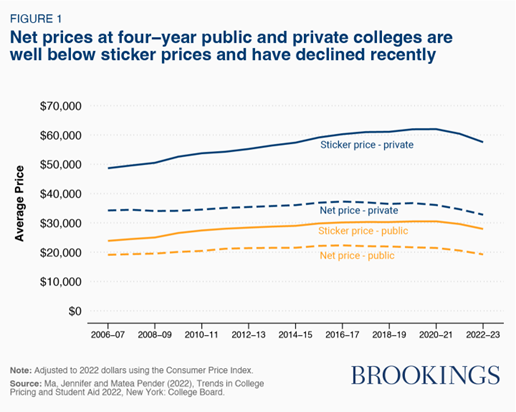
Despite the limitations of the publicly available data, they do provide some useful information on trends in college pricing. For example, Figure 1 shows trends in the average [cost of attendance] and average net price (adjusted for inflation) since 2006-07, separately for public and non-profit private four-year institutions…

Almost a decade ago, I wrote about the work I did at Wellesley College to create a simplified tool to estimate college costs based on families’ basic financial characteristics. That led to the creation of MyinTuition, which provides estimates of what a students’ financial aid award might look like based on data on current students whose families had similar financial characteristics. MyinTuition provides both a best estimate and a 90% confidence interval to convey the uncertainty about the estimate.”


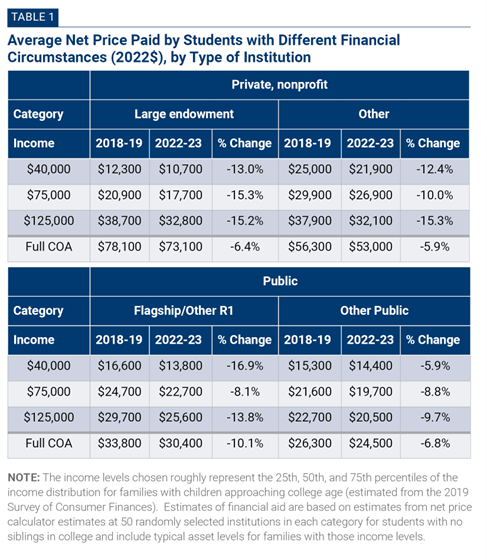
One of the difficulties in planning for college education expenses is the variable nature of the goal expense amount. There’s the college category – in-state public vs. out-of-state public vs. private. There’s the length – 4-year vs. graduate/law/medical school. And, there’s also actual costs – total cost of attendance as stated by the schools vs. net costs which incorporates scholarships, need-based aid, and merit-based aid.


Brookings has good data of gross sticker prices compared to net prices as well as overall trends. In some marginally good news, inflation-adjusted net prices have been falling over the past few years due to post-pandemic attendance and schools’ reticence to try to keep pace with high headline inflation.

3% or Bust

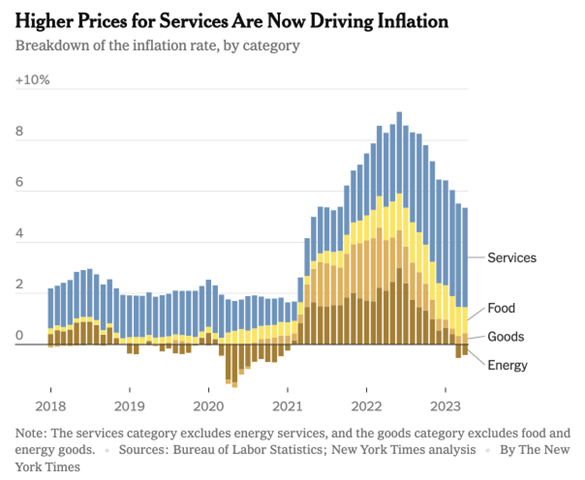
“First, the good news: Consumer Price Index (CPI) came in modest at 0.4%, with a year-over-year print of 4.9%. I love the 4 handle (!) and I expect CPI will continue to fall over the next few months. We are likely to see a 3 handle before Christmas, maybe even around Halloween…


The FOMC’s 2% inflation target was a post-GFC, ZIRP/QE driven creature during a period of slow growth, no wage gains, and zero fiscal stimulus. Post-lockdown, pent-up demand met massive fiscal stimulus — $4 trillion in three CARES acts, an infrastructure and an inflation bill — to create a massive surge of consumer spending. The post-pandemic economy differs significantly from the 2010s.


The old regime of a 2% inflation target is dead.


I would move the goalposts towards a more rational 3% over the next 12 months. To get back to 2% inflation target, the economy would need some combination of ZIRP, or higher unemployment, or more than a mild recession.”


This week brought another mildly positive inflation data release. The Consumer Price Index is officially under 5% and has a chance to meaningfully decrease as May and June 2022 price spikes roll off the data set over the next couple of months.

Read More
 

Graph of the Week

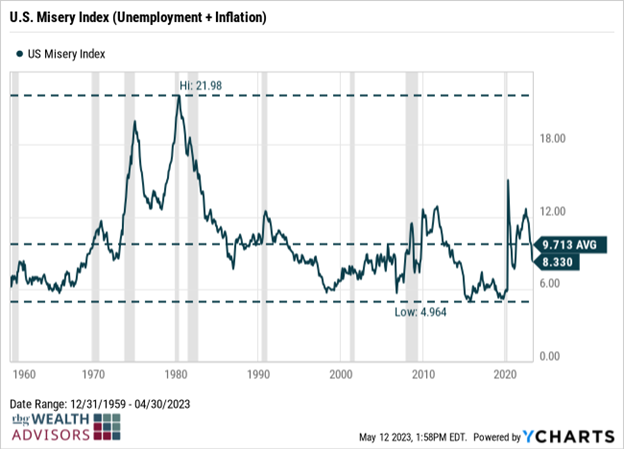
“For fun, here is an update to the graph of economist Arthur Okun's misery index (popularized by President Reagan).


Okun added inflation and the unemployment rate together as a measure of "misery".


Currently [year-over-year] inflation is at 4.9%, and the unemployment rate is at 3.4% for a "misery index" value of 8.3. 


This is down from 8.5 in March, and below the median of 9.6 over the last 50 years.”

Tweet of the Week

Thanks for reading. Have a great weekend!


Guidance for today. Growth for tomorrow.


RBGWA - Logo - Full Color.jpg

Tim Ellis, CPA/PFS, CFP®

CIO and Wealth Advisor

RBG Wealth Advisors

M: 901.682.2431 | C: 662.444.1415

E:  tellis@rbgwa.com

A:  5100 Wheelis Dr., Ste. 300, Memphis, TN 38117

W: rbgwa.com

LinkedIn  Twitter  Facebook

RBG Wealth Advisors LLC is a registered investment adviser. Information presented is for educational purposes only and does not intend to make an offer or solicitation for the sale or purchase of any specific securities, investments, or investment strategies. Investments involve risk and, unless otherwise stated, are not guaranteed. Be sure to first consult with a qualified financial adviser and/or tax professional before implementing any strategy discussed herein. Past performance is not indicative of future performance.