RBGWA - Logo - Full Color.png
 

RBG Wealth Weekly

November 17, 2023


Ladies and gentlemen, the weekend! In this space each week, Greg and I share some of our favorite articles, notes, and graphics from the past week along with our commentary. Please feel free to provide feedback and forward along to others if you enjoy. We appreciate you taking the time to read. 


If you are a client, we truly appreciate your business. If you are not a client, please click below to learn more about our firm and contact us.

Visit our Website
 

Articles of the Week

Cooling Inflation Likely Ends Fed Rate Hikes

Mild October prices report unleashes stock and bond rallies


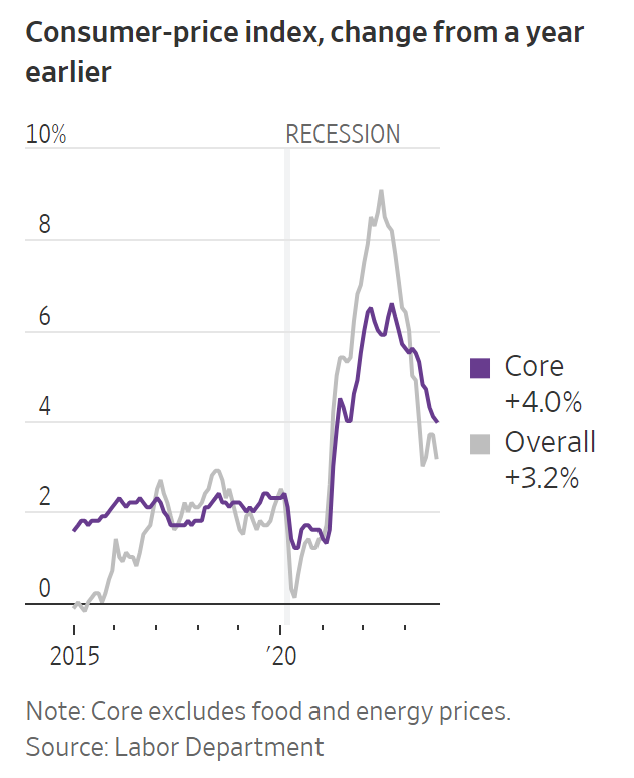
“Consumer prices overall were flat last month and rose 3.2% from a year earlier, a slower pace than in September, the Labor Department said Tuesday. Overall inflation hit a recent peak of 9.1% in June 2022. Increases in so-called core prices, which exclude volatile food and energy items, also showed underlying price pressures are abating. Core inflation for the five months ended in October was at an annual rate of 2.8%, down from 5.1% during the first five months of the year.

The easing reflected lower prices for cars and airfares and milder growth in the cost of housing and other services. Core inflation is often viewed as a better predictor of inflation’s future trajectory than the overall numbers.


‘The hard part of the inflation fight now looks over,’ said David Mericle, chief U.S. economist at Goldman Sachs.


Stocks and government bonds soared as investors concluded the Fed was done raising rates and shifted attention to when officials might begin cutting rates. 


The Nasdaq closed up 2.4%, while the S&P 500 rose 1.9%, the biggest one-day jumps for both since April. The Dow Jones Industrial Average added nearly 500 points, or 1.4%.


Yields fell sharply across Treasurys, with the benchmark 10-year note declining 0.191 percentage point to 4.440% on Tuesday. That was the largest single-day decline since Silicon Valley Bank failed in March. Yields fall as bond prices rise.”


The stock market loves disinflation data, and we got more of it on Tuesday with October’s Consumer Price Index. Both headline and core CPI came in lower than expected at 3.2% and 4.0% respectively. It’s still higher than the Fed’s 2% target, but the trend is important.


I will pump the brakes and note that disinflation is not deflation. Prices will remain permanently higher than their pre-COVID level. For example, food prices have risen 39 months in a row and are up 24% since pre-COVID, largely due to the significant money printing over the last few years.


Back to the good news - market expectations for further interest rate increases are basically dead. Per the CME Group’s futures pricing data, we have gone from a 42.5% likelihood of at least another 0.25% increase one month ago to 0% today!

Not That 70’s Show


“Of ~20 post-WWII geopolitical events, only the Arab-Israeli War of 1973 ended up being a primary driver of equity markets 6-9 months later due to an oil embargo, three years of US wage and price controls and stagflation. And in 2018 when we examined different market indicators to see which were most useful for investors, a Geopolitical Risk Index came in last since equity market returns weren’t that different whether geopolitical risk levels were high or low, or rising or falling…


[1] Will the Middle East War cause oil and inflation to surge and equities to collapse, as in the 1970s?


Given what is now taking place, are market risks similar to those in the 1970’s? Oil markets are priced globally, so any sustained rise in oil prices would affect US energy prices and core inflation a few months later. However, energy risks to the US are generally much lower than in the 1970’s, with some caveats (in red):

  • The US is a net energy exporter vs its net import position in the 1970’s; US net crude imports are down 75% from their 2005 peak, and net refined product imports of 4 [million barrels per day] flipped to net exports of 4 [millions barrels per day]
  • The oil intensity of US GDP growth is 65% lower than it was in the 1970’s.
  • Annual global oil consumption growth has declined from 8%-10% in the early 1970’s to 0%-2% today.
  • Geopolitical benefits to OPEC of an oil embargo would be less clear now: 75% of Saudi oil exports go to Asia, China gets half its oil from the Middle East and the US gets most of its imported oil from Canada, Mexico, and other non-OPEC sources [Source: Gavekal Research]
  • Saudi Arabia also has spare capacity to bring online if needed.
  • US oil production is at new highs but is more a function of drilled/uncompleted wells coming online than new projects. As shown below, global capital spending on new projects by public energy companies has declined before a downshift in oil/gas consumption, setting the stage for well-supported energy prices outside of recessions. Similarly, the global oil & gas rig count is at the low end of its non-recessionary range.
  • The Biden Administration, in an act of geopolitical malpractice, opted not to refill the Strategic Petroleum Reserve before the conflict erupted; the SPR is down ~50% from its peak and at its lowest level since 1983.”

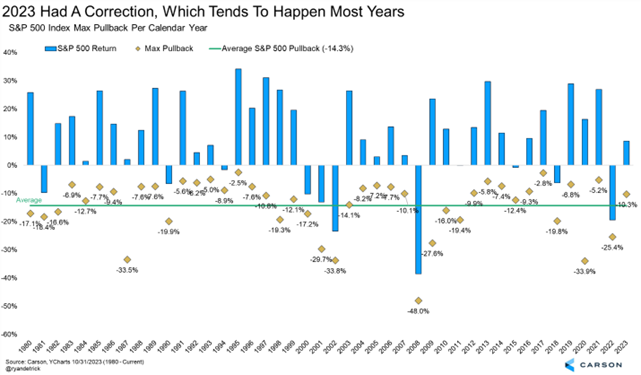
This was an interesting thought exercise that has been a concern for many people in the aftermath of the Israel-Hamas conflict. Although geopolitical conflicts rarely register in any meaningful way to equity markets, could the war impact oil prices and markets similar to the 1970’s?


As you can probably imagine, the sector composition of equity markets has changed considerably since the 1970’s – less energy and industrials and the rise of technology, consumer discretionary, and communication services - as well as the GDP composition of the economy. Michael also walks through the changes in oil production, the shift to net exporter status, and other factors over time.

Giving strategies: Five actions for year-end 2023


“A checklist to help you increase impact and reduce taxes…


1. Determine how tax benefits can help you support your goals or increase your impact.


An important first step in creating a year-end giving plan is to review the basic tax benefits or incentives available to you. The first benefit is the charitable deduction, which can reduce your taxable income if you itemize…


Your instinct may be to donate cash, but donations of appreciated non-cash assets held more than one year can help you give even more to charity in two ways: 


First, regardless of whether you itemize deductions or take the standard deduction, you potentially eliminate the capital gains tax you would incur if you sold the asset first and donated the proceeds. This may increase your amount available for charity by up to 20%.


Second, you may generally claim a charitable deduction for the fair market value of the asset, if you itemize, and may choose to pass on that income tax savings in the form of more giving…


Finally, if you are age 70½ and older and have a traditional IRA, you can consider a special tax benefit available with your account: directing up to $100,000 of Qualified Charitable Distributions (QCDs) in 2023 to operating charities (excluding donor-advised funds) tax-free. While withdrawals from traditional IRAs are taxable income, QCDs are not…


2. Consider bunching gifts to hurdle the 2023 standard deduction…


Another important consideration is whether you plan to itemize or take the standard deduction.


For 2023, the standard deduction is $13,850 for single filers and $27,700 for married couples filing jointly. There also is an additional standard deduction for being age 65 or older or blind: $1,850 if your filing status is single, and $1,500 per person if your status is married filing jointly.


If your total itemized deductions are below those amounts, you may find it beneficial to ‘bunch’ your 2023 and 2024 charitable donations together in 2023 to exceed your 2023 standard deduction. You could then itemize deductions on your 2023 tax return and take the standard deduction for 2024 taxes.”


We’re easing into the home stretch of the (tax) year, and a good time to consider charitable giving strategies. This was a good practical list of actionable strategies and benefits to consider.

Read More
 

Graph of the Week

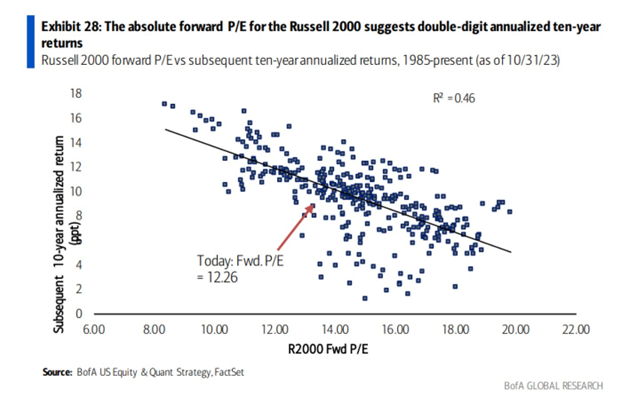
"Over the next decade, the Russell 2000’s price per earnings ratio implies a 12% annualized return, versus a 7% gain per annum for the Russell 1000, the analysts noted."


Small cap stocks (and mid caps to a lesser degree) have been priced for recession. As interest rates have shown some signs of subsiding this week, small caps outperformed large caps by more than 3%. There is plenty of room left for that trade to play out.

Tweet (or maybe X) of the Week

Thanks for reading. Have a great weekend!


Guidance for today. Growth for tomorrow.


RBGWA - Logo - Full Color.jpg

Tim Ellis, CPA/PFS, CFP®

CIO and Wealth Advisor

RBG Wealth Advisors

O: 901.244.2891 | C: 662.444.1415

E:  tellis@rbgwa.com

A:  5100 Wheelis Dr., Ste. 211, Memphis, TN 38117

W: rbgwa.com

LinkedIn  Twitter  Facebook

RBG Wealth Advisors LLC is a registered investment adviser. Information presented is for educational purposes only and does not intend to make an offer or solicitation for the sale or purchase of any specific securities, investments, or investment strategies. Investments involve risk and, unless otherwise stated, are not guaranteed. Be sure to first consult with a qualified financial adviser and/or tax professional before implementing any strategy discussed herein. Past performance is not indicative of future performance.