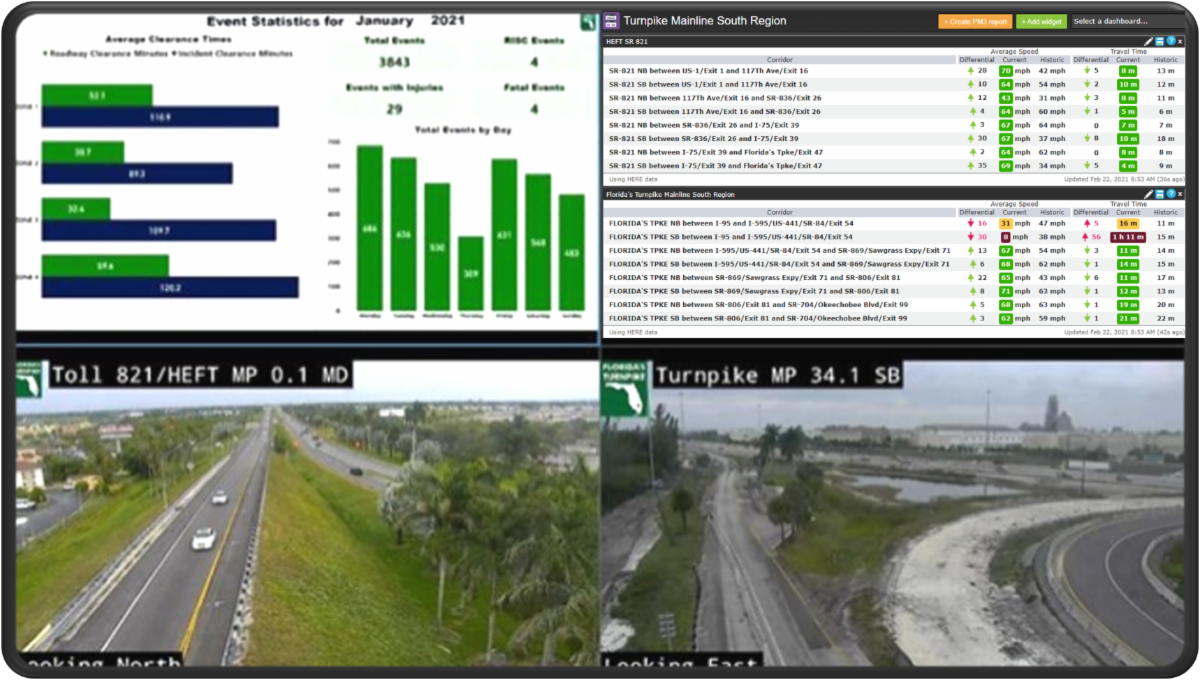
It took a single training session on the use of the Dashboard tool within Probe Data Analytics for Florida's Turnpike to see the value of deploying their own Speed and Travel Time Dashboards within their operations center. The above image is courtesy of Florida's Turnpike and illustrates how the operations center has integrated PDA Dashboards with other meaningful situational awareness data points onto their video walls. The real-time speed and travel time dashboard delivers timely insights to critical issues that may arise across Florida's Turnpike.Explore how your agency can create its own Speed and Travel time dashboard and other operational insights by watching this video tutorial from the CATT Lab.
Several member agencies, with the assistance of the Eastern Transportation Coalition, are developing a new RITIS Enhancement User Group. The intention of this new group is to create a nimble team that is able to pool resources to expedite desired enhancements to RITIS. By working through the Eastern Transportation Coalition, the new group hopes to take advantage of a large pool of active RITIS users and aggressively pursue enhancements for the TSMO community. For more information about this initiative, please contact Matter Glasser(Georgia DOT).
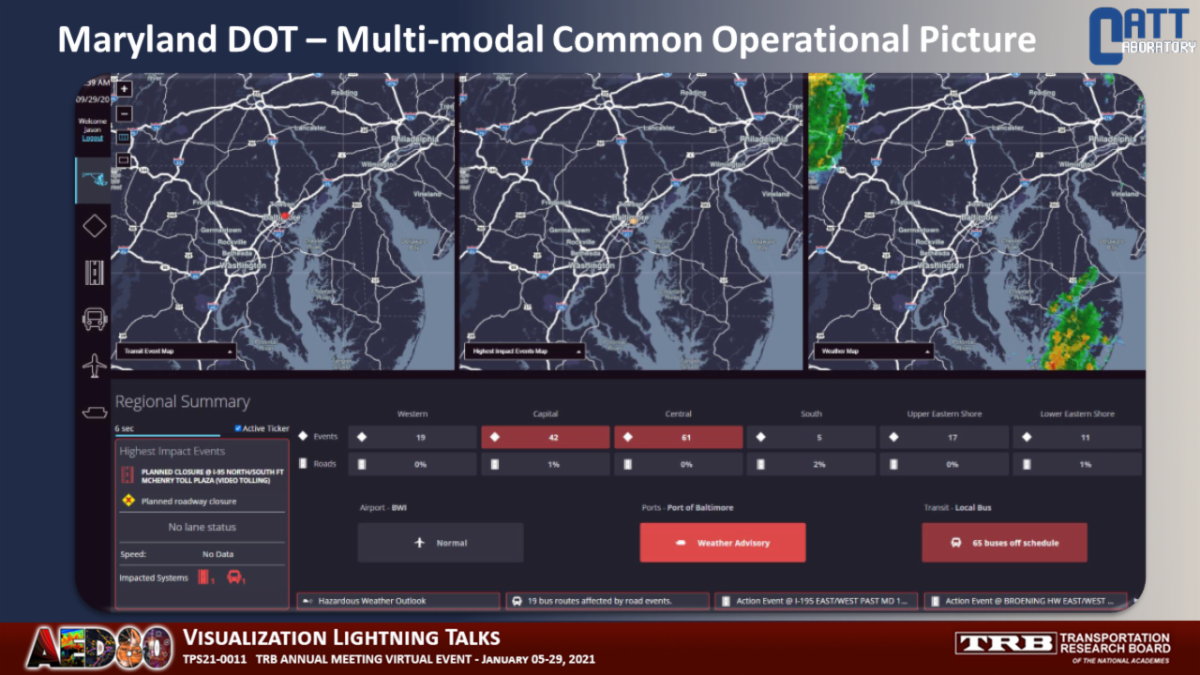
Working with the Maryland Department of Transportation, the CATT Lab developed a first-of-its-kind real-time multi-modal common operational picture dashboard for the state of Maryland. This COP provides real-time metrics and data visualizations on each of Maryland’s transportation business unit modes, including roadways, aviation, transit, and port operations. The COP provides compelling visualizations of performance for each mode by comparing real-time information to historical data. Within each mode, the user can drill down to get more detailed information on the locations and events that are negatively impacting modal performance. Check out some of the capabilities of this unique real-time dashboard in a recent TRB lightning talk.
For more information about how your state might deploy a similar real-time multi-modal dashboard, please contact Michael Pack.
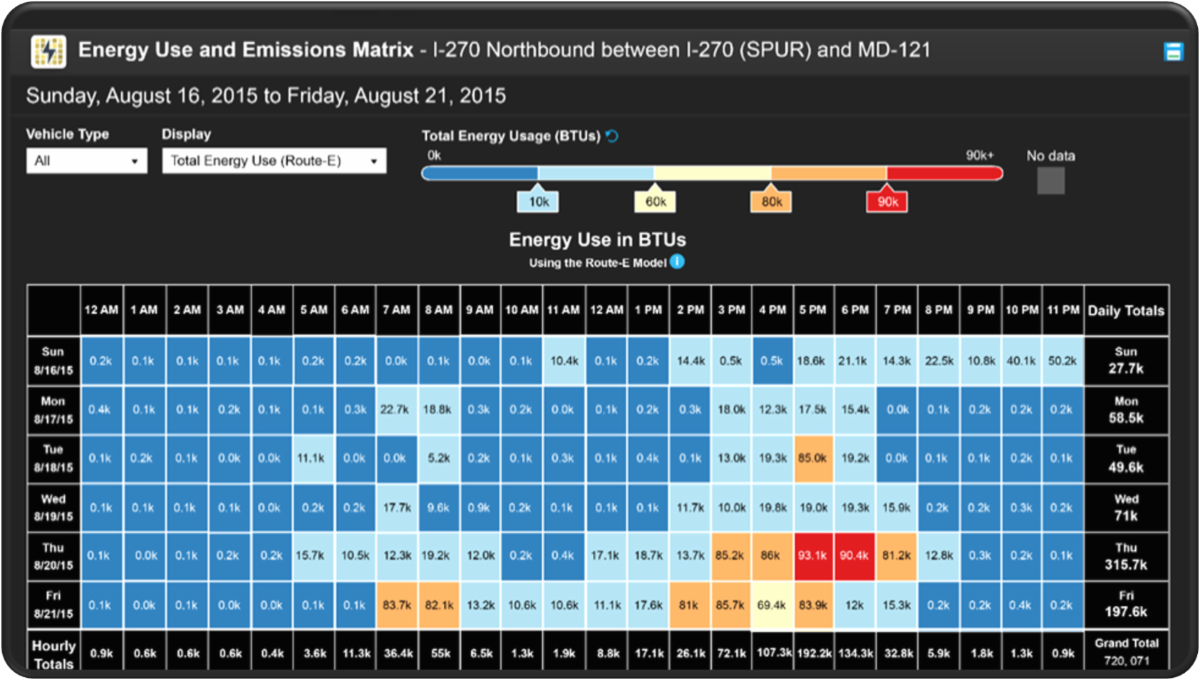
The investment decisions within the nation’s transportation sector have traditionally been prioritized and measured against safety and travel efficiency goals. With a new administration in place, there are increasing demands to consider energy use and emissions in the design of our transportation infrastructure. The CATT Lab, the Maryland Transportation Institute (MTI) at the University of Maryland (UMD) in partnership with the National Renewable Energy Laboratory (NREL), have developed a Transportation Energy Analytics Dashboard, or TEAD, to raise awareness of the energy and emission impacts to the same level of observability as that of safety and mobility concerns. The news tools, which were rolled out to two regions of the country, help MPOs better understand climate-based energy measures:
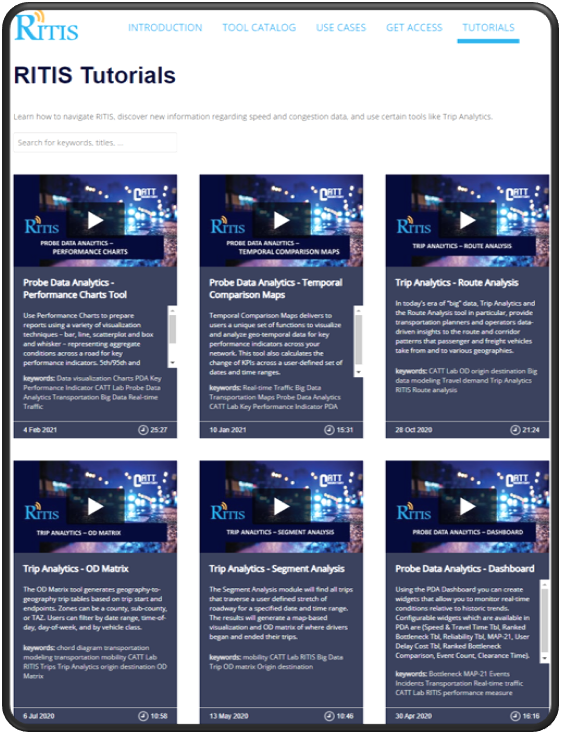
The CATT Lab team regularly deploys improvements, new features, and bug fixes, thanks to feedback from our user community. Check out a few of our new video tutorials as well.