|
Let’s have a conversation about the ‘P’ word…
… perspiration, or perspicacity? No... productivity.
Do we understand it?
The ONS measures public-service productivity differently from the private sector. Creating distortions.
Private sector productivity, typically measured as;
(output ÷ input) = (value of goods/services sold) ÷ labour and capital used.
Output is monetised… prices and profits capture improvements in quality, efficiency and innovation.
NHS productivity is harder to measure… no market prices.
Hence, the ONS estimates output, based only on the volume and quality.
Historically, the ONS treated NHS outputs as equal to inputs. Meaning, productivity was flat. Only in 2005, quality-adjustments were added but…
… the system still under-represents innovation and efficiency. Especially where improvements are qualitative;
- better care,
- prevention,
- digital access,
- integration.
The upshot? Services look stagnant. Even when they’re delivering more, better or smarter.
A nurse using digital-tools; managing twice as many patients may not be counted as twice as productive if the output metric doesn’t reflect changes in outcomes.
Timeframes distort NHS productivity data because much NHS activity is;
- prevention,
- early diagnosis,
- rehabilitation,
- chronic disease management…
… producing benefits far beyond the accounting year.
Smoking cessation for instance, may reduce cancer and COPD admissions decades later. In the short term? It shows as extra spending.
It’s the productivity-paradox of prevention…
… preventive and community care can reduce hospital demand but the productivity metric sees fewer outputs… fewer operations, fewer bed days.
Paradoxically, the better the NHS performs in prevention, the less productive it looks.
Interventions like diabetes control, child health, or mental health only demonstrate measurable outcome gains after long follow-up periods.
The ONS’s annual window can’t account for these longitudinal returns...
… it’s called a delayed-feedback-loop.
It’s also why politicians rarely invest in anything that shows benefits emerging beyond the length of a parliament.
More sinister… the political manipulation of these figures can make public services appear less efficient and more ripe for privatisation.
As case-mix gets older and sicker, input costs rise faster than output volumes, even if the system is working harder and smarter.
If the NHS helps old geezers like me to live longer, it looks less efficient. Pharmacy cost rocket, diagnostics shoot up, visits to hospital and the GP, multiply... the data looks like the NHS is inefficient. I become a cost centre.
Annual productivity measures conflate effort with inefficiency.
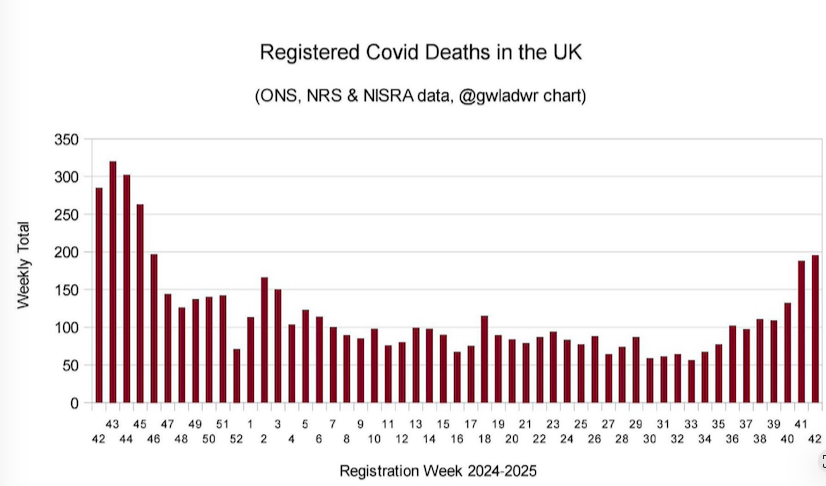
In fairness, there's the ONS’s long-run NHS productivity index (which no one ever references) which strikes me as a fudge. Everything distorted by Covid and the subsequent impact (See Para 4), but does highlight;
-
Reduced Patient Flow… delays in discharging medically fit patients due to lack of social care capacity
-
Increased Patient Complexity
-
High rates of staff sickness, turnover of experienced staff and agency staff with less discretionary effort.
-
Insufficient Capital Investment.
-
New infection control measures and still a focus on Covid related activities, meaning additional inputs.
-
Industrial Action
And…
… there's something no one ever talks about...
...school holidays.
Roughly 74% of the NHS workforce is female, many with caring responsibilities. Some schools have just arbitrarily, extend their half-term to two weeks.
This isn’t just a calendar change… it’s an NHS workforce event.
Parenting staff must take annual leave, unpaid leave, or scramble for childcare with escalating costs.
NHS productivity has to absorb these micro-shocks.
Disruptive school holidays don’t show up in national productivity tables. Yet, the impact is a hidden drag on NHS output that formal statistics rarely capture plus the cost of replacement staff.
Gold standard employers could create;
-
Flexible working options
-
Childcare hubs and holiday club partnerships
-
Predictive, staffing modelling
-
Bank staff incentives, targeted to specific holiday weeks rather than blanket premiums
-
Vouchers for low-paid staff to access holiday childcare
-
Childcare signposting to local holiday childcare and benefits entitlements
The broader point is that productivity cannot be separated from the lived experience of staff.
By ignoring these human rhythms, productivity metrics risk being not just blunt, but misleading.
Are there better ways to measure NHS productivity? Yup;
-
Measure outputs in terms of health outcomes, QALYs, wellbeing. Not just volumes.
Include preventive gains… reduced admissions from community care, digital triage across primary, community, and hospital.
-
Generate live performance data… AI-assisted analysis of throughput, workforce deployment, and outcomes. This would vastly improve timeliness and responsiveness compared to the current ONS approach, which lags by around a year.
-
Capture broader economic and social value… enabling people to return to work, reducing social care and benefits demand. Improving mental health. Align with Treasury wellbeing economy metrics, that are being tested.
-
Compare productivity internally… between trusts or regions … use quality-adjusted, real-time data.
We can all see the effort that goes in to the working day...
... but we all can be blinded by the data that shows us very little of the reality.
|