Greetings!
We hope this email finds you well. In the previous newsletters, we have discussed:
We are excited to introduce another powerful problem-solving technique - Fishbone Analysis, also known as the Ishikawa diagram or cause-and-effect diagram. This method enables us to identify and visualize the potential causes of a specific problem or event, facilitating effective decision-making and problem-resolution.
Fishbone analysis, also known as the Ishikawa diagram or cause-and-effect diagram, is a problem-solving technique used to identify and visualize the potential causes of a specific problem or event. It was developed by Japanese quality control expert Kaoru Ishikawa.
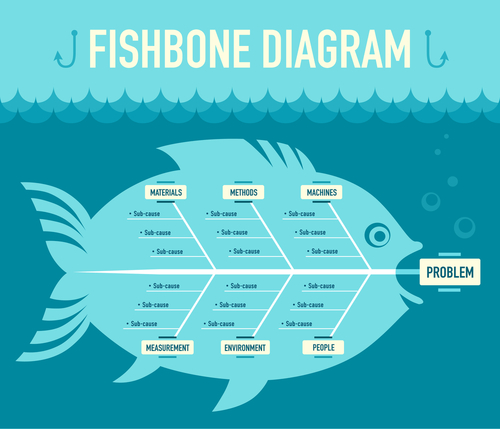
The Fishbone analysis derives its name from its visual representation, which resembles the skeleton of a fish. The "head" of the fish represents the problem or effect being studied, and the "bones" represent the various categories of potential causes.
These categories are typically identified as the 6 M's: Manpower (people), Methods (processes), Materials, Machines, Measurements, and Mother Nature (environmental factors).
To conduct a Fishbone analysis, a team gathers and brainstorms all possible causes related to each category. These causes are then subcategorized to provide a more detailed understanding of the factors contributing to the problem. The resulting diagram helps to visualize the potential causes and relationships among them.
The Fishbone analysis is often used in quality management, process improvement, and root cause analysis. It provides a structured approach to problem-solving and facilitates team collaboration by encouraging diverse perspectives and identifying the most likely causes. Once the causes are identified, the team can focus on addressing the root causes rather than just treating the symptoms, leading to more effective problem resolution and preventive measures.
To effectively use Fishbone analysis, follow these steps:
1. Define the problem: Clearly articulate the problem or effect you want to analyze. This will serve as the "head" of the fishbone diagram.
2. Identify major categories: Determine the main categories or factors that could contribute to the problem. These are typically the 6 M's: Manpower, Methods, Materials, Machines, Measurements, and Mother Nature. Customize these categories based on the specific context of your problem.
3. Brainstorm potential causes: Assemble a team of individuals with diverse perspectives and knowledge related to the problem. Conduct a brainstorming session to generate potential causes within each category. Encourage everyone to contribute ideas freely and without judgment.
4. Create the Fishbone diagram: Draw the Fishbone diagram using the problem statement as the "head" and the identified categories as the "bones." Connect each category to the main line of the diagram. Subdivide each category further, adding branches or sub-bones to represent the potential causes. Continue breaking down the causes until you reach a sufficient level of detail.
5. Analyze and prioritize causes: Review the identified causes on the Fishbone diagram. Evaluate the potential impact and likelihood of each cause. Prioritize the causes that seem most plausible or significant. This can be done through discussion, voting, or other consensus-building techniques.
6. Validate causes: Once you have identified the most likely causes, gather additional data or evidence to validate their significance. This may involve conducting experiments, collecting measurements, or analyzing historical data. The goal is to confirm or refute the potential causes and narrow down the list.
7. Develop solutions: Based on the validated causes, brainstorm and develop potential solutions or countermeasures for each cause. Consider addressing the root causes rather than just treating the symptoms. Encourage creative thinking and explore different options.
8. Implement and monitor: Select the most appropriate solutions and implement them. Monitor the results to evaluate the effectiveness of the implemented solutions. If necessary, make adjustments or further iterations to achieve the desired outcome.
Remember that Fishbone analysis is a collaborative process, so involve team members and stakeholders throughout the process. It helps to have a facilitator who can guide the brainstorming session, keep the discussion focused, and ensure everyone's input is heard.
A common problem in Fishbone Analysis:
A common problem in Fishbone Analysis is that we identified a large number of potential causes during the Fishbone analysis, and lost focus on the major issues.
In QIT, we develop the following steps to help our clients prioritize the causes and focus on the business-critical objectives - Risk and Cost.
1. Prioritize the causes: Review the list of potential causes and prioritize them based on their potential risk and cost.
Risk: Risk Priority Number RPN is a numerical value assigned to each potential cause based on its severity, occurrence likelihood, and detectability. These factors help quantify the risk associated with each cause. By multiplying the severity, occurrence, and detectability scores (on a scale of 1 to 10), we calculate the RPN for each cause. Higher RPN values indicate causes with greater potential impact and should be prioritized accordingly.
Cost: Cost analysis involves assessing the financial implications associated with each cause. It considers factors such as direct costs (e.g., material costs, labor costs) and indirect costs (e.g., production downtime, customer dissatisfaction). By quantifying the cost implications, we can prioritize causes that have the highest cost impact.
2. Focus on the HIGH-COST and HIGH-RISK causes
A. analyze cause interrelationships: Examine the relationships between the potential causes. Some causes may be more fundamental and can lead to multiple other causes. Look for common threads or underlying causes that could be addressed to eliminate or mitigate multiple issues simultaneously. By addressing these key root causes, you can have a significant impact on multiple related problems.
B. Gather additional data: If you are uncertain about the impact or validity of certain causes, gather more data or evidence to support or refute them. This can involve conducting experiments, collecting measurements, or seeking input from subject matter experts. By obtaining more information, you can make more informed decisions about which causes to prioritize.
C. Seek expert opinions: Consult with subject matter experts or individuals who have in-depth knowledge of the problem domain. They can provide insights and help identify the most critical causes. Their expertise and experience can assist in focusing on the major issues and distinguishing between significant causes and minor ones.
D. Use decision-making techniques: If you have a large number of potential causes and find it challenging to prioritize them, you can employ decision-making techniques such as multi-criteria decision analysis or decision matrices. These methods allow you to assign weights or scores to different criteria (e.g., impact, likelihood, feasibility) and objectively compare and rank the potential causes based on their overall evaluation.
E. Break down causes into sub-causes: If a particular category or cause appears too broad and encompasses numerous potential causes, consider breaking it down further into sub-causes. This can help you dissect the problem into more manageable components and identify the key factors within that category that require immediate attention.
Remember that the goal is to identify the most significant causes that have the greatest impact on the problem - which are high-risk and high-cost.
By prioritizing and focusing on these major issues, you can allocate your resources and efforts more effectively toward finding solutions and resolving the problem.
QIT's CAPA/RCA Program is developed based on this principle, utilizing the Fishbone Analysis and using RPN and cost as indexes to help users focus on the business objectives.
Download the free instruction below to see how to use Fishbone Analysis in our program. Or, simply try the program to experience the benefits yourself.