This Week's Water Conditions Update

July 24, 2025

Water Conditions Tracker

Lake Okeechobee Levels & Caloosahatchee Flow Impacts

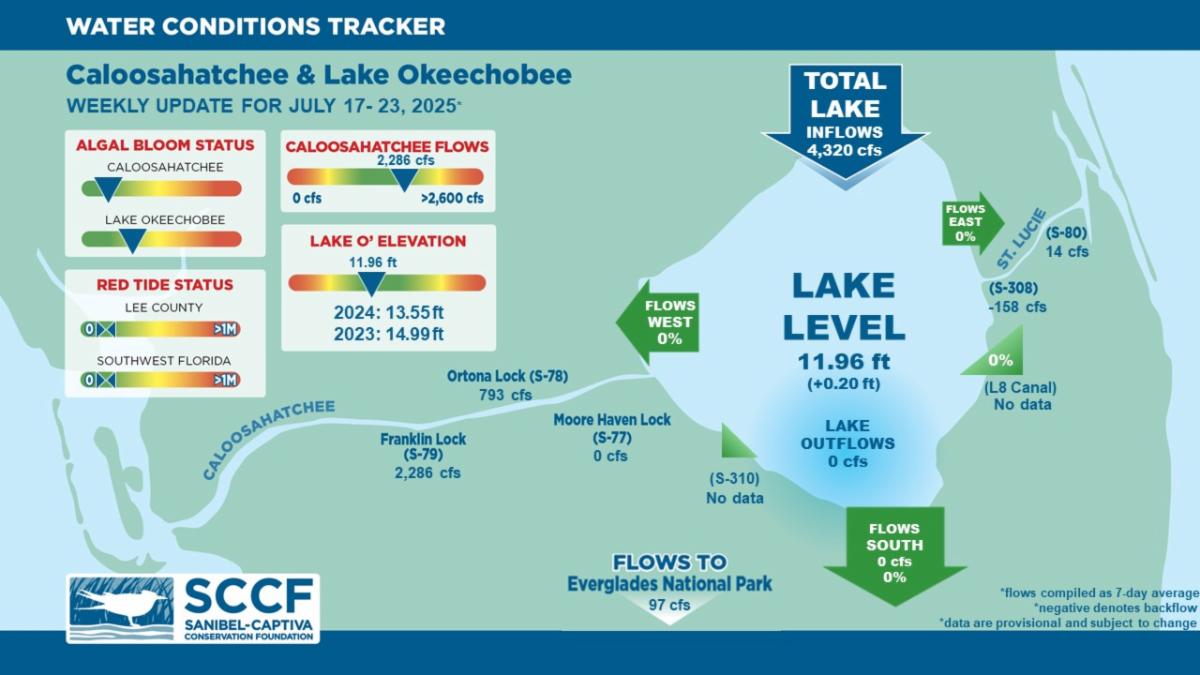
On 7/23/25 Lake Okeechobee was at 11.96 feet, increasing by 0.20 feet in the past week. The weekly average flow at S-79 was 2,286 cfs (cubic feet per second) and flow from the Lake at S-77 was an average of 0 cfs. The 14-day average flow at S-77 was 0 cfs. The 14-day average flow at S-79 was 2,409 cfs and has been in the stress flow envelope (2,100- 2,600 cfs; RECOVER 2020) for 7 days.

For more information on Lake Okeechobee and estuary conditions go to the latest Caloosahatchee Conditions Report.

Water Surface Temperature

This Week

Daily Average for July 23, 2025


Gulf of Mexico: 87.6°F

Caloosahatchee (Beautiful Island): 87.7°F

Lake Okeechobee (Polesout3s): NA; Temp. on 7/22 was 85.9°F

Last Week

Daily Average for July 16, 2025


Gulf of Mexico: 87.0°F

Caloosahatchee (Beautiful Island): 86.6°F

Lake Okeechobee (Polesout3s): 84.1°F


Wet Season Is Here: Sanibel is Less Salty and Water Levels Are Higher

SCCF's Marine Lab reports that the onset of the wet season has helped refresh inland water bodies, but they are still quite salty. Following this year's dry season, which was fairly dry, inland waterbodies on Sanibel did not receive much relief from the three storm surges in 2024.

Weekly Rainfall Totals

WP Franklin (S-79): 1.81" Ortona (S-78): 2.27" Julian Keen Jr. (S-77): 0.87"

Virtual Water Quality Tour from Lighthouse Beach Park

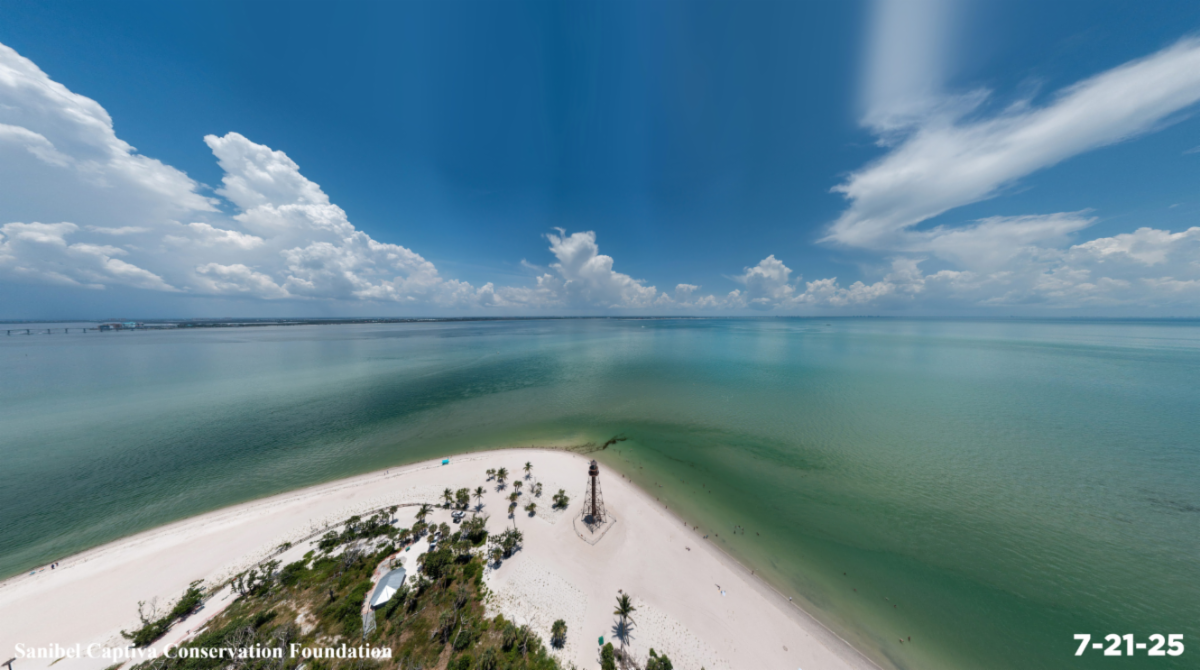
Click here or on the image above to take a virtual tour from above Lighthouse Beach Park to see how the water looked this week. Photo was taken on 7/21/25 at 1:42 PM on a falling tide (1.3 ft). The 14-day average flow at S-79 was 2,459 cfs.

Red Tide

On 7/18/25, the FWC reported that the red tide organism, Karenia brevis, was not observed in samples collected statewide.

Blue-Green Algae

On 7/21/25, sampling for cyanobacteria by the Lee County Environmental Lab reported Microcystis and cyano filaments as present at the Alva Boat Ramp, appearing as sparse, light streaks. 

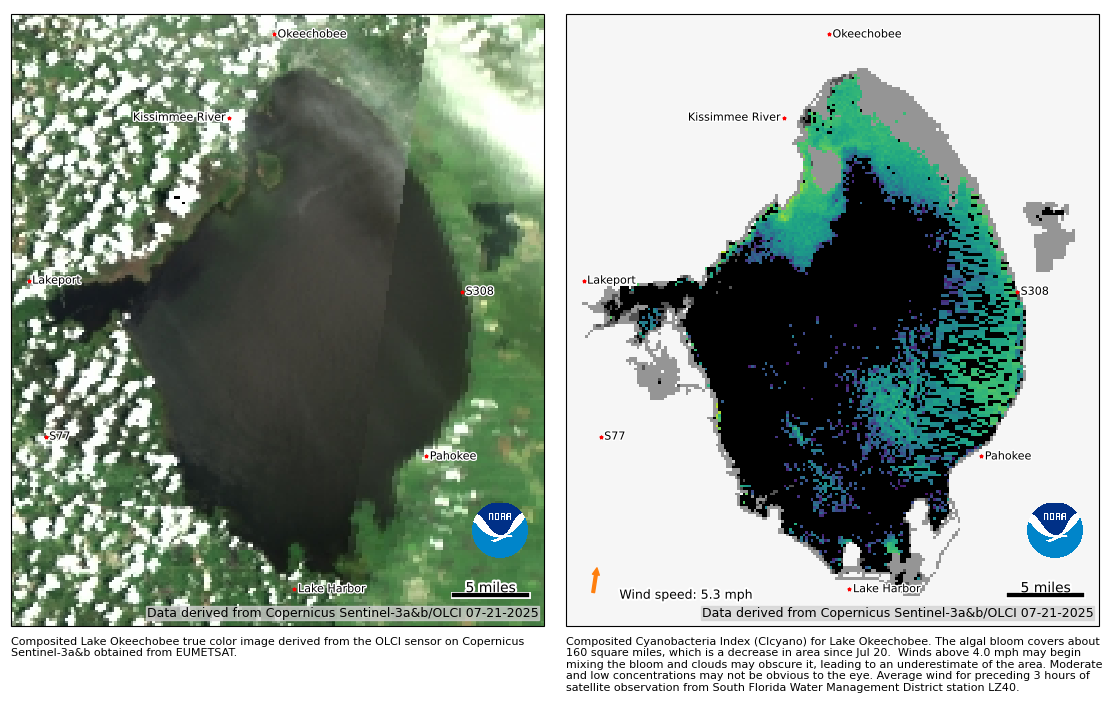
On 7/21/25, satellite imagery of Lake Okeechobee showed the presence of an algal bloom covering about 160 miles, or 34% of the lake.

Become a Citizen Scientist and Get the Algae Reporting App Today!

SCCF wants to know when and where all types of algae sightings occur to monitor conditions around the islands and to investigate algae bloom occurrence with patterns in seasonal weather changes and Lake Okeechobee water management practices.


Click on and bookmark this link to report an algal bloom sighting.

Resources To Follow:

To learn more about our current water conditions, click on the following links:


Water Quality Dashboard


Water Quality FAQ

Find answers to some of our most commonly asked questions regarding water quality and more.


Water Conditions Update Archive


Caloosahatchee Conditions Report

A collaborative, weekly analysis, including recommendations for water managers regarding Lake Okeechobee flows.


RECON

SCCF's River, Estuary, and Coastal Observing Network is a network of eight optical water quality sensors deployed throughout the Caloosahatchee and the Pine Island Sound estuary to provide real-time water quality data.


Caloosahatchee River Virtual Tour


Red Tide Resources


NOAA HAB Monitoring System - Lake Okeechobee

Click here to subscribe to the Weekly Water Conditions Tracker


Click here to subscribe to Connecting You to SCCF and other SCCF mailing lists.

LinkedIn Share on LinkedIn
Stay Connected!
Facebook  Instagram  Youtube