This Week's Water Conditions Update

September 16, 2022

Water Conditions Tracker
Lake Okeechobee Levels & Caloosahatchee Flow Impacts

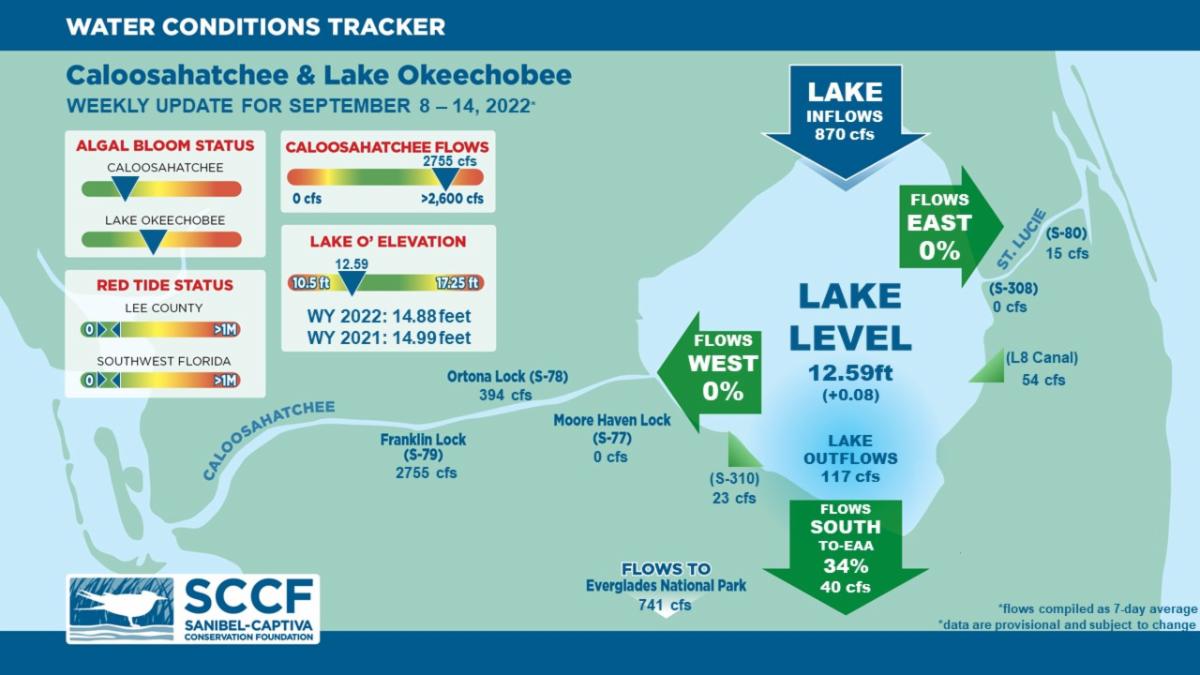
On 9/14/22 Lake Okeechobee was at 12.59 feet, increasing by 0.08 feet in the past week. The weekly average flow at S-79 was 2,755 cfs (cubic feet per second) and flow from the Lake at S-77 was an average of 0 cfs. The 14-day average flow at S-79 was 2,735 cfs and has been in the damaging flow envelope (>2,600 cfs) for 8 days.

For more information on Lake Okeechobee and estuary conditions go to the latest Caloosahatchee Conditions Report

US Army Corps reduces flow

As lake levels decreased to unusually low levels for the wet season and entered the "Water Shortage Management Band" of the lake regulation schedule, the USACE reduced target flows at the W.P. Franklin Lock and Dam (S-79) to a 7-day average pulse release of 0 cfs from the previous target of 457 cfs.


Recently, local basin runoff has resulted in 14-day average flows >2,600 cfs at S-79, which is in the RECOVER 2020 damaging flow envelope for the Caloosahatchee Estuary. Therefore, we support the current release schedule while excessive basin runoff conditions persist.

Virtual Water Quality Tour from Lighthouse Beach

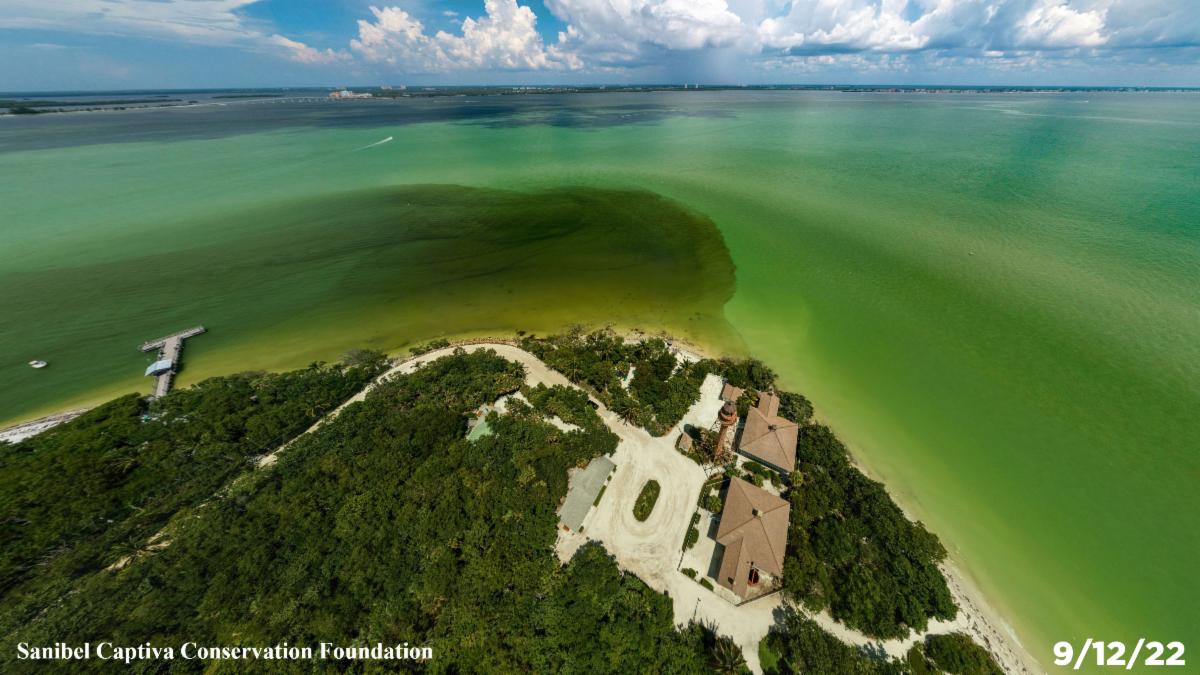
Click here or on the image above to take a virtual tour from above Lighthouse Beach Park to see how the water looked this week.


Photo was taken on 9/12/22 at 1:38 PM on a rising tide (High tide @ 2.89 PM (2.89 ft)).

Red Tide

Satellite imagery over the past week has not detected any blooms off the coast of Southwest Florida.


On 9/9/22, the FWC reported that the red tide organism, Karenia brevis was not observed in samples collected statewide.

The Clinic for the Rehabilitation of Wildlife (CROW) on Sanibel received no birds with toxicosis symptoms (from red tide or blue-green algae) from 9/6/22 - 9/12/22.

Blue-Green Algae

On 9/12/22 sampling for cyanobacteria by the Lee County Environmental Lab reported the presence of Microcystis upstream of the Franklin Locks as sparse specks and slight accumulation along the lock. Microcystis was moderately abundant at the Davis Boat Ramp as sparse specks and slight accumulation along the ramp.

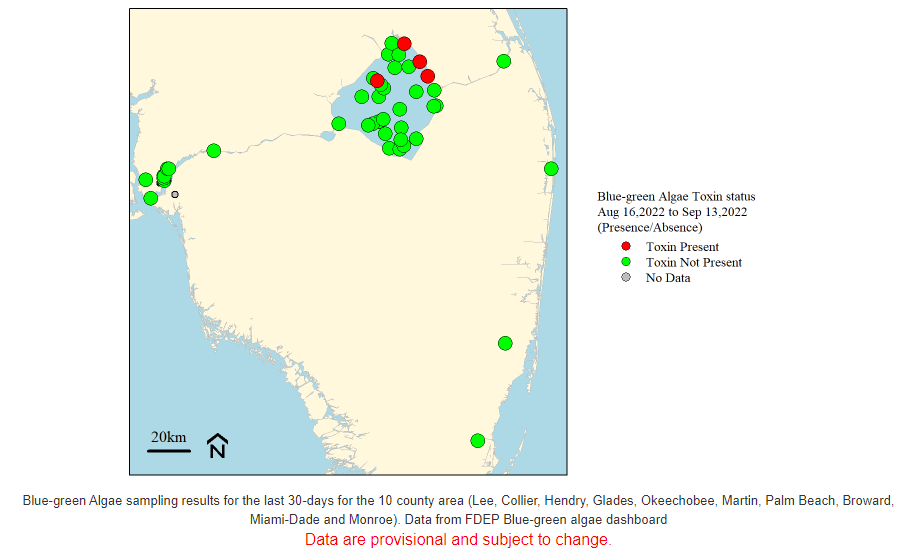
Data from the FDEP blue-green algae dashboard reported 87 samples collected over the past 30 days for the 10 county area. 4 samples had toxins present. with 0.45 μg per L which is below the EPA recommended standard for recreational waters (8 μg per L).

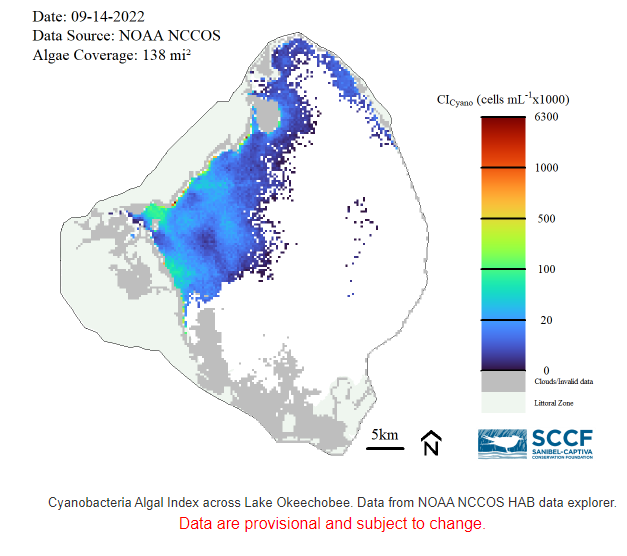
On 9/14/22, satellite imagery from Lake Okeechobee showed low to moderate bloom potential in the northwestern area of the lake. Overall, algal blooms covered about 138 square miles (20%) of the Lake.

Become a Citizen Scientist and Get the Algae Reporting App Today!
SCCF wants to know when and where all types of algae sightings occur to monitor conditions around the islands and to investigate algae bloom occurrence with patterns in seasonal weather changes and Lake Okeechobee water management practices.

Download the algae reporting app on your phone by clicking here or by searching for the ArcGIS Survey123 app in the app store. Once installed, give the app permission to access your phone’s location to receive GPS coordinates of your sighting and camera/media to capture and attach pictures. When you open the app, click “Continue Without Signing In.” 

Next, download the algae reporting survey by scanning the QR code above or clicking here on your phone. Once the survey is downloaded, fill out the required fields and click the check mark in the lower right corner to submit your sighting. Note: If you do not have cellular coverage, you can still fill out the survey and save it in the outbox to be sent later.
Click here to download instructions.

Resources To Follow:
To learn more about our current water conditions, click on the following links:

A collaborative, weekly analysis, including recommendations for water managers regarding Lake Okeechobee flows.

SCCF's River, Estuary, and Coastal Observing Network is a network of eight optical water quality sensors deployed throughout the Caloosahatchee and the Pine Island Sound estuary to provide real-time water quality data.


Click here to subscribe to Connecting You to SCCF and other SCCF mailing lists.
DONATE TO SCCF
Stay Connected!
Facebook  Instagram  Youtube