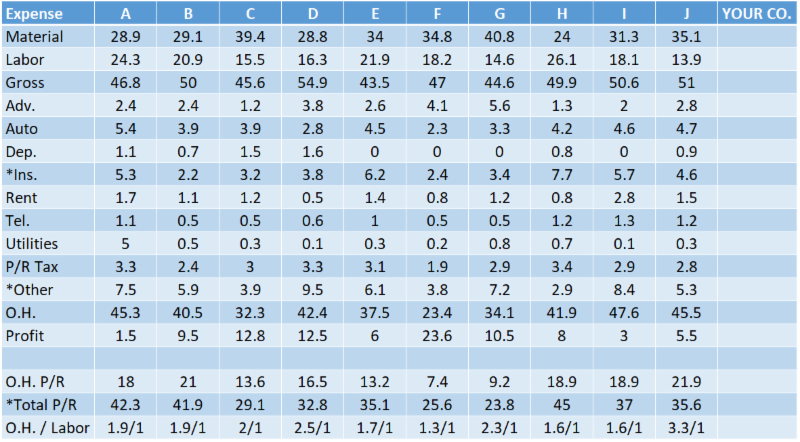
Most companies operate in a vacuum. You know what your own operating numbers are, but you never get a chance to compare your numbers with other companies. So, when you see your labor is 18% of sales or your overhead P/R is 17% of sales, you really don’t know if that is good or bad.
Note that I use % of sales all the time. It works like this:
Total Sales - $1,500,000 – Labor - $300,000
Labor / Sales = $300,000 / $1,500,000 = 20.0%
By using %, you can get a good comparison with any size company.
When I get your operating statement, I’ll arrange it so that I can get a good apple to apples comparison with the other 10 companies on the chart. Then, I’ll convert all of your numbers to % and put your % in the last column on the right of the chart. This is just like getting a report card! All you have to do is scan across each line and compare your % to the 10 other contractors.
This will bring out lots of possibilities. Maybe your total P/R is 36% of sales and contractor “C” is only 29.1% of sales. If you could get your P/R down close, say to 30.0%, you would drop 6 points to your bottom line and probably increase net profit by 70-80%!