|
In this issue:
- Prime working-age population grows, along with senior population
- Navigating a potential government shutdown from the data user's perspective
- Metropolitan/micropolitan boundary changes and how they affect data users
- TNSDC releases new geographic classification files for county-level data analysis
| |
$1.4 Million More
in Career Earnings
can be expected when comparing a bachelor’s degree holder to a high school graduate in Tennessee. New Boyd Center research exploring the value of a college education also notes that although an associate’s degree netted $417,000 more in lifetime earnings, returns fell a bit as workers without post-secondary education saw wages grow in the post-pandemic economy. The report adds that a bachelor's degree brought a 14% return on the cost of tuition.
| |  |
4850 Ethnic Kurds
lived in Tennessee in 2020; most of whom were residents of Davidson County. That’s according to the just-released Detailed Demographic and Housing Characteristics File-A which showed the state had more Kurdish population than any other in the country. The new data includes population counts for 1,500 racial and ethnic groups, as well as American Indian and Alaska Native (AIAN) tribes. The 5,000 Laotians in Rutherford County (#8 nationally) and 5,600 Scots-Irish in Knox County (#9 nationally) were also notable.
| |
Tennessee’s Prime Working-Age Population Grows, but Still Outpaced by Retirement Age Increases | |
|
Two years into the decade, the growth rate of the state’s prime working-age population has matched the state’s overall increase at 1.8 percent. Tennessee has added 48,000 people between the ages of 25 to 54 between July 2020 and July 2022.
By comparison, the same age group in Tennessee grew by fewer than 45,000 people over the prior 10 years and grew significantly slower than the state, making this a noteworthy turnaround.
However, the growth of the senior population still grabs headlines. The number of people aged 65 years and over increased by nearly 60,000 over the last two years and grew almost three times faster (5.1 percent).
| |
|
The drivers of population growth for these two age groups are quite different. Increases in the 65+ age group are mainly the result of “Baby Boomers” reaching retirement age. The final boomers will turn 65 in 2029.
But prime working-age increases are primarily coming from Tennessee’s elevated levels of net migration, with more people aged 25 to 54 moving into the state than are moving out.
| |
|
Navigating a Shutdown: Tips for Data Users
The prospect of a federal government shutdown could concern data users since statistical agency websites went dark during similar events in the past. The Department of Commerce seems to suggest that will be the case again this go-around. But there are alternatives to putting your research on hold.
Here are a few data sources that provide access to U.S. Census Bureau data that could be used in the interim:
-
Census Reporter – is a free, open-source platform focused on making American Community Survey (ACS) data more accessible and includes the recent 2022 1-Year ACS data
-
Esri – for mapping users, the GIS vendor publishes a number of U.S. Census Bureau data sets, including the ACS, through its ArcGIS Online Platform
-
PolicyMap – offers a free tier that can be used to view basic information down to the tract level, but more detailed data and functionality require a subscription
-
IPUMS – Even during normal government operations, some analysts turn to Minnesota Population Center products to access ACS, Current Population Survey microdata and Decennial Census data
And for other government statistics, particularly from economic agencies, the venerable FRED platform (Federal Reserve Economic Data) won’t be subject to a shutdown.
If you have other suggestions or need other data-related assistance if the shutdown occurs, let us know.
| |
Metropolitan/Micropolitan Areas Boundary Changes Affect Eight Tennessee Counties | |
Tennessee maintained 10 Metropolitan Statistical Areas (MSAs) in 2023. 44 Tennessee counties are in an MSA, and 14 additional counties from five bordering states are also included in MSAs centered in Tennessee. | |
|
The U.S. Office of Management and Budget (OMB) released new Core-Based Statistical Area (CBSA) boundaries in a July 21, 2023, memorandum. This is part of a regular, five-year cycle of updates incorporating new U.S. Census Bureau data on urbanized areas and commuting patterns.
The more commonly used CBSAs, called Metropolitan Statistical Areas (MSAs) or “metros” for short, are centered around counties that contain a core, census-defined urban area with a population of at least 50,000. Surrounding counties that exchange more than 25 percent of the labor force with the core are added as outlying counties.
Changes announced in July included the addition of three outlying counties to existing MSAs in Tennessee. Revisions to the boundaries are noteworthy because they are included in many federal data products and determine eligibility for some government programs.
| |
Table 1: Changes to Tennessee-centered Metropolitan Statistical Areas (MSA) in 2023 | |
Table 2: Example of Metropolitan Statistical Areas adoption for three key federal demographic and economic agencies | | |
|
|
There's more on the SDC website:
- An interactive map showing change from 2018 to 2023
- Details of county-level changes to micropolitan areas
- Discussion of the programmatic impact of the changes
| |
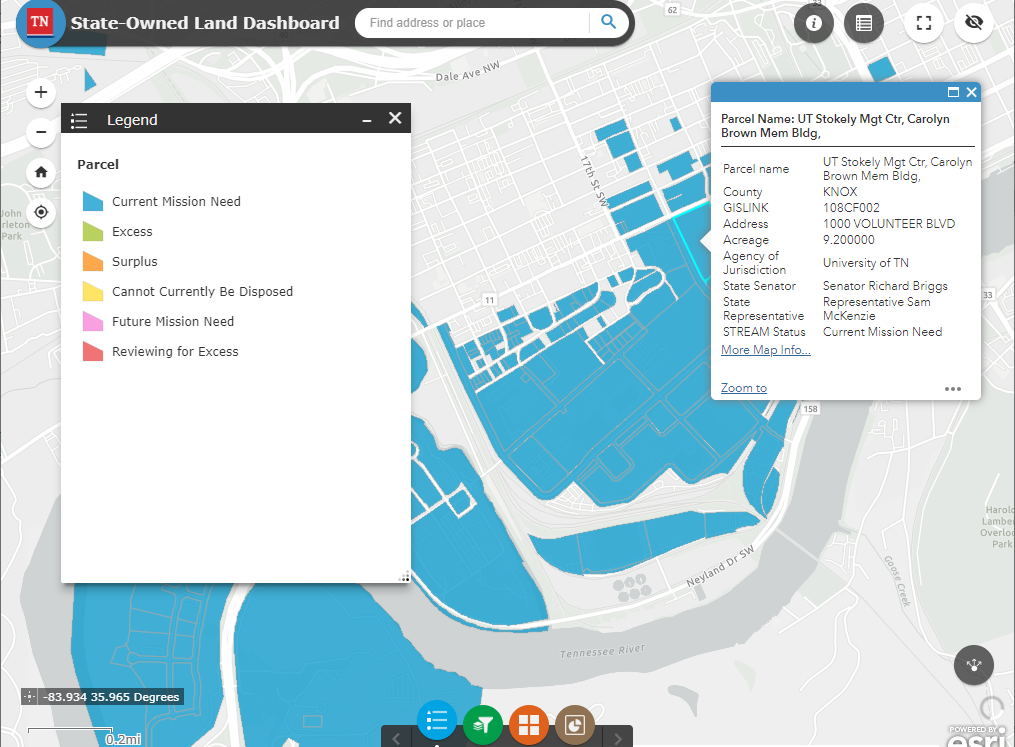
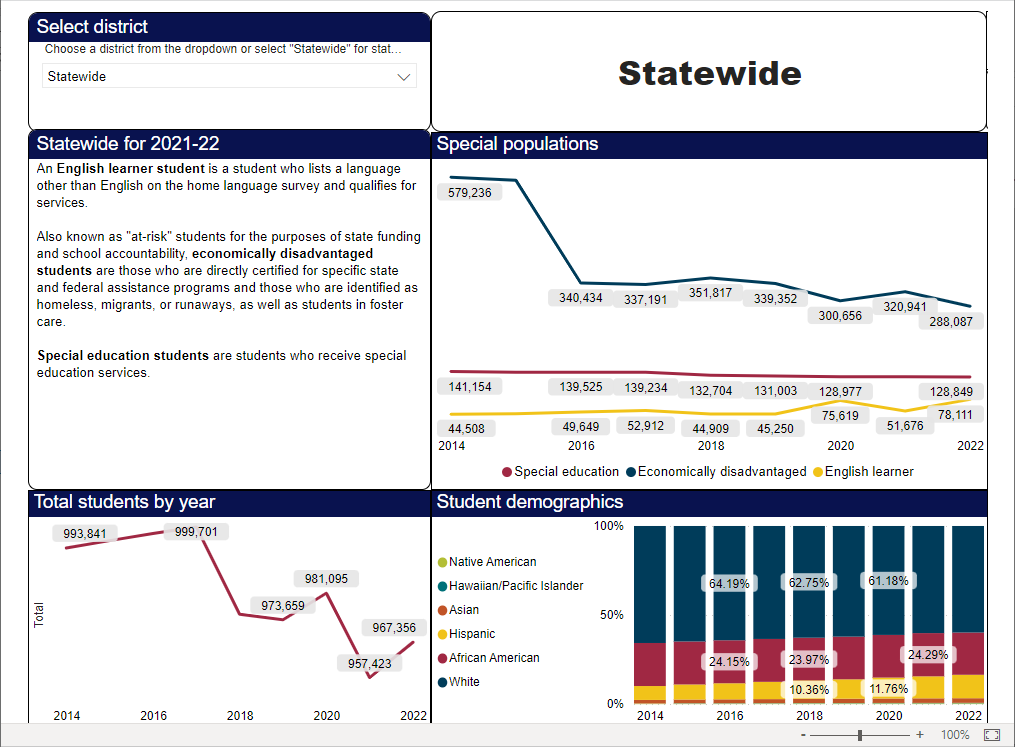
Tennessee Economic Indicators | |
The state of Tennessee recently published a couple of interesting tools that caught our eye. Both interfaces are designed to be public-facing and are good examples that showcasing transparency and accountability. | |
|
Supercharge Your County-Level Data Analysis with Our Geographic Classification Files
When working with Tennessee county data, particularly from federal sources, they often lack classifications that are important. What if there was a single file containing the “greatest hits” of geographic classifications that can be added to data files using the ubiquitous county geographic identifier (GEOID)?
Our Tennessee geographic classifications file provides essential county categorizations that can be easily integrated with your existing data. The list of designations included in the county-based file includes:
- Urban/Rural Classifications from the Tennessee Department of Economic and Community Development
- Tennessee Development Districts
- Metropolitan/Micropolitan Statistical Areas details (2023)
Links to download the data and an interactive map showing the boundaries are found on our website
| |
|
Intercensal Estimates and Population Projections Update
In our last newsletter, we speculated that the 2010 to 2020 Intercensal Estimates would be available this fall. It turns out that internal issues at the U.S. Census Bureau have delayed the Population Division’s efforts to obtain the required 2020 Census data. That could push this important product back a full year to the fall of 2024. The Boyd Center will develop an interim intercensal product to support our planned 2024 Q1 population projection release.
| |
|
Your To-Do List: Sign up for the Census Bureau Tip Sheet
If you were going to sign up for one data-focused newsletter (besides ours!), make it the Census Bureau’s Tip Sheet. This informative weekly note provides important information on upcoming releases and product announcements. There are numerous other emails available on the signup page, so choose wisely.
| |
About the Tennessee State Data Center Network | |
The State Data Center Program is a cooperative program of the State of Tennessee, The University of Tennessee and the U.S. Census Bureau. Data Centers in each state assist the Bureau by disseminating Census data, other federal data sets and information. | |
Data Center Affiliates
Each center has an internal statewide affiliate network to further assist in disseminating data to local users. These affiliates also have local information and expertise to offer. Visit tnsdc.utk.edu for a full listing of affiliates.
| |
916 Volunteer Blvd. | 713 Stokely Management Center
Knoxville, TN 37996
| |
| | | |