You are receiving this because you signed up for Traffic Stats at banff.ca/Newsletter

You may need to "click to download pictures" to see graphs.

September 2025 Traffic Volume


What Happened in September

September 2025 traffic volumes at Banff’s main entrances edged up compared to September 2024 and remained well above 2019 levels. In contrast, vehicle counts over the Banff Avenue Bridge declined year-over-year and stayed below pre-COVID volumes, indicating that transit, intercept parking, and active modes continue to shape travel behaviour. Similar to August, unseasonably warm and exceptionally dry weather relative to both last year and the long‑term climate normal likely supported steady entrance activity without translating into higher bridge crossings.


Roam Transit ridership on local Routes 1 and 2 posted strong double‑digit growth, helping to reduce private vehicle crossings into the south side. Meanwhile, Mountain Avenue volumes fell sharply compared to both 2024 and 2019, consistent with ongoing use of shuttle services and mode shift initiatives on the corridor to key attractions like the Banff Gondola.


At a Glance


  • Main Entrances: 706,054 vehicles, up 1.7% vs Sept 2024 and 11.6% vs 2019.
  • Year-to-Date: 2025 is 5.7% higher than 2024 and 6.2% higher than 2019.
  • Weather: Average daily high of 22.7°C and low of 5.4°C, with just 2.5 mm precipitation. This is much warmer and dryer than both 2024 and the climate normal.
  • Bow River Bridge: 363,661 vehicles, down 6.1% from 2024, and 12.7% below pre-COVID 2019.
  • Mountain Avenue: 136,019 vehicles, down 26.9% from 2024 and 28.3% below pre-COVID 2019.
  • Roam Transit: Local Routes 1 & 2 ridership reached 195,670, a 14.1% increase over 2024, equal to about 78,900 fewer private vehicle crossings.


Main Entrances

In September this year, 706,054 vehicles were counted at Banff’s two main entrances: Mt. Norquay Road and Banff Avenue. This is a 1.7% increase over September 2024, and a 11.6% increase over pre-COVID September 2019. The year-to-date vehicle count is 5.7% higher than 2024, and 6.2% higher than 2019.


September Weather Overview


Weather has an impact on visitation, specially for day visitors driving from the Calgary region. September weather in Banff was much warmer and drier than in 2024, with an average daily high of 22.7°C, low of 5.4°C, and only 2.5 mm of total precipitation. By comparison, September 2024 saw highs of 19.7°C, lows of 3.0 and 21.5 mm of rain.

Year

Average High (°C)

Average Low (°C)

Precipitation (mm)

2025

22.7

5.4

2.5

2024

19.7

3.0

21.5

2023

17.5

3.2

49.9

30-Year Normal

16.7

2.2

44.9

Climate normals are computed over a 30-year period to eliminate year-to-year variations. Source: Environment Canada

Bow River Bridge

Bridge crossings reached 363,661 in September, a 6.1% decrease from September 2024, and 12.7% lower than pre-COVID 2019 levels. Year-to-date traffic over the bridge is up 2.5% compared to last year, and remains 11.7% below pre-pandemic 2019.


Year-to-date 2025 volume over the bridge is 2.5% higher than the same period in 2024 and 11.7% fewer vehicles than the 2019 year-to-date volume.


The decrease in traffic volumes across the bridge since pre-COVID 2019 may be attributed to several factors, including increased active transportation modes, free transit for locals, intercept parking combined with promotion and uptake of transit use. However, year-over-year traffic saw an increase in 2025, which may be partially attributed to the closure of the Banff Avenue Pedestrian Zone, which detoured drivers toward parking lots.


To reduce traffic jams on the south side, the Town installs signs on the main routes to the bridge indicating parking lots are full at the Banff Gondola when Parks Canada sends the Town a notice of full capacity on Sulphur Mountain.

Mountain Avenue

In September 2025, Mountain Avenue recorded 88,716 vehicles, a 26.9% decrease compared to September 2024 and a 28.3% decrease compared to 2019.


Year-to-date traffic volumes are 3.2% lower than 2024, and remain 13.0% below 2019 levels.


As in previous months, this corridor, which leads to key attractions like the Banff Gondola, continues to benefit from tour shuttle services and strategic signal management at intersections such as Spray/Mountain Avenue.

Roam Ridership

Roam Transit continues to see strong growth. Town of Banff local Routes 1 and 2 carried a combined total of 195,670 riders in September 2025, which is a 14.1% increase compared to September 2024 and a 15.8% increase compared to 2023.


This level of ridership is estimated to have replaced over 78,900 private vehicles, helping reduce congestion and emissions in Banff.

Traffic Management Updates


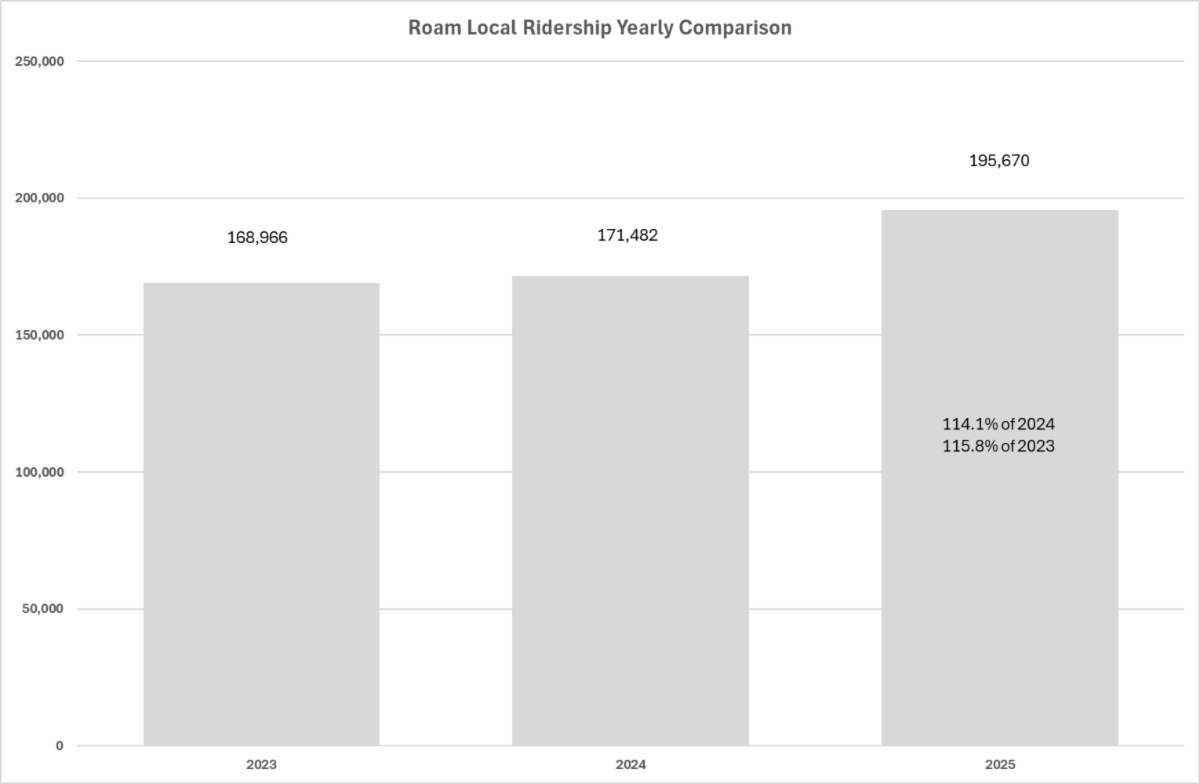
Tour Bus Volume Rebounds

Tour bus visitation is climbing back to pre-COVID levels, and the number of smaller shuttles with 11-24 seats has grown exponentially since the park and ride systems with private operators were introduced for Lake Louise and Moraine Lake. Consequently, bus parking in the public lot behind the Mount Royal Hotel continues to exceed capacity on weekends. In response, the Town has:


  • Expanded overnight tour bus parking at the Train Station Public Parking Lot, in addition to the space in the Industrial Compound.
  • Added on-street coach bus parking on Beaver Street at the entrance to the Mount Royal lot.
  • Piloting reduced parking duration in the lot behind the Mount Norquay Hotel, changing from 2-hour parking to 15-minute loading.
  • Additional bus and shuttle parking in the townsite is being explored.


Notice: Surprise Corner Maintenance

The Town has closed the upper viewing platform at Surprise until October 20, to repair vandalized structures, replace aging boards and re-stain and maintain the stairs, benches and railings. The parking lot will remain open but the viewing area will be reduced.


Tracking Visitor Origins

The town is now tracking License plate data at town entrances. This will provide insights into the geographic origin of visitors, including U.S. tourists taking advantage of a stronger dollar, and residents of Calgary and surrounding areas. In 2025, about 18% of vehicles entering Banff are registered in Calgary. These insights will support data-driven planning.


Real-time Congestion Management

  • Manual traffic signal overrides continue to ease congestion at key intersections.
  • Flaggers continue to manage traffic flow and pedestrian safety at key intersections every weekend in summer.


Proactive Visitor Messaging

During peak summer months, the Town amplifies communications in the Calgary region via radio advertising, media relations and social media:


  • Encouraging day visitors to consider leaving their vehicle at home and taking a bus to Banff
  • Urging overnight visitors to leave their vehicle (especially RVs and trailers) parked at the campground and taking free Roam Transit to town, and hotel guests to leave their vehicles parked and using free transit passes that most hotels give to guests.
  • Encouraging Calgary-area drivers to arrive before 10 a.m. or after 5 p.m. to be able to find parking and less crowded trails, attractions and transit.
  • Encouraging visitation in fall, winter, and spring.


Learn more at:


Definitions


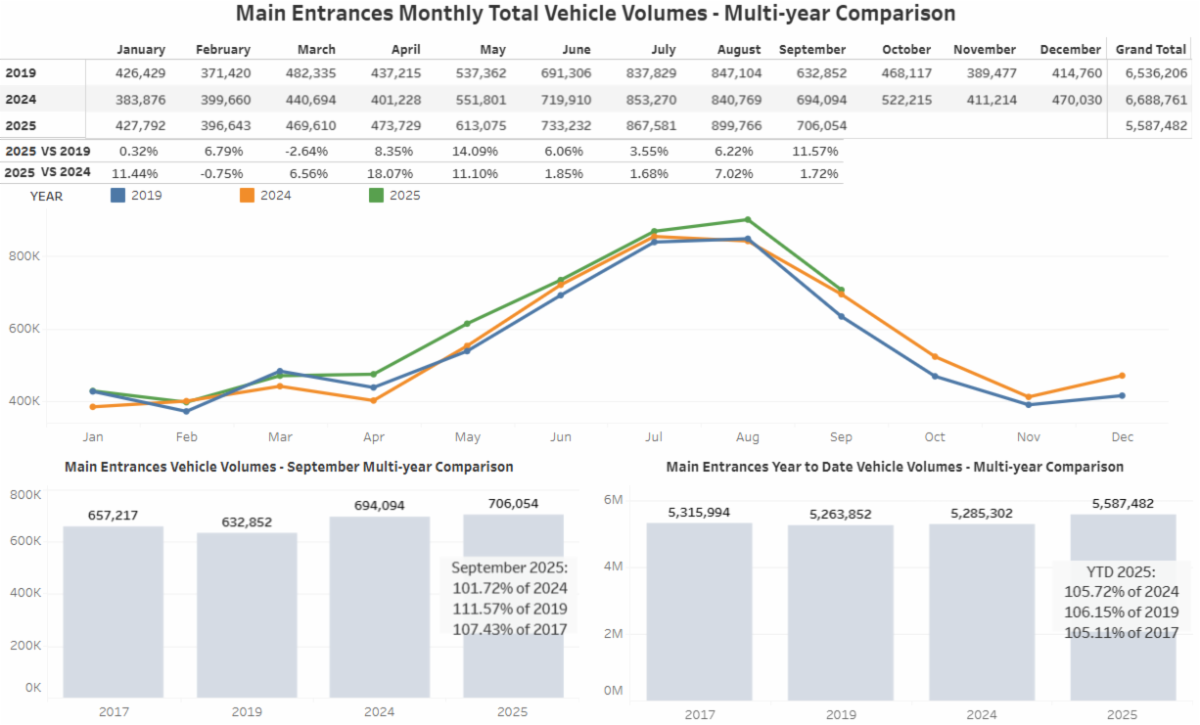
Main Entrances Monthly Total Vehicle Volumes: This number references the total number of vehicles recorded (both incoming and outgoing combined) at traffic count stations located at the two main entrances to town: on Norquay Road and on Banff Avenue. This number equals ((Norquay Rd. incoming volume + Norquay Rd. outgoing volume) + (Banff Ave. incoming volume + Banff Ave. outgoing volume)). The vehicle volume reported is not representative of the total number of vehicles in town in one month; it is simply how many vehicles are moving in and out of the town over the course of one month.


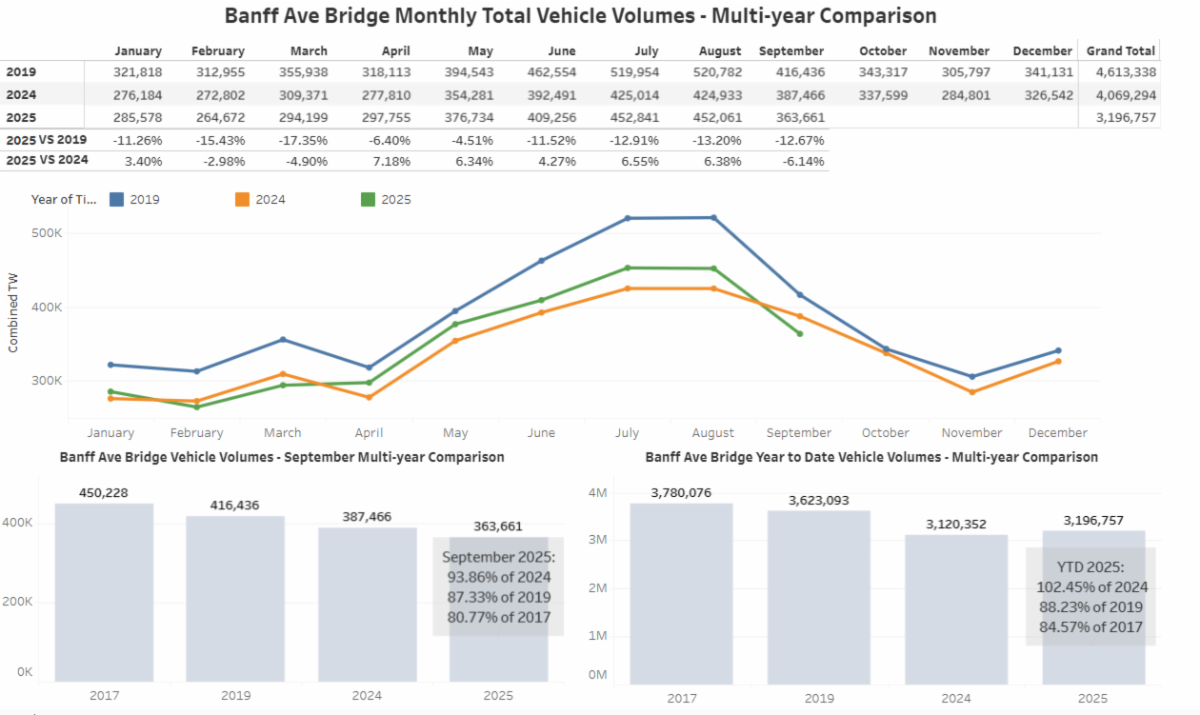
Bow River Bridge Crossings on Banff Avenue - Monthly Total Vehicle Volume: This number references the total number of vehicles recorded (both southbound and northbound combined) over the course of one month at a traffic count station located on the bridge. Full monthly data collection at this location began in August 2016.


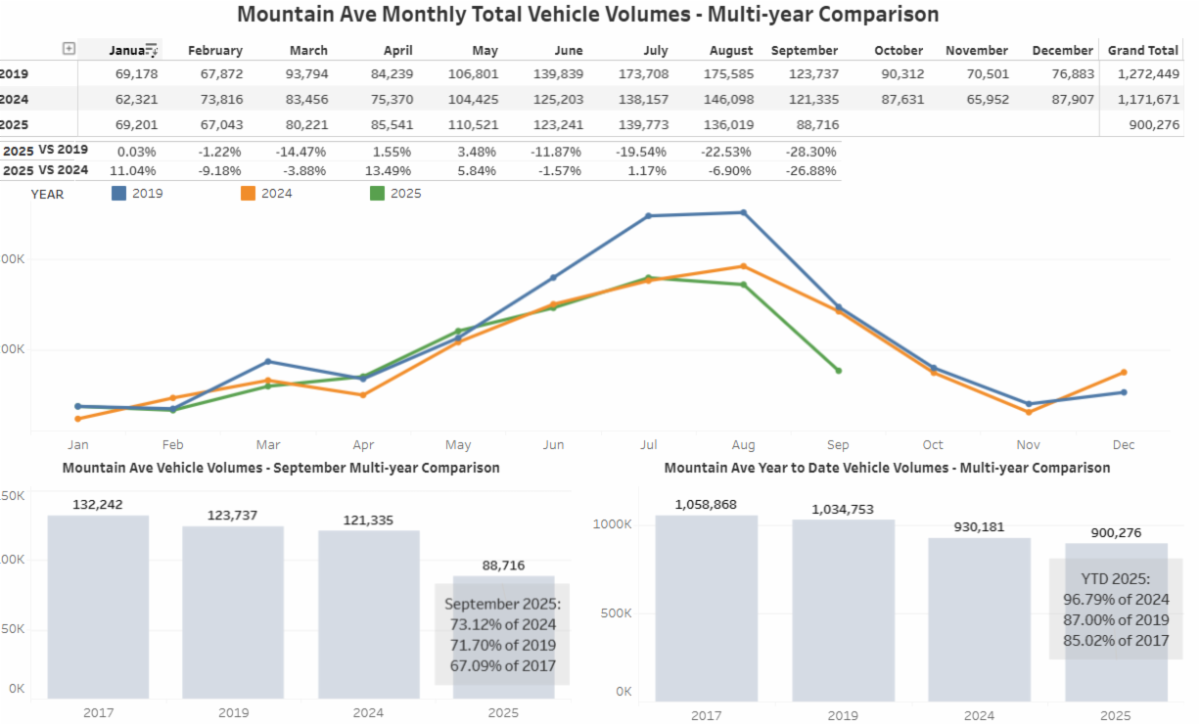
Mountain Avenue Monthly Total Vehicle Volume: This number references the total number of vehicles recorded (both southbound and northbound combined) over the course of one month at a traffic count station located on Mountain Ave., around the corner and up the hill from Middle Springs Drive.


Total Vehicle Volume year-to-date (YTD): This number references the total number of vehicles recorded (both incoming and outgoing combined) between January 1 and the end of the reporting month at traffic count stations identified above.

Facebook  Twitter  Instagram