|
MONTGOMERY COUNTY — (Oct. 28, 2026) —
Montgomery County’s housing market slowed during September 2026, with Houston Association of REALTORS® data showing fewer completed home sales than in September 2025.
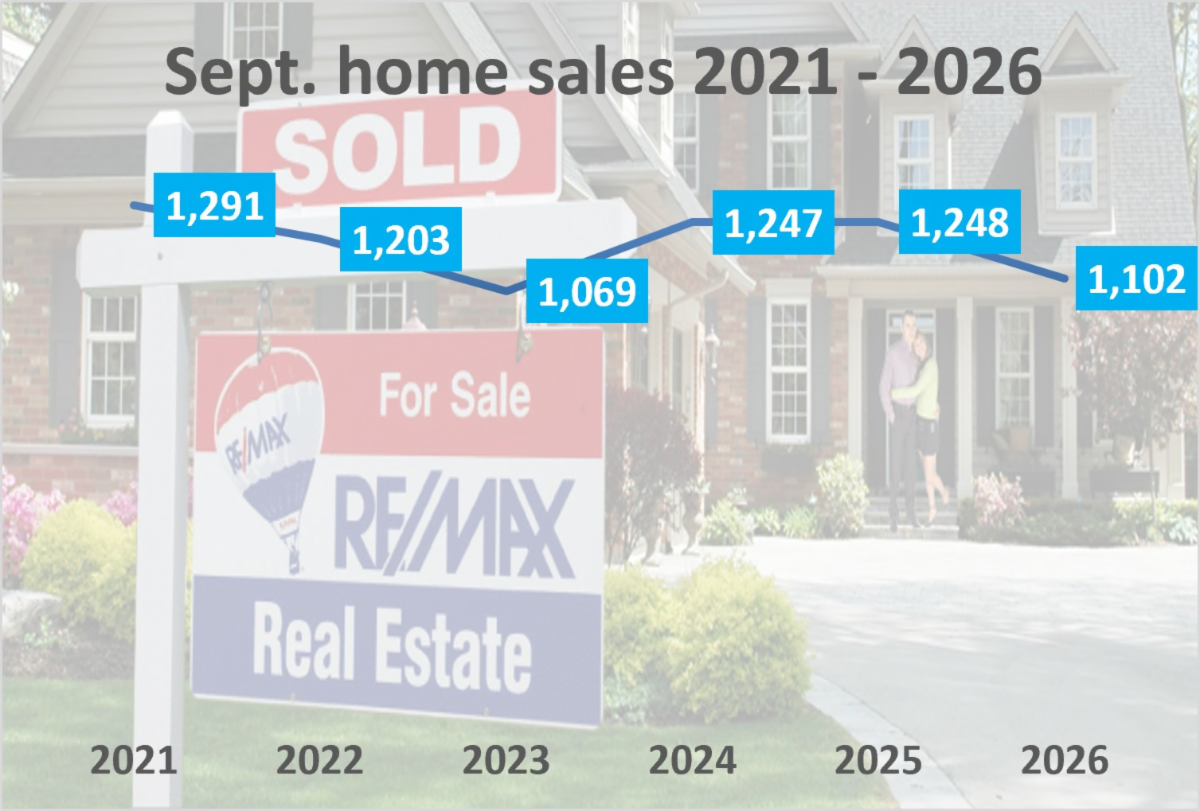
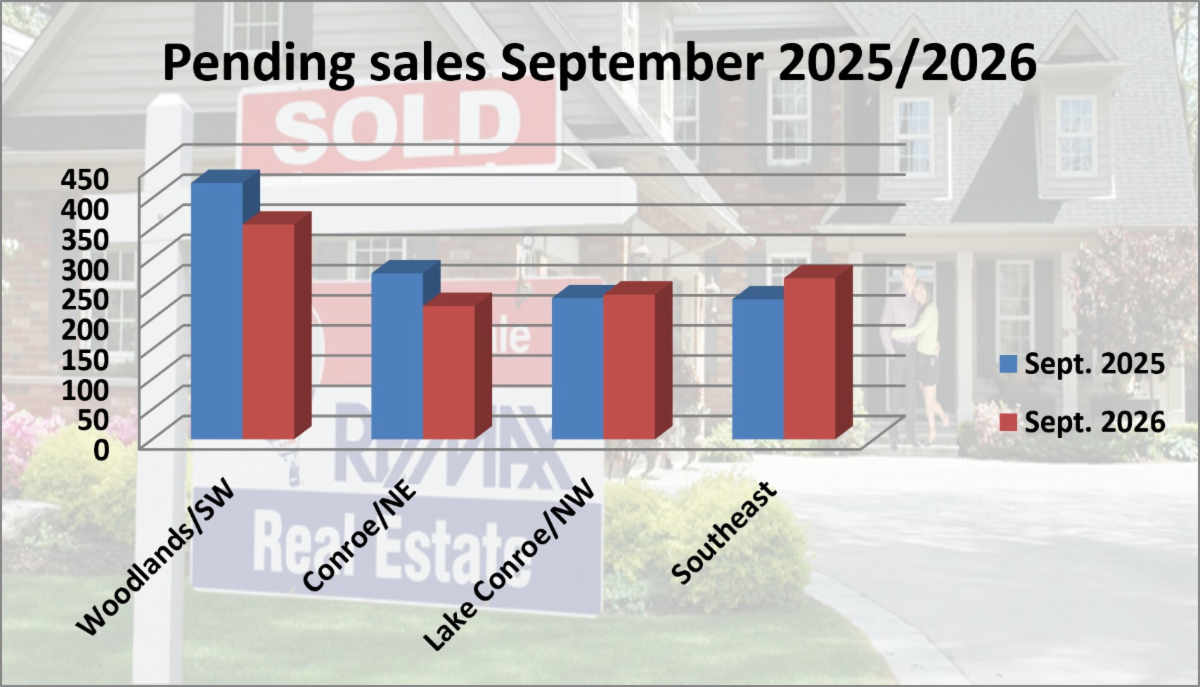
During September 2026, the county recorded 1,102 closed sales, down 11.7% from September 2025. Total dollar volume fell 6.2% to $480.7 million, while active listings increased 9.2% to 6,420 homes. Pending sales declined 7%, suggesting continued caution among buyers.
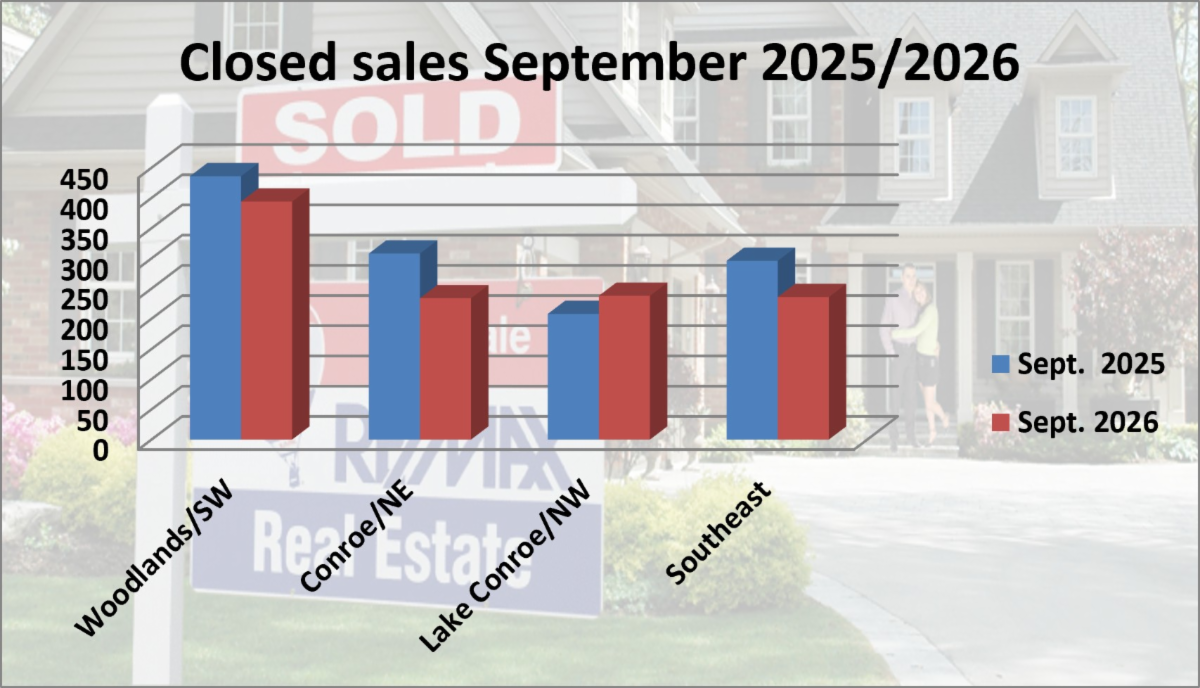
- Southwest Montgomery County: Closed sales fell 9.6% to 394. Median price slipped 0.7% to $367,500, while active listings rose 4.8%.
- Northeast Montgomery County: Sales dropped 24% to 234, the steepest decline among the four areas. Median price decreased 2.3% to $282,495, and total dollar volume fell 20.9%.
- Northwest Montgomery County: The strongest sales performance, with closings rising 14.4% to 238. Median price remained flat at $365,430, although active listings surged 21.9%.
- Southeast Montgomery County: Sales declined 20.3% to 236, while the median price increased 2.3% to $276,745. Pending sales rose 15.1%, offering a more encouraging signal for future activity.
Mortgage Rates Add Pressure Heading Into Fall
The September sales slowdown occurred as mortgage rates climbed sharply through late summer and early fall. According to Realtor.com Economic Research, the average 30-year fixed mortgage rate reached 7.40% on October 8 before easing to 7.32% on October 22. This October decline represents only modest relief after weeks of rising borrowing costs. That dynamic means buyers face tighter affordability, while sellers may encounter greater price sensitivity and longer negotiations.
Implications for Buyers and Sellers
For buyers, September’s higher inventory and slower sales suggest greater opportunities to negotiate prices and concessions. For sellers, realistic pricing, strong property presentation and flexibility are increasingly important as competition grows.
\The bottom line: September 2026 sales were weaker than September 2025, but local conditions varied substantially. Buyers and sellers should evaluate trends in their specific MLS area rather than assume the entire county is moving in the same direction. For specific analysis for your home and neighborhood, contact me!
HAR notes that its MLS data is preliminary and subject to change.
Of course, all real estate is local, local, local, so to understand how your particular neighborhood is performing CLICK HERE and I will be happy to send your reports for your neighborhood.
((SEE FULL GRAPHIC FOR COMPLETE LOOK)
HERE IS A CHART SHOWING THE UNDERLYING DATA FROM HOUSTON ASSOCIATION OF REALTORS
|