|
In this issue:
- Cities are growing in Tennessee, but unincorporated areas are, too
- 2025 building permit figures are in and show more multifamily tightening
- Do you use the Census Bureau API? We'll "key" you in on a recent change.
- Coin-flip baby names and we take issue with a USDA "pie" chart
| |
69,124 students graduated from public high schools
in Tennessee in May 2025 likely represent the most diplomas ever conferred by the state's public high schools in a year. The 2026 class size won't be final until next fall, but nationally, graduating classes are expected to shrink after last year's peak that coincided with a 2007 high in births. The Western Interstate Commission for Higher Education projects that graduates will fall by 13 percent through 2041. Tennessee's classes, however, are expected to recover and actually grow by nearly 15 percent, the largest increase in the country.
| |  |
1.8% of Tennessee housing units lack air conditioning
according to new state, county, and census tract-level estimates. Three counties in far northeastern Tennessee had the largest share of homes without AC, including Johnson (17.5%), Carter (7.7%), and Unicoi (7.5%). At the county level, lower rates were seen in rural areas in the eastern half of the state along the plateau, upper Cumberland, and the mountainous North Carolina border. These experimental estimates could help sharpen less quantifiable measures of heat vulnerability by adding direct indicators of household exposure.
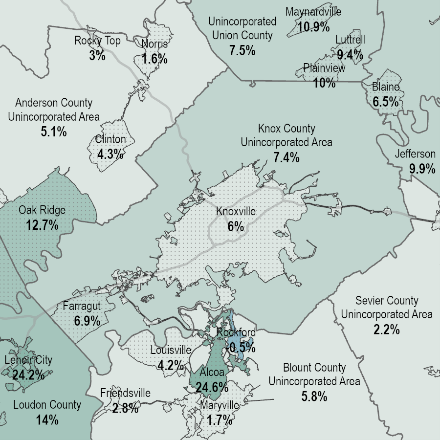
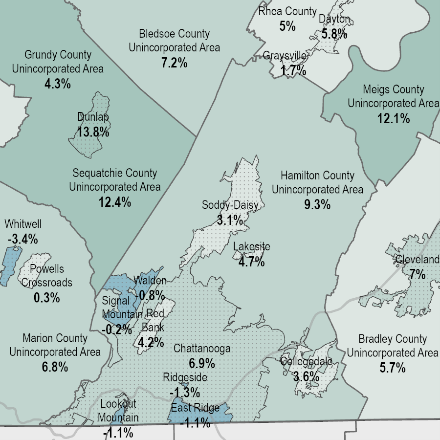
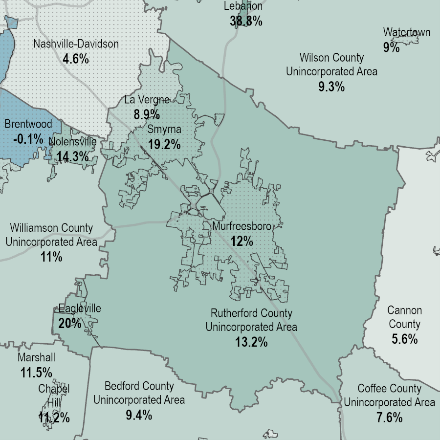
| | Unincorporated Parts of Tennessee Are Among Fastest Growing Areas Since 2020 | | Percent Population Change 2020-2025 | | |
Nashville and Clarksville have posted big population increases this decade. Lebanon, White House and Baxter are some of the fastest growing cities, but Tennessee’s growth story doesn't stop at the city limit.
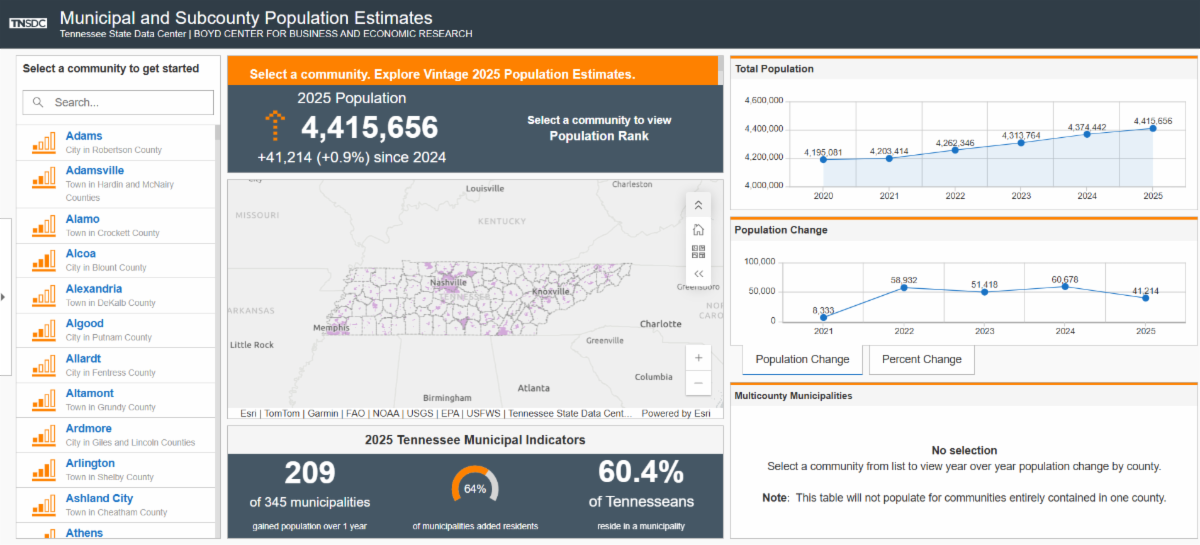
New subcounty population estimates show that some of Tennessee’s largest gains since 2020 are happening in the unincorporated areas outside of municipalities. Since the decennial census, unincorporated areas have added nearly 173,000 people and grown by 6.3 percent - outpacing the state’s municipalities, which grew by 5.5 percent from April 1, 2020, through July 1, 2025.
Unincorporated Knox, Rutherford and Hamilton counties have seen population increases that are on par with some of the state’s fastest gaining areas this decade. Each year from 2020 to 2024, unincorporated Knox County ranked between first and fourth among all subcounty areas in annual population gain, adding between 3,800 and 5,400 residents per year. Good enough to make it the third-fastest gaining part of the state by 2025.
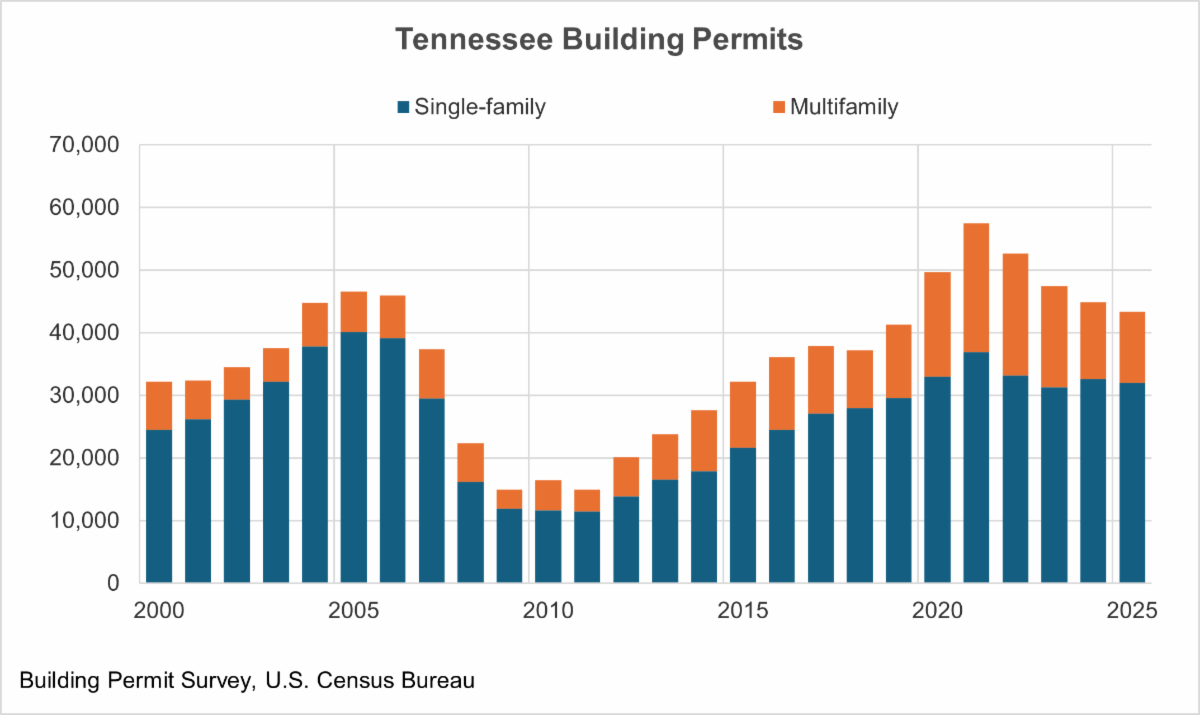
| | Single-Family Holds, but Multifamily Decline Pushes Tennessee Permits Lower in 2025 | | |
Local governments in Tennessee authorized 44,863 new housing units in 2025, a 3.3 percent decline from 2024, according to the Census Bureau's Building Permits Survey released on May 14.
Tennessee single-family permits were 1.8 percent lower and have remained relatively steady in the face of elevated borrowing costs over the last four years. But the multifamily side was down 7.4 percent over one year and is off 45 percent since a 2021 peak when 20,500 permits were pulled statewide. That market segment sought approvals for just 11,300 new units in 2025, the fewest since 2018. A pullback in Davidson County’s multifamily permits, which grew dramatically between 2020 and 2023, explains much of that contraction.
Overall, the U.S. was off by 3.1 percent over the same period, but the South region saw a steeper 4.2 percent slide, including cooldowns of about 10 percent in North Carolina and Georgia.
The survey covers only permit-issuing jurisdictions, so the totals do not include units constructed in areas of the state where building permits are not required. At the national level, that is estimated to be about 1 percent to 2.5 percent of new units.
Tennessee’s county and municipal permit totals can be viewed in our dashboard.
| | Tennessee Economic Indicators | | |
Certified Population Report Scheduled for Release on July 1, 2026
The Tennessee Department of Economic and Community Development (ECD) will publish the inaugural Certified Population of Tennessee Incorporated Municipalities and Counties around July 1, 2026. This year's certified figures will be based on the estimated population as of July 1, 2025, derived from Vintage 2025 estimates produced by the U.S. Census Bureau. Under a statute enacted in 2025, those figures – rather than decennial census counts – will direct the distribution of state-shared revenues.
For many communities, the published Census Bureau estimate will serve as the certified population in 2026. However, municipalities and counties that have had a special census certified by ECD will see those results integrated into their figures. Population estimates for the urban services districts in the state's three metropolitan counties are also being finalized. Both adjustments affect the final aggregate population totals that serve as the denominator in per capita distributions.
Read more about the program on our website.
| |
Census Bureau Now Requires API Key for Data Retrieval
On May 12, 2026, the Census Bureau announced that all queries to the Census Data API now require a free API key. Previously, keys were only required after exceeding a daily call threshold — now they must be included with every request. The Bureau says the change is a security measure and has not indicated that other adjustments to its liberal usage policy are planned. An email address is required to register, and the key should not be shared with other users.
If you've been pulling data from the API without a key, your queries will no longer work until one is added. Keys are free and available immediately. Once obtained, append it to the end of your API call:
https://api.census.gov/data/2024/acs/acs1?get=NAME,B01001_001E&for=state:06&key=YOUR_KEY_GOES_HERE
| | | | | |
Group Quarter Definition Change Acknowledges Evolving Senior Care Landscape
Assisted living facilities and nursing homes will both be classified as group quarters in the 2030 Census. In 2020, only nursing homes — which provide skilled medical care — were counted as group quarters, with enumeration of their residents coordinated by the facility. Assisted living residents were counted as living in housing units, with each room considered a separate dwelling, and residents were required to self-respond.
The reality is that it’s becoming more difficult to draw clear lines between the two types of facilities, with some offering both assisted living and skilled nursing services. In some cases, residents can transition to a different level of care without leaving their rooms. The change should improve coverage and reduce confusion, but expect the number of housing units to decrease and the group quarter population to grow as a result. Tennessee licenses more than 23,000 beds in 330 assisted living facilities.
| |
Attend the 2030 Local Update of Census Addresses (LUCA) Training
- The webinar will take place on Wednesday, June 3, from 1-3 p.m. EDT
-
Registration is required. You can register by clicking here
- For questions, please email 2030LUCA@census.gov
| | |
Even Splits: Census Bureau's First Name Data Reveals Coin-Flip Names
For the first time in 30 years, the Census Bureau published data about the most common first names from the 2020 Decennial Census. Michael and Mary top the male and female lists. Buried in the data are names split almost evenly between males and females: Harley, Emerson and Quinn. Peyton was the 9th most common "coin-flip" name, and although no geographic specificity is included, we're betting on a cluster here in East Tennessee.
| | | | Male | Female | | Harley | 51% | 49%
| | Emerson | 51% | 49%
| | Quinn | 53% | 47%
| | Kerry | 54% | 46%
| | Jessie | 56% | 44%
| | | |
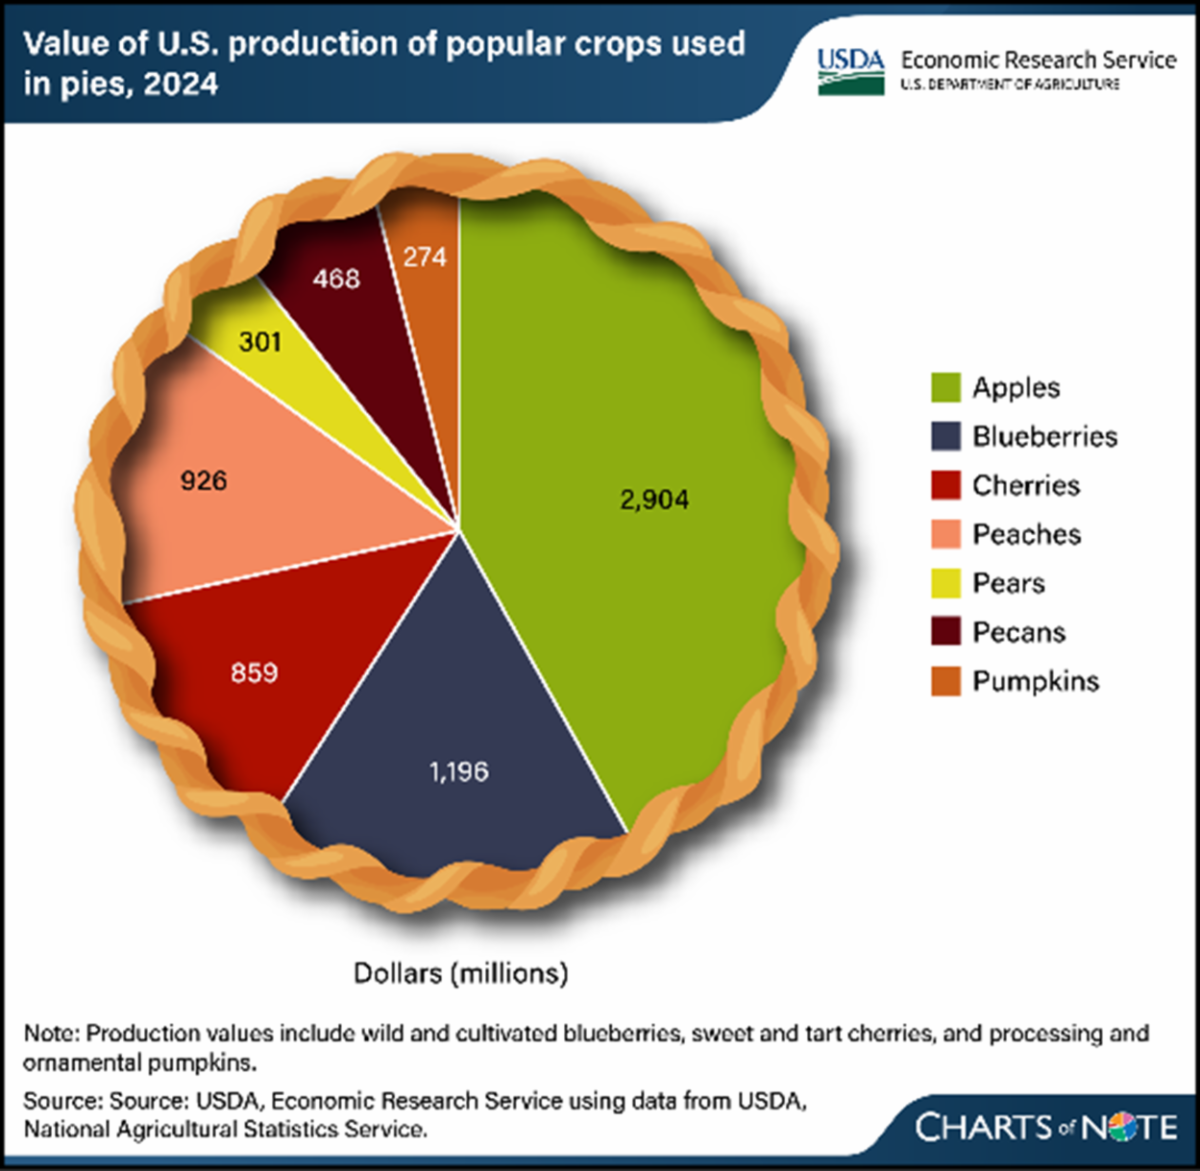
Egregious USDA Oversight Excludes Strawberry, Raspberry from… Er, Pie Chart
A new USDA Chart of Note tallied $6.9 billion in U.S. production of seven popular pie ingredients, but inexplicably excluded summer classics: strawberries, raspberries and rhubarb in favor of … wait for it … pears. With seven slices, the chart is already crowded, but strawberries were a $4 billion crop in 2024 and would be the chart’s largest wedge. Raspberries weighed in at $475 million. And rhubarb — nary a mention. It's a pie chart. Make room.
| | About the Tennessee State Data Center Network | | The State Data Center Program is a cooperative program of the State of Tennessee, The University of Tennessee and the U.S. Census Bureau. Data Centers in each state assist the Bureau by disseminating Census data, other federal data sets and information. | |
Data Center Affiliates
Each center has an internal statewide affiliate network to further assist in disseminating data to local users. These affiliates also have local information and expertise to offer. Visit tnsdc.utk.edu for a full listing of affiliates.
| | | | |