MONTHLY DATA UPDATE

Texas' workforce is carrying more seniors than ever 

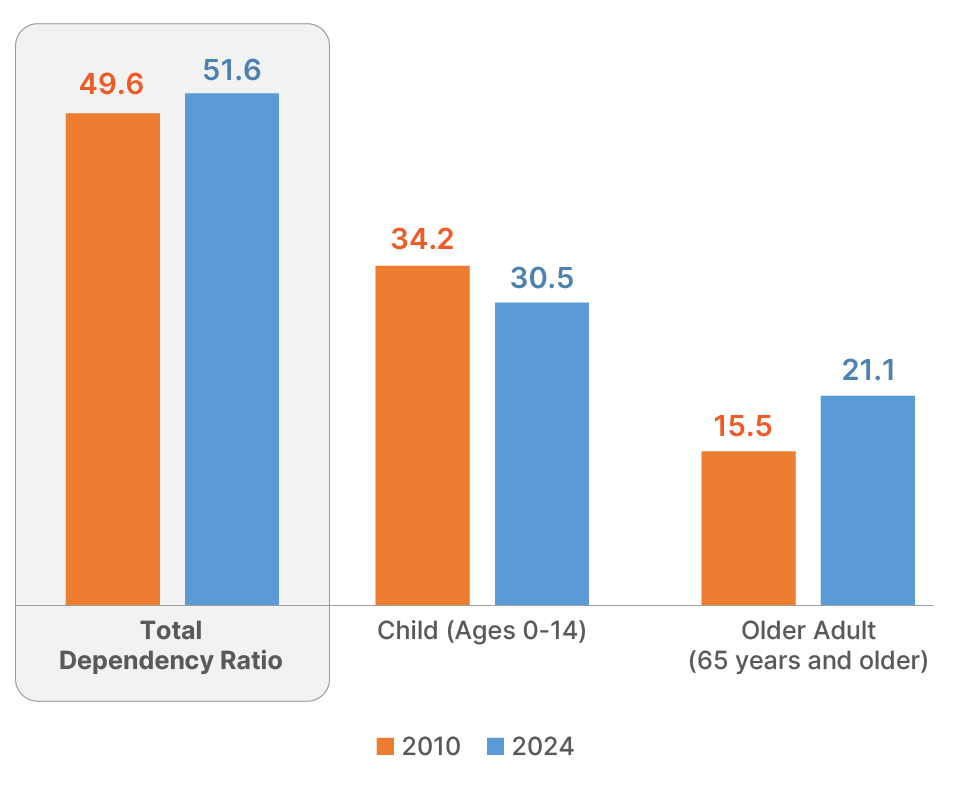
Texas is experiencing a notable demographic shift as its population ages, a trend reflected in the rising dependency ratio across the state. Between 2010 and 2024, the state’s dependency ratio increased significantly, reaching 51.6 in 2024. This means that for every 100 working-age individuals (ages 15–64), there were approximately 52 dependents—children under 15 and adults aged 65 and older. In other words, many working-age adults are caring for both children and senior family members. 


The primary driver of this change has been the rapid growth of the older adult population, which is expanding more quickly than the working-age population. This shift has important implications for the state’s economy, healthcare system, and social services, as a larger share of the population requires support without contributing directly to the labor force.


Age Dependency Ratios in Texas, 2010 - 2024

Source: U.S. Census Bureau, 2010 Decennial Census and Vintage 2024 Population Estimates.

Note: Data are shown as the proportion of dependents per 100 working-age population.

The impact of aging is not uniform across Texas. Counties west of I-35 tend to have the highest dependency ratios, indicating a greater proportion of dependents relative to workers in these areas. These regional disparities suggest that some communities may face more acute challenges in supporting aging populations, particularly in terms of healthcare access, transportation, and caregiving resources.


As Texas continues to grow and age, policymakers and local leaders will need to consider targeted strategies to address the needs of older adults, while also ensuring that the working-age population is equipped to sustain economic productivity and care for dependents.

Age Dependency Ratios in Texas by County, 2024

Source: U.S. Census Bureau, 2010 Decennial Census and Vintage 2024 Population Estimates.

Note: The age dependency ratio is the ratio of dependent (people younger than 15 and older than 64) to the working-age population (those aged 15-64). Data are shown as the proportion of dependents per 100 working-age population.

Explore our Social Media Channels

Stay up-to-date with our newest releases, data visualizations, research findings, and engaging content. Like, comment, and share our posts to spread the word and help us reach a wider audience.

Facebook  Instagram  LinkedIn  X

DATA UPDATES

Back to School: August 2025

Find a busload of Census Bureau data and back-to-school resources on education spending, school enrollment, household internet access, and more in our new Stats for Stories article.

Texas Highlights

Below are some Texas stats based on the back-to-school resources:


Education Pays Off

In 2023, Texas workers had the following median income based on their educational level: 

  • People with a bachelor’s degree earned $66,474
  • High school and GED recipients earned $37,086
  • Those with an education below ninth grade earned $30,388

2022 Custodial Parents and Child Support

The U.S. Census Bureau report provides an overview of the social and economic characteristics of custodial parents and their children in 2022 using data from the 2023 Current Population Survey’s Child Support Supplement (CPS-CSS)

UPCOMING EVENTS

Data Release

2024 Current Population Survey (CPS) Annual Social and Economic Supplement (ASEC)

September 9, 2025

Data Release

American Community Survey 1-Year Estimates


September 11, 2025

Conference

2025 Texas GIS Forum | Texas Geographic Information Office

November 3-7, 2025 | Austin, TX

October 7, 2025 | 2pm (CST) | Online

Facebook  Instagram  LinkedIn  Twitter

August 2025

View as Webpage